

Abstract
Objective
The objective of this study was to develop and to validate the Vascular Quality Initiative (VQI) Cardiac Risk Index (CRI) for prediction of postoperative myocardial infarction (POMI) after vascular surgery.
Methods
We developed risk models for in-hospital POMI after 88,791 nonemergent operations from the VQI registry, including carotid endarterectomy (CEA; n = 45,340), infrainguinal bypass (INFRA; n = 18,054), suprainguinal bypass (SUPRA; n = 2678), endovascular aneurysm repair (EVAR; n = 18,539), and open abdominal aortic aneurysm repair (OAAA repair; n = 4180). Multivariable logistic regression was used to create an all-procedure and four procedure-specific risk calculators based on the derivation cohort from 2012 to 2014 (N = 61,236). Generalizability of the all-procedure model was evaluated by applying it to each procedure subtype. The models were validated using a cohort (N = 27,555) from January 2015 to February 2016. Model discrimination was measured by area under the receiver operating characteristic curve (AUC), and performance was validated by bootstrapping 5000 iterations. The VQI CRI calculator was made available on the Internet and as a free smart phone app available through QxCalculate.
Results
Overall POMI incidence was 1.6%, with variation by procedure type as follows: CEA, 0.8%; EVAR, 1.0%; INFRA, 2.6%; SUPRA, 3.1%; and OAAA repair, 4.3% (P < .001). Predictors of POMI in the all-procedure model included age, operation type, coronary artery disease, congestive heart failure, diabetes, creatinine concentration >1.8 mg/dL, stress test status, and body mass index (AUC, 0.75; 95% confidence interval =CI], 0.73-0.76). The all-procedure model demonstrated only minimally reduced accuracy when it was applied to each procedure, with the following AUCs: CEA, 0.65 (95% CI, 0.59-0.70); INFRA, 0.69 (95% CI, 0.64-0.73); EVAR, 0.72 (95% CI, 0.65-0.80); SUPRA, 0.62 (95% CI, 0.52-0.72); and OAAA, 0.63 (95% CI, 0.56-0.70). Procedure-specific models had unique predictors and showed improved prediction compared with the all-procedure model, with the following AUCs: CEA, 0.69 (95% CI, 0.66-0.72); INFRA, 0.75 (95% CI, 0.73-0.78); EVAR, 0.76 (95% CI, 0.73-0.80); and OAAA, 0.72 (95% CI, 0.69-0.77). Bias-corrected AUC (95% CI) from internal validation for the models was as follows: all procedures, 0.75 (0.73-0.76); CEA, 0.68 (0.65-0.71); INFRA, 0.74 (0.72-0.76); EVAR, 0.73 (0.70-0.78); and OAAA repair, 0.68 (0.65-0.73).
Conclusions
The VQI CRI is a useful and valid clinical decision-making tool to predict POMI after vascular surgery. Procedure-specific models improve accuracy when they include unique risk factors.
Decision-making in vascular surgery has become more complex, given the range of treatment options from medical therapy to endovascular or open revascularization for carotid stenosis, abdominal aortic aneurysm (AAA), and lower extremity occlusive disease. Ideally, the procedure with the greatest efficacy and the lowest risk would be offered to the patient. One critical component of patient and procedure selection in vascular surgery is a careful assessment of cardiac risk. Accurate risk assessment is also a key step in the process of informed patient consent. In addition to affecting procedure choice, the ability to identify patients at high risk for cardiac complications provides an opportunity for medical optimization before surgery. For these reasons, improved cardiac risk assessment is essential in the population of at-risk vascular surgery patients.
Numerous risk predictors have been reported for cardiac complications after noncardiac surgery, with the Revised Cardiac Risk Index (RCRI) remaining the most widely used.1-13 It is recognized that cardiac risk varies across different noncardiac operations, with peripheral vascular surgery among the highest.14 A previous report from the Vascular Study Group of New England (VSGNE) showed that the RCRI underestimated risk for patients undergoing peripheral vascular surgery compared with a risk index derived solely from vascular patients.12
The Vascular Quality Initiative (VQI) is the largest database specifically dedicated to measuring vascular surgery outcomes for the purpose of quality improvement and captures approximately a 20% sample of all centers performing vascular surgery in the United States.15 The objective of this study was to develop and to validate a practical risk prediction tool for postoperative myocardial infarction (POMI) after carotid endarterectomy (CEA), infrainguinal bypass (INFRA), suprainguinal bypass (SUPRA), endovascular aneurysm repair (EVAR), and open AAA (OAAA) repair using the VQI database. To facilitate use of the risk predictor, we included the VQI Cardiac Risk Index (CRI) calculator on a website and a free smart phone app available through QxCalculate.16
METHODS
VQI database
The VQI is a national vascular surgery quality improvement initiative composed of 18 regional quality improvement groups representing more than 350 community and academic hospitals in the United States and Canada. Entry of consecutive procedures by each participating center is ensured by annual audit against hospital claims data submitted by each center.17 Further details about the VQI and the Society for Vascular Surgery Patient Safety Organization are available online at http://www.vascularqualityinitiative.org/.
Patients
This is a retrospective cohort study of nonemergent procedures (N = 88,791) divided into a derivation cohort (N = 61,236) from 2012 to 2014 and a validation cohort (N = 27,555) from January 2015 to February 2016. The derivation cohort included CEA (n = 30,817), INFRA (n = 12,543), SUPRA (n = 1924), EVAR (n = 12,966), and OAAA repair (n = 2986). INFRA includes any femoral artery to infrainguinal artery bypass with autogenous vein or prosthetic conduit. SUPRA includes only aortic operations, such as abdominal aortoiliac or aortofemoral bypass, for occlusive disease. EVAR and OAAA repair include infrarenal aneurysms not involving the renal arteries. Extra-anatomic bypasses, such as axillary-femoral or femoral-femoral bypass, were excluded from analysis because of their heterogeneous nature and the selected patient population inherent in these procedures. Emergency operations, including ruptured AAA repairs, were excluded. Procedure urgency for EVAR and OAAA repair was defined as (1) elective procedure and (2) symptomatic repair within 24 hours for pain or tenderness without rupture. Procedure urgency for INFRA was defined as (1) elective procedure and (2) urgent operation within 72 hours but >12 hours of admission. For CEA, procedure urgency included (1) elective procedure and (2) urgent surgery within 24 hours of admission.
Covariates
More than 150 patient demographic, history, procedure, and postoperative variables are prospectively collected for each procedure in the VQI registry.18,19 Data are entered by physicians, nurses, or dedicated data abstractors, depending on individual center workflow, onto the M2S (West Lebanon, NH) secure cloud-based PATHWAYS platform and include preoperative, intraoperative, and in-hospital postoperative details.
Demographic information included age at the time of the procedure, gender, ethnicity, and race. Comorbidities studied included coronary artery disease (CAD), congestive heart failure (CHF), chronic obstructive pulmonary disease (COPD), diabetes mellitus (insulin dependent or controlled by oral medication or diet), hypertension, and tobacco use (never, <1 year prior, or current). Renal insufficiency was defined as serum creatinine concentration >1.8 mg/dL. Results of preoperative stress testing were defined as not performed; negative for ischemia; or positive for ischemia, myocardial infarction, or both. Stress tests are recorded when they have been obtained within 2 years of surgery and without intervening coronary intervention. Prior coronary revascularization by coronary artery bypass grafting (CABG) or percutaneous coronary intervention was categorized as within 5 or >5 years before the operation. Prior vascular procedures included any CEA, peripheral bypass, aneurysm repair, major leg amputation, or peripheral vascular intervention.
Primary outcome
The primary outcome was POMI occurring during the hospitalization and included POMI by troponin elevation alone or by clinical or electrocardiographic (ECG) criteria. POMI was chosen as the sole end point instead of a composite end point, such as major adverse coronary events, because of the more uniform definition of POMI and the recognition that other cardiac complications, such as CHF and arrhythmias, have diverse causes.20 Troponin-only POMI was included in the primary outcome, given the significant effect of troponin-only POMI on survival reported by the VSGNE and others.21,22 Troponin-only POMI was defined as troponin elevation beyond the normal upper limit established by each center without MB elevation and without other clinical signs, symptoms, or ECG changes consistent with myocardial infarction. Clinical/ECG POMI was defined as clinical symptoms (chest pain or radiation to left arm or jaw) or ECG changes in conjunction with cardiac biomarker abnormality consistent with infarction. In recording of POMI in the VQI registry, only one category is entered, so patients were not doubly classified as having both a troponin-only and a clinical/ECG POMI.
Statistical analysis
Candidate predictors were derived from known factors associated with POMI.11,23 We decided a priori to include all available demographics, comorbidities, and planned surgical details, such as aortic clamp position or intended bypass target, that would be known to the clinician before the operation to make the index applicable to preoperative cardiac risk assessment.
An all-procedures model to predict POMI was developed to include the five procedures (CEA, INFRA, SUPRA, EVAR, and OAAA repair) with operation type included as a covariate. Separate procedure-specific models were also developed for CEA, INFRA, EVAR, and OAAA repair. We did not create a procedure-specific SUPRA model because of the low number of cases and events.
Less than 0.2% of the data were missing information on the patient’s POMI status, and these observations were excluded from the analysis (n = 128 across all procedures). Rates of missing data across candidate predictors ranged from 0% to 2%, with most variables missing in <0.5% of cases. Because missingness rates were so low, missing values were imputed with the mean or the mode.
Before model development, we split the data into derivation and validation data sets. In all cases except the OAAA repair model, we chose the breakpoint for simplicity at January 1, 2015, for CEA, INFRA, and the all-procedures model and at January 1, 2014, for EVAR. Because sample size was limited for OAAA repair, we split the data at May 1, 2014, to ensure at least 100 events in the validation data set.
Risk model construction
The R statistical software package (version 3.1.3; The R Foundation for Statistical Computing, Vienna, Austria), including the analytic tools provided in the “rms” package,24 was used to perform all analyses. We used t-tests and χ2 or Fisher exact tests as appropriate to compare the POMI and no-POMI groups in the derivation data sets. The results of these univariate tests were not used exclusively in variable selection. We then entered all candidate predictors into a logistic regression model with POMI as outcome and boot-strapped the stepwise variable elimination method of Lawless and Singhal 100 times.25 We ranked predictors according to the number of times each was selected for a final model and then determined the cumulative areas under the receiver operating characteristic curve (AUCs) of a series of reduced models with each predictor added in rank order. All predictors needed to bring the AUC of the reduced model to within 1% of the AUC of the full model were chosen for inclusion in the final model. We used penalized maximum likelihood estimation to correct the model coefficients for overfitting.24 We used the method of Efron to internally validate the penalized model. Using the bootstrap (1000 iterations), we estimated the bias due to overfitting or “optimism” in the AUC and the calibration intercept and slope of each model.26 We subtracted the optimism from the original estimates to arrive at “bias-corrected” estimates of these parameters that we would expect to observe in a new data set and then used the values to estimate 95% confidence interval (CI) for the bias-corrected AUCs. VQI data include multiple observations from each of many hospitals, introducing dependency among observations from the same medical center. To account for this dependency, we used the robust covariance matrix method of Huber and White to adjust the standard errors and P values of the coefficients.27,28
Risk model validation
External validation of the model was based on independent data sets from the following time periods: all-procedures from January 2015 to February 2016 consisting of CEA (n = 14,523), INFRA (n = 5511), SUPRA (n = 754), EVAR (n = 5573), and OAAA repair (n = 1194); CEA and INFRA models from January 2015 to February 2016 (n = 14,746 for CEA; n = 5494 for INFRA); EVAR model from January 2014 to February 2016 (n = 11,232); and OAAA repair model from May 2014 to February 2016 (n = 2048). For all models, we used the coefficients of the penalized model to estimate the probability of POMI for each patient in the validation data set, and we report the resulting AUC on the validation set (with a bootstrapped CI, 5000 iterations). Model calibration was tested using the Hosmer-Lemeshow goodness-of-fit statistic. We also plotted the observed probability of POMI in the validation set against the deciles of model-predicted probability, and we report the intercept and slope of the resulting line of best fit.
To compare the performance of the all-procedures model and the procedure-specific models in individual data registries, we used observations from the validation data set created for the all-procedures model. We assessed the discrimination and calibration of the all-procedures model when it was used to predict outcome for each procedure separately, and we compared that to the discrimination and calibration of the procedure-specific model when it was used to predict outcome for the same patients.
VQI cardiac risk calculator
The VQI CRI algorithm was entered onto a website and made available in a free smart phone application for IOS and Android devices through QxCalculate.16
This study was approved by the VQI Research Advisory Committee. The need for patient consent was waived by the Institutional Review Board at the University of Vermont Medical Center based on use of deidentified patient data.
RESULTS
Univariable analysis
For the all-procedures model VQI derivation cohort (N = 61,236), POMI occurred in 1.6% of patients (n = 950), with distribution of troponin-only POMI in 0.9% (n = 528) vs clinical/ECG-diagnosed POMI in 0.7% (n = 422; Table I). Significant differences in POMI rates were noted by procedural type: CEA, 0.9% (n = 270); EVAR, 1.1% (n = 138); INFRA, 2.8% (n = 349); SUPRA, 2.7% (n = 51); and OAAA repair, 4.9% (n = 142; P < .0001). Rates of troponin-only vs clinical/ ECG POMI for each procedure were as follows: CEA, 0.4% vs 0.4%; INFRA, 1.4% vs 1.4%; SUPRA, 1.3% vs 1.4%; EVAR, 0.8% vs 0.5%; and OAAA repair, 2.8% vs 2.0%.
Table I.
Operation type and patient characteristics with and without postoperative myocardial infarction (POMI) for Vascular Quality Initiative (VQI) derivation cohort (2012-2014)
|
Overall, %
(N = 61,236) |
No POMI, %
(n = 60,286) |
POMI, %
(n = 950) |
P valuea |
|
|---|---|---|---|---|
| Procedure | ||||
| CEA | 50.3 | 99.1 | 0.9 | <.0001 |
| EVAR | 21.2 | 98.9 | 1.1 | |
| INFRA | 20.5 | 97.2 | 2.8 | |
| SUPRA | 3.1 | 97.3 | 2.7 | |
| OAAA | 4.9 | 95.2 | 4.8 | |
| Urgency | ||||
| Elective | 86.1 | 98.5 | 1.5 | <.0001 |
| Symptomatic | 13.9 | 97.8 | 2.2 | |
| Age, years, mean | 70 | 70 | 72 | <.0001 |
| Age category, years | ||||
| <60 | 15.2 | 98.9 | 1.1 | <.0001 |
| 60-69 | 31.0 | 98.6 | 1.4 | |
| 70-79 | 35.4 | 98.5 | 1.5 | |
| >80 | 18.5 | 97.8 | 2.2 | |
| Gender | ||||
| Male | 66.4 | 98.5 | 1.5 | .873 |
| Female | 33.6 | 98.4 | 1.6 | |
| Race | ||||
| White | 89.4 | 98.5 | 1.5 | .478 |
| Black | 7.0 | 98.4 | 1.6 | |
| Other | 3.6 | 98.1 | 1.9 | |
| Ethnicity | ||||
| Non-Hispanic | 96.5 | 98.5 | 1.5 | .665 |
| Hispanic | 3.5 | 98.3 | 1.7 | |
| BMI, mean | 28 | 28 | 27 | <.0001 |
| BMI quartile | ||||
| ≤24 | 25.4 | 98.1 | 1.9 | <.0001 |
| >24 and ≤27 | 25.0 | 98.4 | 1.6 | |
| >27 and ≤31 | 24.9 | 98.7 | 1.3 | |
| >31 | 24.8 | 98.7 | 1.3 | |
| CAD | ||||
| None | 72.2 | 98.8 | 1.2 | <.0001 |
| Asymptomatic | 19.2 | 97.7 | 2.3 | |
| Symptomatic | 8.7 | 97.1 | 2.9 | |
| Stress test | ||||
| Not done | 64.1 | 98.6 | 1.4 | <.0001 |
| Normal | 27.2 | 98.7 | 1.3 | |
| Abnormal | 8.7 | 96.9 | 8.7 | |
| Diabetes | ||||
| None | 66.5 | 98.7 | 1.3 | <.0001 |
| Diet | 4.4 | 98.2 | 1.8 | |
| Noninsulin medication |
16.2 | 98.4 | 1.6 | |
| Insulin | 13.0 | 97.4 | 2.6 | |
| Creatinine | ||||
| ≤1.8 mg/dL | 92.7 | 98.6 | 1.4 | <.0001 |
| >1.8 mg/dL | 5.4 | 96.2 | 3.8 | |
| Dialysis | 2.0 | 95.7 | 4.3 | |
| CHF | ||||
| None | 88.5 | 98.7 | 1.3 | <.0001 |
| History, asymptomatic |
6.7 | 96.9 | 3.1 | |
| Symptomatic | 4.8 | 96.4 | 3.6 | |
| Smoking status | ||||
| Never | 19.7 | 98.5 | 1.5 | .060 |
| Prior | 47.2 | 98.3 | 1.7 | |
| Current | 47.2 | 98.6 | 1.4 | |
| HTN | ||||
| No | 12.9 | 99.0 | 1.0 | <.0001 |
| Yes | 87.1 | 98.4 | 1.6 | |
| COPD | ||||
| None | 74.9 | 98.5 | 1.5 | .011 |
| Yes, not on medication |
8.4 | 98.0 | 2.0 | |
| Yes, medication/ oxygen |
16.8 | 98.4 | 1.6 | |
| History peripheral bypass | ||||
| No | 89.9 | 98.6 | 1.4 | <.0001 |
| Yes | 10.1 | 97.4 | 2.6 | |
| Prior CABG or PCI | ||||
| No | 67.4 | 98.8 | 1.2 | <.0001 |
| Yes | 32.6 | 97.8 | 2.2 | |
BMI, Body mass index; CABG, coronary artery bypass graft; CAD, coronary artery disease; CEA, carotid endarterectomy; CHF, congestive heart failure; COPD, chronic obstructive pulmonary disease; EVAR, endovascular abdominal aortic aneurysm repair; HTN, hypertension; INFRA, infrain-guinal bypass; MI, myocardial infarction; OAAA, open infrarenal abdominal aortic aneurysm repair; PCI, percutaneous coronary intervention; SUPRA, suprainguinal bypass.
P value from χ2 test for categorical variables, statistical significance at P < .05.
Patients with POMI were older (mean, 72 vs 70 years), with no significant gender or racial differences. Patients with POMI had significantly more comorbidities, including CAD, hypertension, diabetes, CHF, COPD, and renal insufficiency. A history of prior peripheral bypass procedure or prior coronary revascularization was associated with higher rates of POMI. Patient and procedure characteristics of the CEA, INFRA, EVAR, and OAAA repair derivation cohorts are separately detailed in Supplementary Tables I-IV (online only). Anesthesia type did not show a statistically significant difference on POMI for CEA, INFRA, EVAR, and OAAA repair.
Multivariable analysis: all-procedure model
Variables significantly associated with risk for POMI in the all-procedures model are shown in Table II. Procedure type had the greatest impact, with increasing level of risk from EVAR (odds ratio =OR], 1.2) to INFRA (OR, 3.1), SUPRA (OR, 4.9), and OAAA repair (OR, 6.7) in comparison to CEA as the reference operation. The all-procedures model discrimination was good with a bias-corrected AUC of 0.74 (0.73-0.76). Calibration of the all-procedure model was excellent (Hosmer-Lemeshow goodness of fit test, P = 1), with bias-corrected calibration intercept of −0.02 and slope of 0.99.
Table II.
Variables associated with postoperative myocardial infarction (POMI) in stepwise logistic regression analysis for Vascular Quality Initiative (VQI) all-procedures model (2012-2014)
| Risk factor | Coefficient | SEa | OR | P valuea |
|---|---|---|---|---|
| Intercept | −5.82 | 0.14 | — | — |
| Procedure | ||||
| CEA (referent) | 0 | — | — | — |
| EVAR | 0.17 | 0.16 | 1.2 | .2901 |
| INFRA | 1.12 | 0.09 | 3.1 | <.0001 |
| SUPRA | 1.60 | 0.15 | 4.9 | <.0001 |
| OAAA | 1.91 | 0.13 | 6.7 | <.0001 |
| Age, years | ||||
| <60 (referent) | 0 | — | — | — |
| 60-69 | 0.44 | 0.13 | 1.6 | .0006 |
| 70-79 | 0.64 | 0.13 | 1.9 | <.0001 |
| ≥80 | 1.10 | 0.14 | 3.0 | <.0001 |
| Creatinine | ||||
| ≤1.8 mg/dL | 0 | — | — | — |
| >1.8 mg/dL | 0.76 | 0.11 | 2.1 | <.0001 |
| On dialysis | 0.64 | 0.16 | 1.9 | <.0001 |
| Stress test | ||||
| Not performed (referent) | 0 | — | — | — |
| Normal | −0.15 | 0.09 | 0.9 | .0967 |
| Abnormal | 0.46 | 0.11 | 1.6 | <.0001 |
| CAD | ||||
| None | 0 | — | — | — |
| Asymptomatic | 0.40 | 0.09 | 1.5 | <.0001 |
| Symptomatic | 0.76 | 0.09 | 2.1 | <.0001 |
| Diabetes | ||||
| None (referent) | 0 | — | — | — |
| Diet controlled | 0.18 | 0.15 | 1.2 | .2251 |
| Noninsulin medication | 0.20 | 0.08 | 1.2 | .0152 |
| Insulin | 0.39 | 0.09 | 1.5 | <.0001 |
| CHF | ||||
| None (referent) | 0 | — | — | — |
| Asymptomatic | 0.44 | 0.10 | 1.5 | <.0001 |
| Symptomatic | 0.50 | 0.13 | 1.7 | <.0001 |
CAD, Coronary artery disease; CEA, carotid endarterectomy; CHF, congestive heart failure; EVAR, endovascular aneurysm repair; INFRA, infrainguinal bypass; OAAA, open infrarenal abdominal aortic aneurysm repair; OR, odds ratio; SE, standard error; SUPRA, suprainguinal bypass. Area under receiver operating characteristic curve (AUC), 0.75 (95% confidence interval [CI], 0.73-0.76); internal validation AUC, 0.75 (95% CI, 0.73-0.76); external validation AUC, 0.76 (95% CI, 0.73-0.78).
Inconsistent discrimination was noted when the all-procedures model was applied separately to the four procedures with bootstrapped AUCs (95% CI): CEA, 0.69 (0.66-0.72); INFRA, 0.75 (0.73-0.78); EVAR, 0.76 (0.73-0.80); and OAAA repair, 0.72 (0.69-0.77). Given this finding, procedure-specific models were developed.
Multivariable analysis: procedure-specific models
Variables significantly associated with risk for POMI in the CEA model are shown in Table III. Model discrimination was fair, with an uncorrected AUC of 0.69 (95% CI, 0.66-0.72), and calibration was excellent (Hosmer-Lemeshow goodness of fit test, P = 1).
Table III.
Vascular Quality Initiative (VQI) Cardiac Risk Index (CRI) carotid endarterectomy (CEA) model for postoperative myocardial infarction (POMI)
|
CEA
|
||
|---|---|---|
| OR (95% CI) | P value | |
| Age category, years | ||
| 61-69 vs <60 | 1.2 (0.9-1.6) | .31 |
| 70-79 vs <60 | 1.3 (0.9-1.3) | .15 |
| ≥80 vs <60 | 2.0 (1.4-2.9) | <.001 |
| Creatinine | ||
| ≥1.8 mg/dL or dialysis | 1.8 (1.3-2.5) | <.001 |
| Stress test | ||
| Normal vs not done | 0.8 (0.60-1.1) | .11 |
| Abnormal vs not done | 1.5 (1.2-2.0) | .001 |
| Prior vascular procedure | 1.6 (1.3-2.0) | <.001 |
| CAD | ||
| Asymptomatic vs none | 1.4 (1.0-1.8) | .03 |
| Symptomatic vs none | 1.7 (1.3-2.2) | <.001 |
| Diabetes | ||
| Diet/medication vs none | 1.3 (1.0-1.6) | .06 |
| Insulin vs none | 1.6 (1.2-2.0) | <.001 |
| CHF | ||
| Asymptomatic vs none | 1.3 (1.0-1.8) | .06 |
| Symptomatic vs none | 1.4 (1.0-1.9) | .04 |
| History of CABG/PCI | 1.2 (0.9-1.5) | .30 |
| AUC, derivation | 0.69 (0.66-0.72) | — |
| AUC, internal validation | 0.68 (0.65-0.71) | — |
| AUC, external validation | 0.65 (0.60-0.71) | — |
AUC, Area under receiver operating characteristic curve; CABG, coronary artery bypass graft; CAD, coronary artery disease; CHF, congestive heart failure; CI, confidence interval; OR, odds ratio; PCI, percutaneous coronary intervention.
Variables significantly associated with risk for POMI after INFRA are shown in Table IV. Model discrimination was good, with an uncorrected AUC of 0.75 (95% CI, 0.73-0.78), and calibration was excellent (Hosmer-Leme-show goodness of fit test, P = 1).
Table IV.
Vascular Quality Initiative (VQI) Cardiac Risk Index (CRI) infrainguinal bypass (INFRA) model for postoperative myocardial infarction (POMI)
|
INFRA
|
||
|---|---|---|
| OR (95% CI) | P value | |
| Age (continuous)a | 1.0 (1.02-1.04) | <.001 |
| Creatinine | ||
| ≥1.8 vs <1.8 mg/dL | 1.3 (1.0-1.6) | .08 |
| Dialysis vs <1.8 mg/dL | 1.5 (1.1-2.0) | .004 |
| Stress test | ||
| Normal vs not done | 0.9 (0.7-1.1) | .36 |
| Abnormal vs not done | 1.5 (1.2-2.0) | .002 |
| CAD | ||
| Asymptomatic vs none | 1.6 (1.3-2.1) | <.001 |
| Symptomatic vs none | 2.2 (1.6-2.9) | <.001 |
| Diabetes | ||
| Diet/oral medication vs none | 1.2 (0.9-1.6) | .11 |
| Insulin vs none | 1.6 (1.2-2.0) | .001 |
| CHF | ||
| Asymptomatic vs none | 1.5 (1.2-1.8) | .001 |
| Symptomatic vs none | 1.4 (1.0-1.8) | .04 |
| Race | ||
| Black vs white | 0.7 (0.6- 0.9) | .01 |
| Other vs white | 1.1 (0.7-1.6) | .70 |
| Hypertension | 2.2 (1.4-3.4) | <.001 |
| Indication | ||
| Rest pain vs IC | 1.8 (1.3-2.3) | <.001 |
| Tissue loss vs IC | 1.8 (1.4-2.3) | <.001 |
| Acute ischemia vs IC | 1.9 (1.4-2.7) | <.001 |
| Infrapopliteal distal anastomosis | 1.4 (1.2-1.7) | <.001 |
| Smoking | ||
| Prior vs never | 1.1 (0.90-1.4) | .27 |
| Current vs never | 0.8 (0.62-1.1) | .27 |
| AUC, derivation | 0.75 (0.73-0.78) | — |
| AUC, internal validation | 0.74 (0.72-0.76) | — |
| AUC, external validation | 0.72 (0.68-0.76) | — |
AUC, Area under receiver operating characteristic curve; CAD, coronary artery disease; CHF, congestive heart failure; CI, confidence interval; IC, intermittent claudication; OR, odds ratio.
Age as continuous variable because relationship with risk is nonlinear.
Variables significantly associated with risk for POMI in the EVAR model are shown in Table V. Model performance was good, with an uncorrected AUC of 0.76 (95% CI, 0.73-0.80), and calibration was excellent (Hosmer-Lemeshow goodness of fit test, P = 1). Variables significantly associated with risk for POMI after OAAA repair are shown in Table VI. Body mass index (BMI) showed an inverse relationship, with the lowest quartile associated with the highest risk of POMI. Model performance was fair, with an uncorrected AUC of 0.72 (95% CI, 0.69-0.77), and calibration was excellent (Hosmer-Lemeshow goodness of fit test, P = 1).
Table V.
Vascular Quality Initiative (VQI) Cardiac Risk Index (CRI) endovascular aneurysm repair (EVAR) model for postoperative myocardial infarction (POMI)
|
EVAR
|
||
|---|---|---|
| Variable in model | OR (95% CI) | P value |
| Age continuous | 1.0 (1.0-1.1) | <.001 |
| Creatinine | ||
| ≥1.8 mg/dL or dialysis | 2.0 (1.2-3.3) | .006 |
| Stress test | ||
| Normal vs not done | 0.9 (0.6-1.3) | .50 |
| Abnormal vs not done | 1.4 (0.9-2.1) | .08 |
| CAD | ||
| Asymptomatic vs none | 1.4 (1.0-1.9) | .02 |
| Symptomatic vs none | 1.9 (1.3-2.6) | <.001 |
| Diabetes | 1.5 (1.1-2.0) | .007 |
| CHF symptomatic vs asymptomatic/ none |
2.7 (1.7-4.2) | <.001 |
| Urgency symptomatic | 2.4 (1.6-3.8) | <.001 |
| AAA diameter, mm | ||
| 55-60 vs <55 | 1.0 (0.69-1.6) | .87 |
| >60 vs <55 | 1.5 (1.0-2.2) | .05 |
| COPD | ||
| Untreated vs none | 1.5 (1.0-2.2) | .05 |
| Medication/oxygen vs none | 1.2 (0.90-1.6) | .20 |
| History of bypass | 1.7 (0.8-3.8) | .16 |
| AUC, derivation | 0.76 (0.73-0.80) | — |
| AUC, internal validation | 0.73 (0.70-0.78) | — |
| AUC, external validation | 0.73 (0.68-0.78) | — |
AAA, Abdominal aortic aneurysm; AUC, area under receiver operating characteristic curve; CAD, coronary artery disease; CHF, congestive heart failure; CI, confidence interval; COPD, chronic obstructive pulmonary disease; OR, odds ratio.
Table VI.
Vascular Quality Initiative (VQI) Cardiac Risk Index (CRI) open abdominal aortic aneurysm (OAAA) repair model for postoperative myocardial infarction (POMI)
|
OAAA repair
|
||
|---|---|---|
| Variable in model | OR (95% CI) | P value |
| Age continuous | 1.0 (1.0-1.1) | <.001 |
| Creatinine ≥1.8 mg/dL or dialysis | 2.0 (1.3-3.0) | <.001 |
| Stress test | ||
| Normal vs not done | 1.1 (0.8-1.6) | .41 |
| Abnormal vs not done | 1.4 (1.0-1.9) | .08 |
| Prior vascular procedure | 1.7 (1.1-2.6) | .01 |
| CHF any vs none | 1.5 (0.9-2.5) | .08 |
| History of CABG/PCI | 1.5 (1.0-2.2) | .05 |
| Race nonwhite | 1.6 (0.9-2.9) | .08 |
| COPD | ||
| History vs none | 1.6 (1.1-2.1) | .007 |
| Medication/oxygen vs none | 1.4 (1.0-2.1) | .04 |
| Proximal clamp, infrarenal (referent) | ||
| Above one renal artery | 1.2 (0.81-1.8) | .26 |
| Above two renal arteries | 1.0 (0.74-1.5) | .80 |
| Supraceliac | 1.9 (1.3-3.0) | .002 |
| Distal anastomosis | ||
| CIA vs aorta | 1.1 (0.84-1.5) | .46 |
| EIA/CFA vs aorta | 1.3 (0.9-1.8) | .16 |
| BMI | ||
| 2nd vs 1st quartile | 0.9 (0.63-1.2) | .33 |
| 3rd vs 1st quartile | 0.8 (0.63-1.2) | .28 |
| 4th vs 1st quartile | 0.6 (0.45-0.92) | .01 |
| AUC, derivation | 0.72 (0.69-0.77) | — |
| AUC, internal validation | 0.68 (0.65-0.73) | — |
| AUC, external validation | 0.66 (0.61-0.72) | — |
AUC, Area under receiver operating characteristic curve; BMI, body mass index; CABG, coronary artery bypass graft; CFA, common femoral artery; CHF, congestive heart failure; CI, confidence interval; CIA, common iliac artery; COPD, chronic obstructive pulmonary disease; EIA, external iliac artery; PCI, percutaneous coronary intervention.
Increasing age, renal insufficiency (defined as creatinine concentration >1.8 mg/dL), history of CHF, and abnormal cardiac stress test result were common predictors for POMI across the four operations. Diabetes and a history of CAD were predictors for POMI after CEA, INFRA, and EVAR. COPD was associated with increased risk of POMI after EVAR and OAAA repair. Hypertension was uniquely associated with POMI after INFRA. The indication for INFRA emerged as a strong predictor of POMI, with critical limb ischemia, defined as ischemic rest pain or tissue loss, associated with significantly higher risk than claudication. Certain surgical variables were associated with increased POMI, including the level of distal arterial anastomosis during INFRA and the proximal and distal aortic clamp position during OAAA repair. Larger aneurysm size was associated with increased risk of POMI for EVAR but not for OAAA repair.
VQI CRI validation
Within the validation cohort for the all-procedures model, the overall POMI rate was 1.4% (328/27,555), with 0.7% troponin only and 0.7% clinical/ ECG. Rates of troponin-only vs clinical/ECG POMI in the procedure-specific validation cohorts were as follows: CEA, 0.3% vs 0.4%; INFRA, 1.2% vs 1.3%; SUPRA, 1.6% vs 1.5%; EVAR, 0.5% vs 0.3%; and OAAA repair, 3.3% vs 1.7%. Internal validation of the derived models by bootstrapping yielded the following bias-corrected AUCs (95% CI) for the models (Table III): all-procedure, 0.75 (0.73-0.76); CEA, 0.68 (0.65-0.71); INFRA, 0.74 (0.72-0.76); EVAR, 0.73 (0.70-0.78); and OAAA repair, 0.68 (0.65-0.73). Bias-corrected calibration intercepts and slopes, respectively, were as follows: all-procedure, −0.02 and 0.99; CEA, 0.11 and 1.02; INFRA, 0.01 and 1.00; EVAR, 0.09 and 1.02; OAAA repair, 0.04 and 1.02. External validation against a separate cohort resulted in the following AUCs (95% CI) for the models: all-procedure, 0.76 (0.73-0.78); CEA, 0.65 (0.60-0.71); INFRA, 0.72 (0.68-0.76); EVAR, 0.73 (0.68-0.78); and OAAA, 0.66 (0.61-0.72).
The all-procedures model approximated the observed risk in the validation cohort closely as shown in the calibration plot (Fig 1). Similar results were found in the procedure-specific models, where the predicted risk paralleled the observed risk in the validation cohort (Fig 2). The deciles of risk of POMI based on cumulative risk factors are illustrated in Fig 3 for the four procedures.
Fig 1.
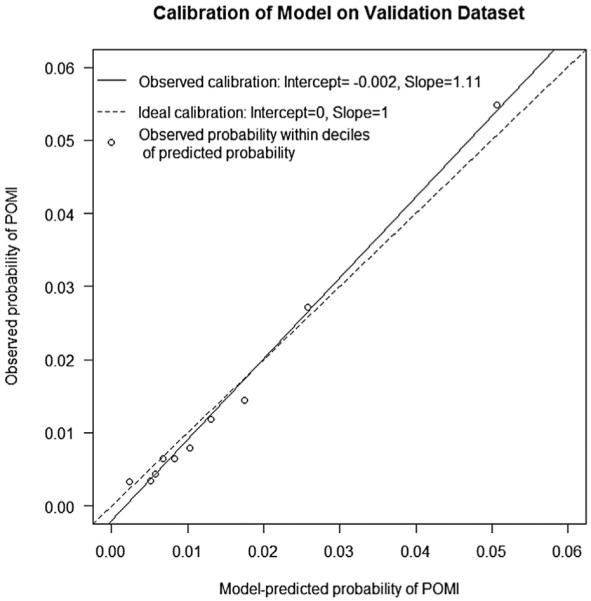
Calibration plot of observed vs predicted probability of postoperative myocardial infarction (POMI) for the all-procedure model. The circles represent observed groups.
Fig 2.

Calibration plot of observed vs expected postoperative myocardial infarction (POMI) rates for (A) carotid endarterectomy (CEA), (B) infrainguinal bypass (INFRA), (C) endovascular aneurysm repair (EVAR), and (D) open abdominal aortic aneurysm (OAAA) repair. The circles represent observed probability of POMI within each decile of model-predicted probability of POMI.
Fig 3.
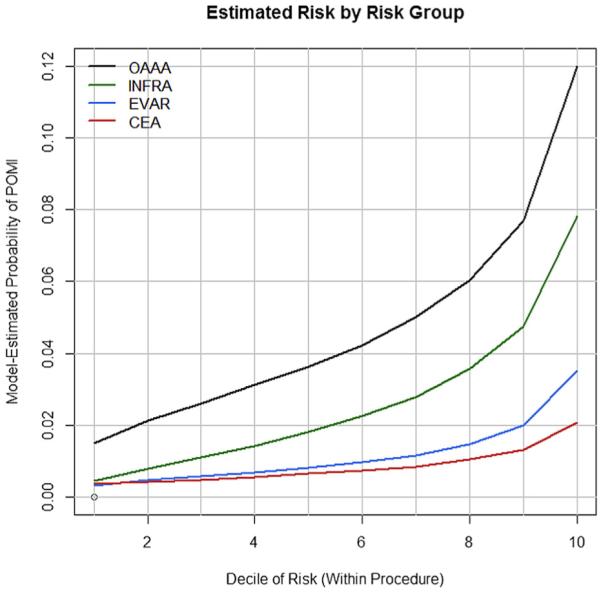
Vascular Quality Initiative (VQI) Cardiac Risk Index (CRI) deciles of risk and estimated probability of postoperative myocardial infarction (POMI) after open abdominal aortic aneurysm (OAAA) repair, infrainguinal bypass (INFRA), endovascular aneurysm repair (EVAR), and carotid endarterectomy (CEA).
VQI CRI calculator
The risk prediction algorithm was built into a smart phone app and website. The risk calculators may be accessed via the Internet through the following links: http://qx.md/cea, http://qx.md/bypass; http://qx.md/evar; and http://qx.md/aaa. A screen shot of the calculator for risk of POMI after OAAA repair appears in Fig 4. Examples of the different levels of predicted risk of POMI based on the procedure-specific calculators for hypothetical patients include the following:
Fig 4.
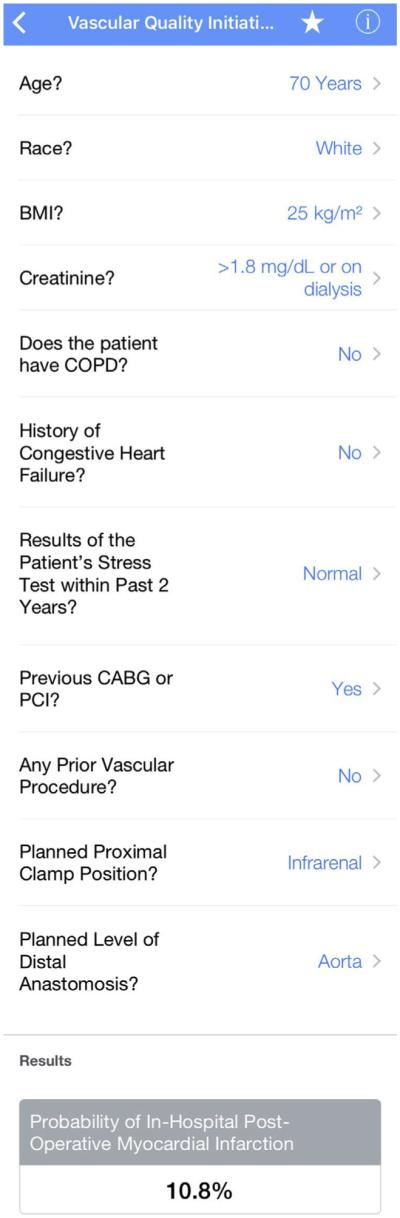
Screen shot of the Vascular Quality Initiative (VQI) Cardiac Risk Index (CRI) predictor smart phone app illustrating predicted risk of postoperative myocardial infarction (POMI) for hypothetical patient undergoing open abdominal aortic aneurysm (OAAA) repair.
A 75-year-old patient with CAD status post CABG without CHF, nondiabetic with normal renal function, no preoperative stress test, and no prior peripheral vascular surgery undergoing CEA: 0.7%
A 75-year-old patient with CAD status post CABG without CHF, diabetes on insulin with renal insufficiency, no preoperative stress test, and no prior peripheral vascular surgery undergoing CEA: 2.2%
A 70-year-old white current smoker with hypertension and no CAD, CHF, diabetes, or renal insufficiency with normal stress test undergoing INFRA for claudication with planned bypass to the popliteal artery: 0.7%
A 70-year-old white prior smoker with hypertension, diabetes on insulin, and renal insufficiency without CAD or CHF and no stress test done undergoing INFRA for critical limb ischemia with planned bypass to the posterior tibial artery: 5.6%
A 75-year-old patient with CHF, without CAD, COPD, or diabetes with normal renal function, no stress test done, and no prior peripheral bypass undergoing elective EVAR for 6-cm AAA: 1.2%
A 75-year-old patient with CHF, without CAD or COPD but with diabetes and renal insufficiency, no stress test done and no prior peripheral bypass undergoing elective EVAR for 6-cm AAA: 3.6%
A 60-year-old white patient without CHF, COPD, prior vascular surgery, or coronary revascularization, normal renal function with BMI 25 and a normal stress test undergoing OAAA repair with planned infrarenal clamp and distal anastomosis to the aorta: 1.7%
A 60-year-old white patient without CHF, COPD, prior vascular surgery, or coronary revascularization, renal insufficiency and BMI 25 and a normal stress test undergoing OAAA repair with planned suprarenal clamp and distal anastomosis to the common femoral arteries: 9.7%
DISCUSSION
This study leverages the largest vascular surgery-specific database assembled to date to derive and to validate the VQI CRI as an alternative cardiac risk prediction tool that is specific to vascular surgery. This population of patients has been recognized to have higher risk compared with patients undergoing other noncardiac operations.14 Therefore, accurate cardiac risk assessment is paramount.
POMI, including troponin-only elevation, is associated with higher postoperative mortality and decreased longterm survival after vascular surgery.21,22 We recognize that late mortality after a troponin-only POMI may be from cardiovascular or noncardiovascular causes and that it is unknown if the cardiac risks are modifiable after these at-risk patients are identified. Understanding this, we combined troponin-only and clinically determined POMI as end points to obtain a more robust and clinically relevant prediction model. Whereas postoperative CHF and arrhythmia are important cardiac end points as well, we deliberately chose POMI alone as the primary outcome in an effort to improve model accuracy by focusing on an end point that has a more uniform pathophysiologic process. Including other outcomes, such as CHF, which may have causes other than myocardial ischemia, can introduce heterogeneity and mitigate the model’s ability to predict POMI.20
Previous studies have highlighted the limitation of the RCRI when it is applied to modern general and vascular surgery.12,13,29-32 We previously reported that the RCRI was accurate in predicting cardiac complications after low-risk CEA but substantially underestimated risk after higher risk INFRA, EVAR, and OAAA repair operations. This study expands on that work through analysis of a vascular surgery-only cohort that is 14 times larger than the mixed surgical cohort used to derive the RCRI. In addition, the all-procedures VQI CRI model, unlike the VSGNE CRI, is applicable to patients undergoing open aortic surgery for occlusive disease and focuses on POMI alone rather than on the more heterogeneous combined end point of POMI, CHF, or arrhythmia. Furthermore, unlike the original RCRI, this study includes procedures performed in the endovascular era. Selection of patients for open aneurysm repair and leg bypass surgery has changed significantly with the emergence of EVAR and peripheral vascular intervention, making the VQI CRI more applicable to today’s vascular surgery patient.32,33
The accuracy of the VQI CRI is comparable to the American College of Surgeons National Surgical Quality Improvement Program cardiac risk calculator,13 which was reported to have a C statistic of 0.75 when applied to vascular surgery without specification of how the model performed across different types of vascular operations. This study illustrates that accuracy decreases when generalized models are applied to specific vascular operations.
We identified increasing age, renal insufficiency, history of CHF, and abnormal cardiac stress test as common independent predictors of POMI for all vascular operations studied. History of CAD and diabetes were independently associated with higher risk of POMI after CEA, INFRA, and EVAR but not for OAAA repair. Although it is contrary to clinical assumptions, a history of CAD was not predictive in the OAAA repair cohort, possibly because of the appropriate selection of patients for endovascular vs open repair. For patients undergoing CEA and OAAA repair, prior coronary revascularization was associated with higher risk of POMI compared with no prior revascularization. Our study and the VQI database are not designed to test the current efficacy of prior coronary revascularization. Instead, this finding is likely a surrogate marker for CAD. Any history of a peripheral vascular procedure before CEA and OAAA repair and history of peripheral bypass for EVAR were associated with increased POMI risk. This previously unreported risk factor likely reflects a higher systemic burden of atherosclerotic disease. Notably, the Society of Thoracic Surgeons Cardiac Surgery Risk Calculator includes a history of peripheral arterial disease in its risk index for CABG.34
Beyond the recognition that vascular surgery patients in general have unique cardiac risks, we find that the risk of POMI is strongly associated with the type of vascular procedure. Operations such as CEA and EVAR are lower risk compared with leg bypass surgery and open aortic reconstructions. Recognizing this, we sought to further elucidate these differences and found procedure-specific characteristics that uniquely increased the risk of POMI.
For example, INFRA operations performed for critical limb ischemia and bypasses to more distal vessels have higher cardiac risk than those performed for claudication. Aortic clamp position at the supraceliac level greatly increases the risk of POMI after OAAA repair. Larger AAA size was associated with increased cardiac risk for endovascular repair but not for OAAA repair. This finding mandates close communication between the vascular surgeon and other clinicians performing cardiac assessment as a crucial step in accurately defining the level of risk. Recognition of these subtleties is an important step toward improving risk prediction and managing patient risk and indicates that a procedure-specific model is often preferable to a general all-procedure model.
Utilization of medical smart phone applications is increasing.35 The VSGNE CRI was viewed >200,000 times through the QxCalculate app and webpage (personal communication with Daniel Schwartz and QxCalculate, August 27, 2015). The VQI CRI will be publically available through the QxCalculate as a free smart phone application. We recommend that clinicians use procedure-specific risk calculators available through this application because of their greater accuracy compared with general all-procedure models and their ease of use.
There are certain limitations inherent to this study. First, although the VQI database includes an extensive list of clinical variables, the results may be limited by unrecorded confounders. Whereas the VQI registry includes important cardiac comorbidities and results of preoperative cardiac testing, certain information, such as valvular heart disease, is not recorded in the database. We decided a priori to include patient and operative factors that would be reasonably known by clinicians performing preoperative cardiac risk assessment. We recognize that procedure-specific information, such as aortic clamp position and level of arterial anastomosis, may not be known by nonsurgeons. This emphasizes the need for close communication between the surgeon and other physicians involved with the individual patient’s cardiac risk assessment.
The VQI CRI does not apply to emergency surgery because cardiac risk assessment is typically limited by time restraints, and the opportunity for medical optimization is constrained. Second, the VQI definition of POMI, although explicit, does not exactly mirror the universal definition of myocardial infarction.36,37 Specifically, POMI was classified as diagnosed by clinical symptoms or by the institution-established troponin levels without stipulation that cardiac biomarkers be above the 99th percentile of the upper reference limit. Third, the prediction models contain a large number of variables. In the era of electronic medical records and mobile phone health applications, this limitation is less relevant than in the past.
CONCLUSIONS
Cardiac risk assessment should be individualized with attention to the specific vascular operation. The VQI CRI is a valid and practical clinical decision-making tool to predict POMI after vascular surgery. The availability of the VQI CRI as a smart phone medical application can supplement the clinician’s cardiac risk assessment, guide procedure selection, and identify patients in need of medical optimization before surgery.
Supplementary Material
Footnotes
Author conflict of interest: none.
The editors and reviewers of this article have no relevant financial relationships to disclose per the JVS policy that requires reviewers to decline review of any manuscript for which they may have a conflict of interest.
AUTHOR CONTRIBUTIONS
Conception and design: DN, DB
Analysis and interpretation: DN, AS, SS, PG, JJ, JC, DB
Data collection: DN
Writing the article: DN, AS, SS, PG, JJ, JC, DB
Critical revision of the article: DN, AS, SS, PG, JJ, JC, DB
Final approval of the article: DN, AS, SS, PG, JJ, JC, DB
Statistical analysis: DN
Obtained funding: Not applicable
Overall responsibility: DB
Additional material for this article may be found online at www.jvascsurg.org.
REFERENCES
- 1.Goldman L, Caldera DL, Nussbaum SR, Southwick FS, Krogstad D, Murray B, et al. Multifactorial index of cardiac risk in noncardiac surgical procedures. N Engl J Med. 1977;297:845–50. doi: 10.1056/NEJM197710202971601. [DOI] [PubMed] [Google Scholar]
- 2.Detsky AS, Abrams HB, Forbath N, Scott JG, Hilliard JR. Cardiac assessment for patients undergoing noncardiac surgery. A multifactorial clinical risk index. Arch Intern Med. 1986;146:2131–4. [PubMed] [Google Scholar]
- 3.Kheterpal S, O’Reilly M, Englesbe MJ, Rosenberg AL, Shanks AM, Zhang L, et al. Preoperative and intraoperative predictors of cardiac adverse events after general, vascular, and urological surgery. Anesthesiology. 2009;110:58–66. doi: 10.1097/ALN.0b013e318190b6dc. [DOI] [PubMed] [Google Scholar]
- 4.Cooperman M, Pflug B, Martin EW, Jr, Evans WE. Cardiovascular risk factors in patients with peripheral vascular disease. Surgery. 1978;84:505–9. [PubMed] [Google Scholar]
- 5.Yeager RA, Weigel RM, Murphy ES, McConnell DB, Sasaki TM, Vetto RM. Application of clinically valid cardiac risk factors to aortic aneurysm surgery. Arch Surg. 1986;121:278–81. doi: 10.1001/archsurg.1986.01400030032004. [DOI] [PubMed] [Google Scholar]
- 6.Eagle KA, Coley CM, Newell JB, Brewster DC, Darling RC, Strauss HW, et al. Combining clinical and thallium data optimizes preoperative assessment of cardiac risk before major vascular surgery. Ann Intern Med. 1989;110:859–66. doi: 10.7326/0003-4819-110-11-859. [DOI] [PubMed] [Google Scholar]
- 7.Lette J, Waters D, Lassonde J, Rene P, Picard M, Laurendeau F, et al. Multivariate clinical models and quantitative dipyridamole-thallium imaging to predict cardiac morbidity and death after vascular reconstruction. J Vasc Surg. 1991;14:160–9. doi: 10.1067/mva.1991.28565. [DOI] [PubMed] [Google Scholar]
- 8.L’Italien GJ, Paul SD, Hendel RC, Leppo JA, Cohen MC, Fleisher LA, et al. Development and validation of a Bayesian model for perioperative cardiac risk assessment in a cohort of 1,081 vascular surgical candidates. J Am Coll Cardiol. 1996;27:779–86. doi: 10.1016/0735-1097(95)00566-8. [DOI] [PubMed] [Google Scholar]
- 9.Bartels C, Bechtel JF, Hossmann V, Horsch S. Cardiac risk stratification for high-risk vascular surgery. Circulation. 1997;95:2473–5. doi: 10.1161/01.cir.95.11.2473. [DOI] [PubMed] [Google Scholar]
- 10.Karkos CD, Thomson GJ, Hughes R, Hollis S, Hill JC, Mukhopadhyay US. Prediction of cardiac risk before abdominal aortic reconstruction: comparison of a revised Goldman Cardiac Risk Index and radioisotope ejection fraction. J Vasc Surg. 2002;35:943–9. doi: 10.1067/mva.2002.121982. [DOI] [PubMed] [Google Scholar]
- 11.Lee TH, Marcantonio ER, Mangione CM, Thomas EJ, Polanczyk CA, Cook EF, et al. Derivation and prospective validation of a simple index for prediction of cardiac risk of major noncardiac surgery. Circulation. 1999;100:1043–9. doi: 10.1161/01.cir.100.10.1043. [DOI] [PubMed] [Google Scholar]
- 12.Bertges DJ, Goodney PP, Zhao Y, Schanzer A, Nolan BW, Likosky DS, et al. Vascular Study Group of New England. The Vascular Study Group of New England Cardiac Risk Index (VSG-CRI) predicts cardiac complications more accurately than the Revised Cardiac Risk Index in vascular surgery patients. J Vasc Surg. 2010;52:674–83. doi: 10.1016/j.jvs.2010.03.031. 683. e1-3. [DOI] [PubMed] [Google Scholar]
- 13.Gupta PK, Gupta H, Sundaram A, Kaushik M, Fang X, Miller WJ, et al. Development and validation of a risk calculator for prediction of cardiac risk after surgery. Circulation. 2011;124:381–7. doi: 10.1161/CIRCULATIONAHA.110.015701. [DOI] [PubMed] [Google Scholar]
- 14.Eagle KA, Rihal CS, Mickel MC, Holmes DR, Foster ED, Gersh BJ. Cardiac risk of noncardiac surgery: influence of coronary disease and type of surgery in 3368 operations. CASS Investigators and University of Michigan Heart Care Program. Coronary Artery Surgery Study. Circulation. 1997;96:1882–7. doi: 10.1161/01.cir.96.6.1882. [DOI] [PubMed] [Google Scholar]
- 15.Vascular Quality Initiative. Available at: http://www.vascularqualityinitiative.org/vqi-now-includes-300-centers/. Accessed January 10, 2016.
- 16.Online vascular surgery clinical calculators. Available at: http://www.qxmd.com/calculate-online/vascular-surgery. Accessed August 15, 2015.
- 17.Society for Vascular Surgery Vascular Quality Initiative 2012 validation process for 100% procedure entry. Available at: http://www.vascularqualityinitiative.org/wp-content/uploads/SVS-PSO-Data-Validation_0.pdf. Accessed January 10, 2016.
- 18.Cronenwett JL, Likosky DS, Russell MT, Eldrup-Jorgensen J, Stanley AC, Nolan BW. A regional registry for quality assurance and improvement: the Vascular Study Group of Northern New England (VSGNNE) J Vasc Surg. 2007;46:1093–101. doi: 10.1016/j.jvs.2007.08.012. discussion: 1101-2. [DOI] [PubMed] [Google Scholar]
- 19.Vascular Quality Initiative: procedures collected. Available at: http://www.vascularqualityinitiative.org/overview-benefits/procedures-collected/. Accessed January 10, 2016. [Google Scholar]
- 20.Biccard BM, Rodseth RN. Utility of clinical risk predictors for preoperative cardiovascular risk prediction. Br J Anaesth. 2011;107:133–43. doi: 10.1093/bja/aer194. [DOI] [PubMed] [Google Scholar]
- 21.Simons JP, Baril DT, Goodney PP, Bertges DJ, Robinson WP, Cronenwett JL, et al. Vascular Study Group of New England. The effect of postoperative myocardial ischemia on long-term survival after vascular surgery. J Vasc Surg. 2013;58:1600–8. doi: 10.1016/j.jvs.2013.06.062. [DOI] [PMC free article] [PubMed] [Google Scholar]
- 22.van Waes JA, Nathoe HM, de Graaff JC, Kemperman H, de Borst GJ, Peelen LM, et al. Cardiac Health After Surgery (CHASE) Investigators. Myocardial injury after noncardiac surgery and its association with short-term mortality. Circulation. 2013;127:2264–71. doi: 10.1161/CIRCULATIONAHA.113.002128. [DOI] [PubMed] [Google Scholar]
- 23.Ford MK, Beattie WS, Wijerysundera DN. Systematic review: prediction of perioperative cardiac complications and mortality by the revised cardiac risk index. Ann Intern Med. 2010;152:26–35. doi: 10.7326/0003-4819-152-1-201001050-00007. [DOI] [PubMed] [Google Scholar]
- 24.Harrell FE., Jr . Regression modeling strategies: with applications to linear models, logistic regression, and survival analysis. Springer; New York: 2010. [Google Scholar]
- 25.Lawless JF, Singhal K. Efficient screening of non-normal regression models. Biometrics. 1978;34:318–27. [Google Scholar]
- 26.Efron B. Estimating the error rate of a prediction rule: improvement on cross-validation. J Am Stat Assoc. 1983;78:316–31. [Google Scholar]
- 27.Huber PJ, Le Cam LM, Neyman J. Proceedings of the Fifth Berkeley Symposium on Mathematical Statistics and Probability. University of California Press; Berkeley: 1967. The behavior of maximum likelihood estimates under nonstandard conditions; pp. 221–33. [Google Scholar]
- 28.White H. Maximum likelihood estimation of misspecified models. Econometrica. 1982;50:1–25. [Google Scholar]
- 29.Press MJ, Chassin MR, Wang J, Tuhrim S, Halm EA. Predicting medical and surgical complications of carotid endarterectomy: comparing the risk indexes. Arch Intern Med. 2006;166:914–20. doi: 10.1001/archinte.166.8.914. [DOI] [PubMed] [Google Scholar]
- 30.Schouten O, Kok NF, Hoedt MT, van Laanen JH, Poldermans D. The influence of aneurysm size on perioperative cardiac outcome in elective open infrarenal aortic aneurysm repair. J Vasc Surg. 2006;44:435–41. doi: 10.1016/j.jvs.2006.05.020. [DOI] [PubMed] [Google Scholar]
- 31.Welten GM, Schouten O, van Domburg RT, Feringa HH, Hoeks SE, Dunkelgrun M, et al. The influence of aging on the prognostic value of the revised cardiac risk index for postoperative cardiac complications in vascular surgery patients. Eur J Vasc Endovasc Surg. 2007;34:632–8. doi: 10.1016/j.ejvs.2007.05.002. [DOI] [PubMed] [Google Scholar]
- 32.Ng TT, Mirocha J, Magner D, Gewertz BL. Variations in the utilization of endovascular aneurysm repair reflect population risk factors and disease prevalence. J Vasc Surg. 2010;51:801–9. doi: 10.1016/j.jvs.2009.10.115. 809.e1. [DOI] [PubMed] [Google Scholar]
- 33.Dua A, Kuy S, Lee CJ, Upchurch GR, Jr, Desai SS. Epidemiology of aortic aneurysm repair in the United States from 2000 to 2010. J Vasc Surg. 2014;59:1512–7. doi: 10.1016/j.jvs.2014.01.007. [DOI] [PubMed] [Google Scholar]
- 34.Shahian DM, O’Brien SM, Filardo G, Ferraris VA, Haan CK, Rich JB, et al. Society of Thoracic Surgeons Quality Measurement Task Force. The Society of Thoracic Surgeons 2008 cardiac surgery risk models: part 1dcoronary artery bypass grafting surgery. Ann Thorac Surg. 2009;88(Suppl):S2–22. doi: 10.1016/j.athoracsur.2009.05.053. [DOI] [PubMed] [Google Scholar]
- 35.U.S. Food and Drug Administration Mobile medical applications. Available at: http://www.fda.gov/MedicalDevices/ProductsandMedical Procedures/ConnectedHealth/MobileMedicalApplications/ucm255978.htm. Accessed August 15, 2015. [Google Scholar]
- 36.Thygesen K, Alpert JS, Jaffe AS, Simoons ML, Chaitman BR, White HD. Joint ESC/ACCF/AHA/WHF Task Force for Universal Definition of Myocardial Infarction. Third universal definition of myocardial infarction. J Am Coll Cardiol. 2012;60:1581–98. doi: 10.1016/j.jacc.2012.08.001. [DOI] [PubMed] [Google Scholar]
- 37.Alpert JS, Thygesen K, Jaffe A, White HD. The universal definition of myocardial infarction: a consensus document: ischaemic heart disease. Heart. 2008;94:1335–41. doi: 10.1136/hrt.2008.151233. [DOI] [PubMed] [Google Scholar]
Associated Data
This section collects any data citations, data availability statements, or supplementary materials included in this article.