Abstract
We assess the performance of several machine learning-based scoring methods at protein-ligand pose prediction, virtual screening, and binding affinity prediction. The methods and the manner in which they were trained make them sufficiently diverse to evaluate the utility of various strategies for training set curation and binding pose generation, but they share a novel approach to classification in the context of protein-ligand scoring. Rather than explicitly using structural data such as affinity values or information extracted from crystal binding poses for training, we instead exploit the abundance of data available from high-throughput screening to approach the problem as one of discriminating binders from non-binders. We evaluate the performance of our various scoring methods in the 2015 D3R Grand Challenge and find that although the merits of some features of our approach remain inconclusive, our scoring methods performed comparably to a state-of-the-art scoring function that was fit to binding affinity data.
Keywords: protein-ligand scoring, machine learning, virtual screening, D3R
1 Introduction
A scoring function that accurately represents and predicts ligand-protein interactions is essential for molecular docking, energy minimization, and hit identification/lead optimization in structure-based drug discovery [1–10]. The development of an accurate and reliable scoring function remains an unsolved problem [10–15]. Ideally, given a protein-ligand structure, a scoring function would be able to correctly place the true, crystal pose of a ligand at a global minimum (pose prediction) and, if provided poses at this global minimum, correctly distinguish between active and inactive ligands (virtual screening performance) by producing scores equivalent to the binding free energy (binding affinity prediction).
Scoring function design philosophies generally span a continuum between force-field based scoring, empirical scoring, and knowledge-based scoring. Force-field based scoring [7, 16–23] attempts to compute the physical interaction of the protein and small molecule and includes terms such as van der Waals and electrostatic interactions. These terms are typically parameterized from first principles. Empirical scoring functions [24, 25, 25–30] include physically meaningful terms that may not directly map to physical forces, such as hydrophobic terms, and are parameterized to reproduce binding affinities or other data. Knowledge-based scoring [31–37] takes advantage of the growing amount of structural data to derive statistical potentials for ligand-protein interaction patterns.
Parametric machine learning methods, such as linear regression, are often used to parameterize empirical scoring functions. In contrast, non-parametric machine learning methods, such as neural networks [38, 39], provide greater flexibility and expressiveness as they learn both their model structure and parameters from data. Such methods have successfully been applied to scoring protein-ligand interactions [36, 40, 41, 41–49]. These scoring functions take as input a set of descriptors extracted from a protein-ligand complex. These descriptors are either terms common to empirical scoring [47], such as measures of electrostatic attraction, atom interaction counts [48], or more abstract interaction fingerprints [44]. A disadvantage of non-parametric methods is that their increased expressiveness increases the probability of overfitting the model to the data, in which case the scoring function will not generalize to protein targets or ligand chemotypes not in the training data. The risk of overfitting increases the importance of rigorous validation [50, 51], but the inherent increase in flexibility allows non-parametric methods to outperform more constrained methods when trained on the identical input set [52].
As our entry in the Drug Design Data Resource (D3R) blind challenge, we investigated a variety of machine learning techniques. We evaluated both structure-based classification models and ligand-based regression models. For our structure-based classification we explored using the DUD-E dataset [53] for training. In contrast to the CSAR dataset [9] we have previously used [24], DUD-E is much larger (more than 1 million ligands), but lacks crystal structures for its more than 22,000 active ligands. Our goal in entering the D3R evaluation was to prospectively assess the performance of using structure-based training with generated DUD-E poses with both parametric and non-parametric machine learning methods while also evaluating a purely ligand-based QSAR method.
2 Methods
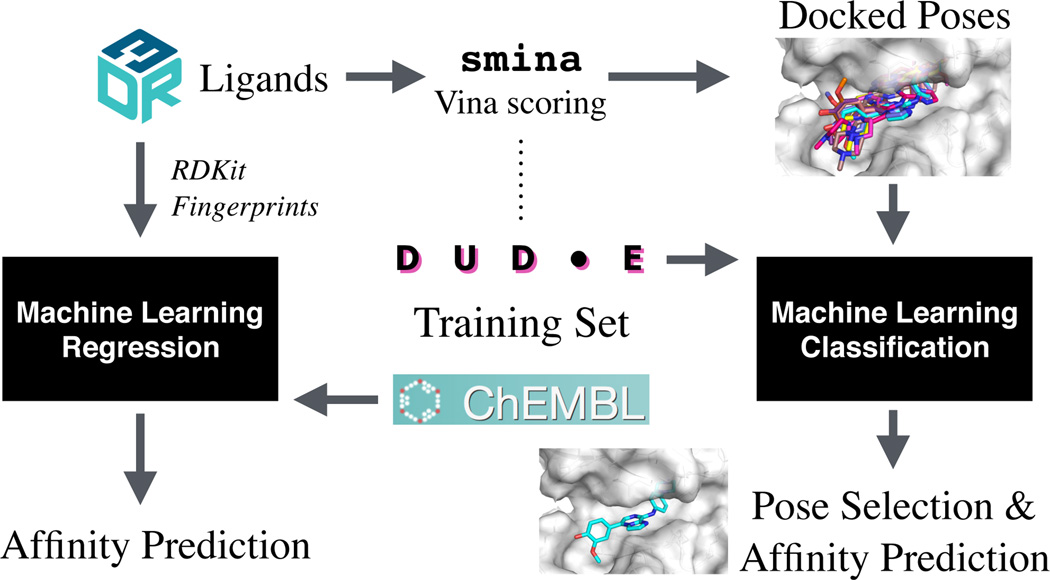
Our overall approach is shown in Figure 1. We considered both a ligand-based Quantitative Structure Activity Relationship (QSAR) approach and a structure-based docking and scoring approach. For the ligand-based approach we train a regression model from binding affinity data using RDKit [54] and a variety of chemical fingerprints. For the structure-based approach we make extensive use of smina [24], a fork of AutoDock Vina with enhanced capabilities for custom scoring function development, and the AutoDock Vina [30] scoring function. We evaluated a unique approach where we train classification models on binary binding data and used these classification models to rank and select docked poses.
Fig. 1.
The overall approach for our D3R submission. D3R ligands were ranked using a 2D QSAR approach trained using ChEMBL data (left side) or through a structure-based docking and scoring approach that used the DUD-E data set to train custom scoring functions for re-ranking poses docked using smina and the AutoDock Vina scoring function (right side).
The 2015 D3R Grand Challenge consisted of both affinity prediction and pose prediction exercises for two blinded collections of compounds for two targets: Heat Shock Protein 90 (HSP90) and mitogen-activated protein kinase kinase kinase kinase (MAP4K4). 180 ligands were provided for HSP90 with IC50 activities ranging from 5nM to inactive and six crystal structures were left blinded as part of the competition. The MAP4K4 dataset consisted of 30 compounds, all with co-crystal structures, but only 18 of which had measured IC50 data. Consequently, the HSP90 target is most useful for assessing binding affinity prediction and virtual screening performance while the MAP4K4 target is most suited for pose prediction evaluation.
2.1 Ligand-Based Regression
The goal of 2D QSAR modeling [55] is to generate a predictive model of a desired property, in our case binding activity, from a training set of molecules with known activity using descriptors generated from the 2D topology of the compounds. Using three different 2D fingerprint descriptors, we created three different models for HSP90 binding from the same training set. The code used to build our models is available under a permissive open source license at https://github.com/dkoes/qsar-tools and complete details of our approach are provided in the Supplementary Information.
2.1.1 Training Set
Compounds with published activity were extracted from the ChEMBL bioactivity database [56]. Specifically, we collected active compounds from the CHEMBL3880 target (HSP90 alpha) that had IC50 values with an equality relation expressed in nM units and a pChEMBL greater than zero (this is a negative logarithm used to standardize across different activity measurements). The resulting 355 active compounds spanned a pChEMBL range from 4 (100µM) to 9 (1nM). These compounds were then stripped of any salts and a variety of descriptors were calculated.
2.1.2 Descriptors
We calculated Boolean fingerprint descriptors, which encode a molecule as a binary string where each bit position corresponds to the presence or absence of a specific pattern of atoms in the molecule. We evaluated three different fingerprints: default RDKit (2048 bits), unfolded path (variable bits), and circular ECFP6 (2048 bits).
Default RDKit
The default RDKit fingerprint enumerates all paths (including branched paths) of a molecule with up to 7 bonds. These paths, including their atom and bond type information, are then doubly hashed to a bit position within a 2048 bit vector. The use of a constant fingerprint size means the fingerprint is general and can be broadly applied for similarity calculations, but introduces the likelihood of collisions where the same bit position corresponds to multiple distinct atom patterns.
Unfolded Path
For our unfolded path fingerprints, we enumerated all possible unbranched paths, including atom and bond type information, present in the molecules of the training set resulting in 6628 distinct atom patterns. Each path was then assigned a unique bit in a bit vector. In this case, every bit in the fingerprint unambiguously corresponds to a specific atom pattern. If new atom patterns are encountered when fingerprinting molecules not in the training set they are ignored.
Circular ECFP6
Extended connectivity fingerprints [57] enumerate atom patterns that represent the neighborhood of each atom up to a circular diameter, in our case 6, of bond lengths. These descriptors are then folded into a 2048 bit fingerprint with RDKit.
2.1.3 Elastic Net Linear Model
We create predictive linear models from the training set and descriptors using the ElasticNet module of the popular scikit-learn [58] Python package. An elastic net model includes both an L1 and L2 regularization factor:
where X are the input binary features, y are the labels (affinity values), w are the weights of the model, and α and ρ are parameters controlling the degree of regularization. Increased regularization drives weight values to zero, reducing the number of selected features. This reduces the amount of overfitting in the model at the cost of reduced expressiveness. In order to set these regularization parameters we apply an internal cross-validation to identify the best parameters for the training set. Using this approach we achieved internal cross-validation R2 correlations of 0.52, 0.50, and 0.60 using the default RDKit fingerprints, unfolded path, and circular ECFP6 fingerprints respectively.
2.2 Structure-Based Classification
For our structure-based workflow, which unlike the ligand-based regression also produces pose predictions, we use docked poses to train models to distinguish between binders and non-binders. These models are then used to re-rank and select docked poses of the D3R ligands.
2.2.1 Training Set
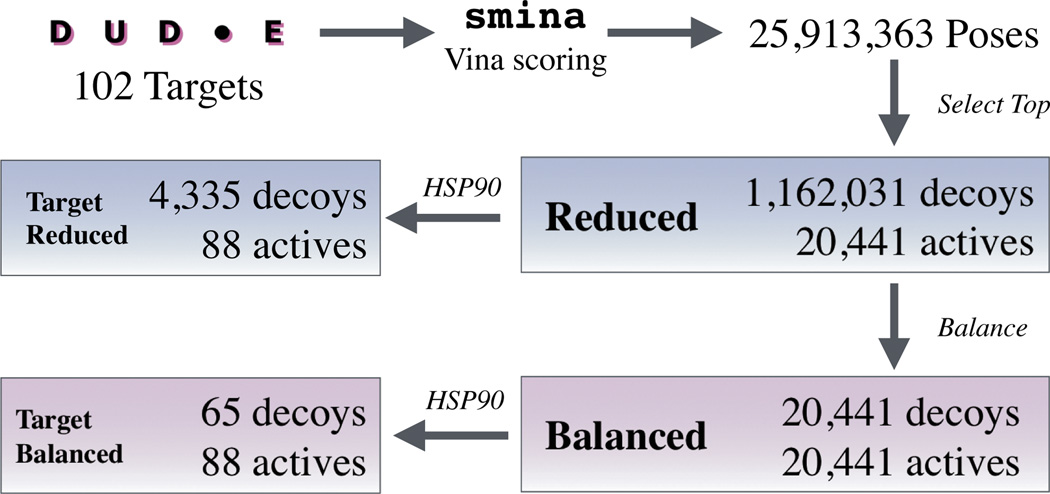
The workflow for training set construction is shown in Figure 2. Somewhat unconventionally, we chose to train structure-based models using a dataset, the Enhanced Directory of Useful Decoys (DUD-E) [53], that lacks protein-ligand structures. The advantage of DUD-E is its large size: it consists of 102 targets, more than 20,000 active molecules, and more than a million decoy molecules. The disadvantage is that compounds are classified as active/decoy (no binding affinity information) and structures are not available. To address this, we train our models as binary classifiers on docked poses. The docked poses are generated using smina [24] using the AutoDock Vina scoring function. Input ligands are converted to a single 3D conformer using RDKit which is then docked as a flexible ligand (hence the need to only generate a single conformer as rotatable bonds are sampled during docking). We dock against the reference receptor provided with DUD-E in a box centered around the reference ligand with 8Å of padding and select the top ranked pose as the structure to use for that ligand. This results in a highly imbalanced and noisy training set that is dominated by decoys. To enhance the signal exhibited by the active set, we also create a balanced set with equal numbers of decoy and active compounds. Since DUD-E includes an HSP90 target, we also extract a target specific set from these two larger training sets.
Fig. 2.
Our workflow for generating structural training sets from the DUD-E dataset.
2.2.2 Descriptors
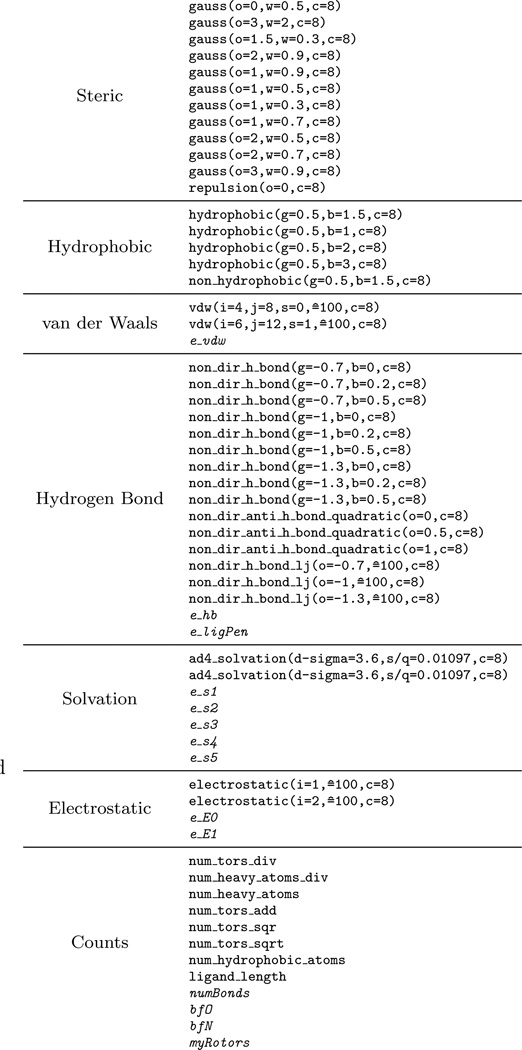
We distill every protein-ligand pose in our training set into a numerical vector of interaction features computed using smina and custom code to produce the descriptors shown in Figure 3. The custom code is primarily used to calculate descriptors that include a solvent accessible surface area (SASA) term, since smina only computes pairwise interaction terms. An assortment of parameterized smina terms are used and include steric, hydrophobic, van der Waals, hydrogen bonding, solvation, electrostatic (partial charges computed using Open Babel [59]), and non-interaction count/summation terms. Finally, we also include the AutoDock Vina score for a total of 61 features.
Fig. 3.
Structure-based descriptors used to train machine learning models. Italicized features are computed outside of smina and include solvent accessible surface area (SASA) atom type specific solvation terms (es_1 –es_6) and buried-ness terms (bfO, bfN).
For purposes of internal validation, we first evaluated our models using clustered cross-validation [50] where we partitioned the DUD-E training set at a target granularity into multiple folds. This provides a greater measure of generalizability since trained models are tested on entirely new targets. For training, as we are performing classification, we evaluated the ability of a model to properly rank compounds using the area under the curve (AUC) of the receiver operating characteristic (ROC) curve. A perfect ranking of ligands produces an AUC of 1.0 and a random ranking results in an AUC of 0.5. Models used for our D3R predictions were trained on the entire training set.
2.2.3 Linear Regression Model
Using scikit-learn [58] with default parameters we evaluated both linear regression and logistic regression, which is more commonly used in classification tasks, and found they produced nearly identical results in our cross-validation analysis. They both achieved an average AUC of 0.77 in 10-fold cross-validation when trained on the balanced training set. Since linear models are faster to evaluate and train, have more interpretable coefficients, and produce a wider range of prediction values (unlike logistic regression which is capped between zero and one), we selected a linear regression model for our D3R submission.
2.2.4 Neural Network Model
As an additional model, we trained a neural net with a single hidden layer of 20 nodes and two output classes (active or decoy) using the Caffe deep learning framework [60]. The model used sigmoid activation in the hidden layer and a softmax function to normalize the output. It was trained by stochastic gradient descent with an inverse learning rate decay function (ηi = 0.01, γ = 0.0004, power = 2) and momentum (α = 0.9) to minimize the multinomial logistic loss. Training occured for 10,000 iterations with a batch size of 20,000 examples. When trained on the unbalanced dataset, class weights were applied when computing the loss to balance the influence of the negative examples with the underrepresented positive examples. The 10-fold cross-validated AUC for the model was 0.74 using the balanced dataset and 0.73 on the unbalanced dataset.
2.3 Test Set
The provided SMILES of the D3R ligands were converted into a single conformer with RDKit and then docked with smina [24]. The binding site was defined using the cognate ligand of the receptor. Unlike with the training set, we increased the amount of sampling performed during docking (--exhaustiveness 50) to increase the chance of identifying high-quality poses. For the HSP90 target we limited ourselves to the four receptors referenced by the D3R organizers: 2JJC, 2XDX, 4YKR, 4YKY. Since the presence of waters was explicitly called out by the organizers, we docked to variations of these structures with zero, one, or two waters within the binding site. For each receptor structure, we generated up to 9 distinct poses for a total of 21,893 poses.
For MAP4K4, we also limited ourselves to the two structures referenced by the organizers: 4OBO and 4U44. In this case, since the organizers explicitly called out the flexibility of the structure we ran a 100ns molecular dynamics simulation using Amber14 and and the amberff14sb force field with TIP3P water under neutral conditions. In order to prepare the structures for simulation, we modeled missing loops as needed with the FREAD loop modeling server [61] and PyMOL. A greedy top-down clustering algorithm was then used to select ten diverse, as measured by backbone RMSD, frames from the 100ns simulation. The distributions of sampled backbone RMSDs are shown in Figure S1. Compounds were docked to these ten structures and the original crystal and up to 9 distinct poses were generated for each receptor for a total of 5,329 poses.
Our linear regression and neural network models were applied to all generated poses and the best scoring poses for each ligand were submitted as our predicted poses and the score of the best scoring pose was used for our submitted affinity predictions.
3 Results
The MAP4K4 and HSP90 datasets each served as a specialized evaluation task based on the nature of the data available: MAP4K4 had 30 blinded crystal structures that served to test pose prediction performance, while HSP90 had blinded affinity data for 180 ligands that could be used to evaluate virtual screening methodologies. Both sets had a relative paucity of data available for the other task - affinity data for 18 ligands in the case of MAP4K4 and crystal poses for 6 ligands in the case of HSP90 - and we thus focus much of the analysis of our performance on each task on the dataset suited to that task.
There are several axes of analysis, each elucidating the utility of a particular method we used to train and select classification models as well as generate instances to test them. Broadly, there are differences in the type of classification model (linear regression, linear regression including an L1 regularization term, and a neural net), the dataset used to train the classifier (the balanced and reduced datasets, and the targeted datasets in the case of HSP90), and the methods used to generate an ensemble of receptor structures used to created poses for the test sets. Although we did not submit the predictions from our linear classifier with an L1 lasso to the challenge, we include the data from its predictions here for the purposes of evaluation.
3.1 Pose Prediction
Given the 30 MAP4K4 crystal poses released at the close of Stage 1 of the challenge, we computed RMSDs of our predicted poses to the provided 4OBO aligned crystal poses. This information was then used to assess the performance of our training and testing methodologies across all the axes described above. In general we wanted to know whether it was more likely to observe low RMSD poses using a particular methodology, either in the top ranked pose for a given ligand or considering a subset of the top-ranked poses.
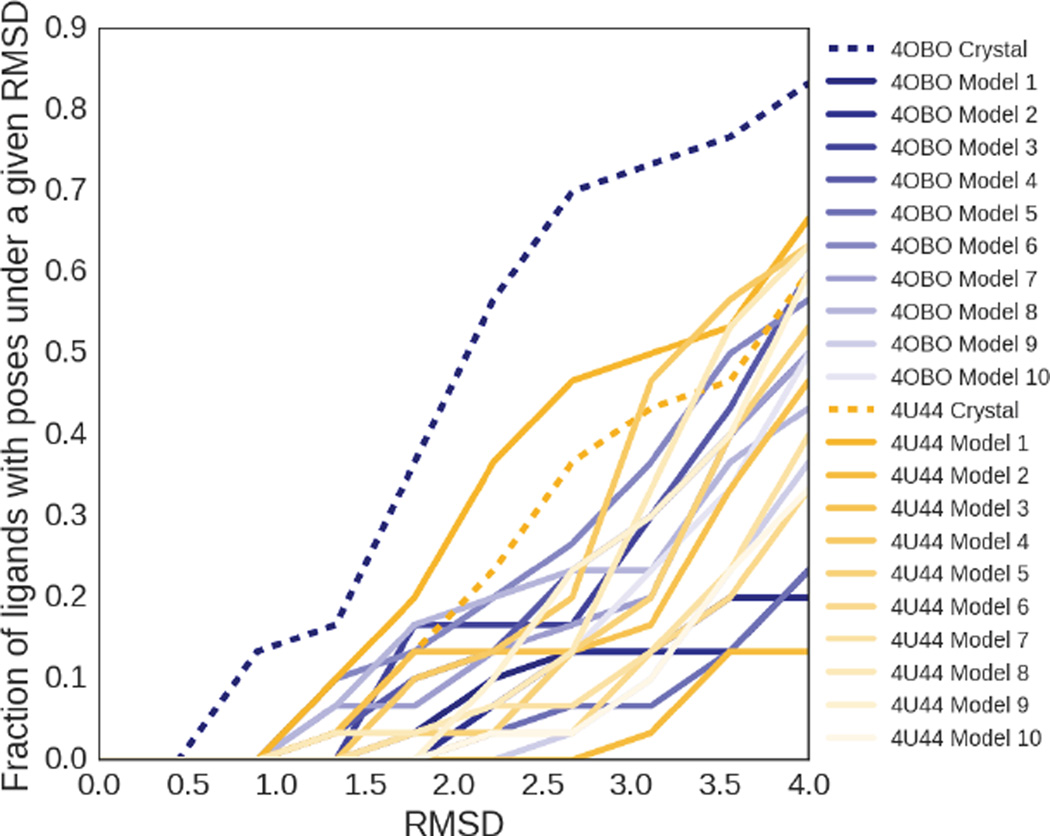
Since a scoring function’s ability to rank low-RMSD poses is limited by our ability to sample low-RMSD poses, we first focus on our pose sampling in the test set. Figure 4 shows that half of the ligands have at least one pose under 2.0 RMSD with the 4OBO crystal structure, which outperforms all other receptor structures in generating low RMSD poses. One of the 4U44 ensemble receptors outperforms the 4U44 crystal structure at generating low RMSD poses, successfully yielding a pose under 2.0 RMSD 37% of the time, compared to 23% of the time with the crystal structure. However, that structure is the first frame from the molecular dynamics simulation, suggesting that the pre-simulation minimization of the crystal structure may have been sufficient to produce better poses with 4U44. Of the 23 ligands for which we successfully sampled a pose under 2.0 RMSD, docking to one of the crystal structures was sufficient to produce such a pose for all but one. However, considering the lowest RMSD pose available in the test set for each of the ligands reveals that 14 ligands exhibited their lowest RMSD pose when docked to a simulation derived receptor rather than a crystal receptor structure, suggesting there was some value in performing the ensemble docking.
Fig. 4.
Fraction of ligands with poses under a given RMSD, colored by the receptor structure associated with the subset of poses used for the calculation. The starting PDB crystal structures are shown with dashed lines in the darkest colors, while the structures generated from molecular dynamics simulations are colored according to a gradient based on their frame number, representing their distance from the initial crystal structure used to start the simulation.
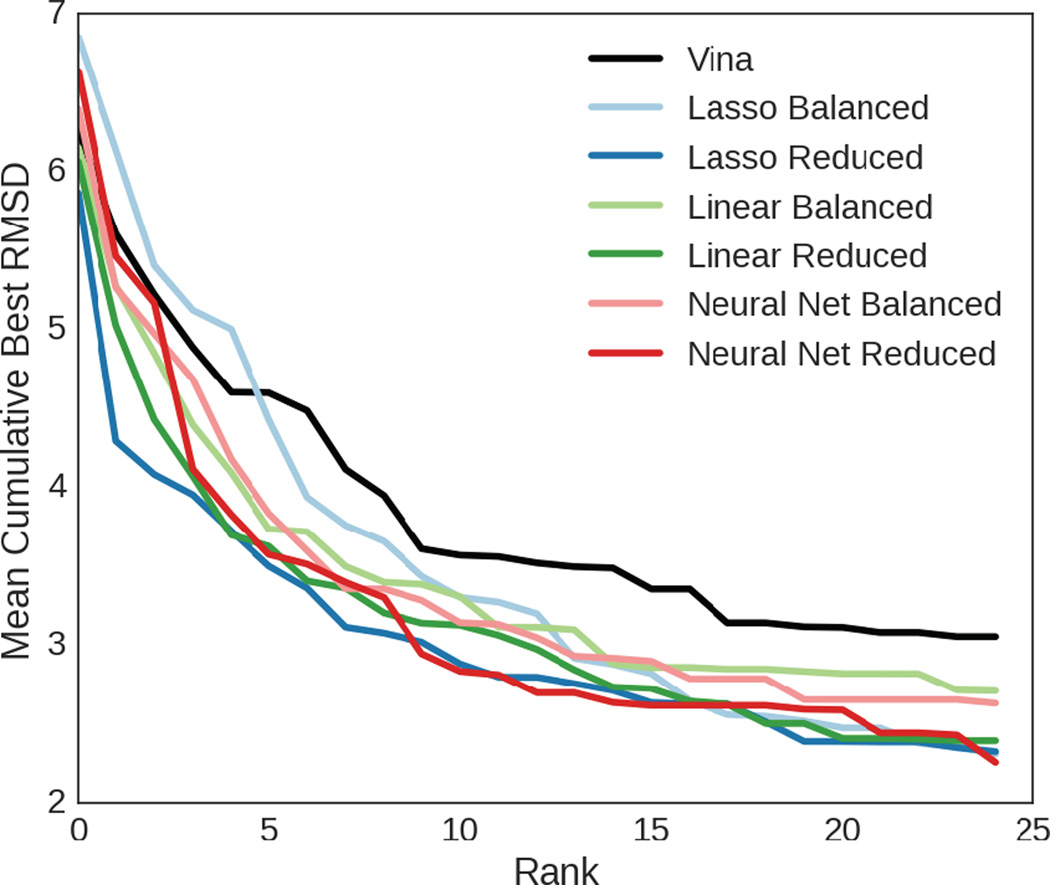
Figure 5 shows the mean across all ligands of the RMSD of the best pose seen so far at a given rank for each of the methods used to score and then rank poses. It indicates that for the majority of the values shown, the scoring functions trained on the reduced datasets outperformed those that were trained on the balanced datasets. The linear regression scoring function trained with lasso was the method that performed best overall, returning a pose within 4.0 RMSD on average by the fourth ranked pose; however, all methods except Vina (included as a baseline) and the lasso method trained on the balanced dataset returned a pose within 4.0 RMSD on average within the top five ranked poses. On average, no methods returned a pose within 2.0 RMSD in the top 25 ranked poses, despite the fact that 23 ligands had such a pose in the set of poses we generated via docking for the test set.
Fig. 5.
The average of the best RMSD observed for each ligand up to a given rank, compared across all the methods with Vina’s performance used as a baseline.
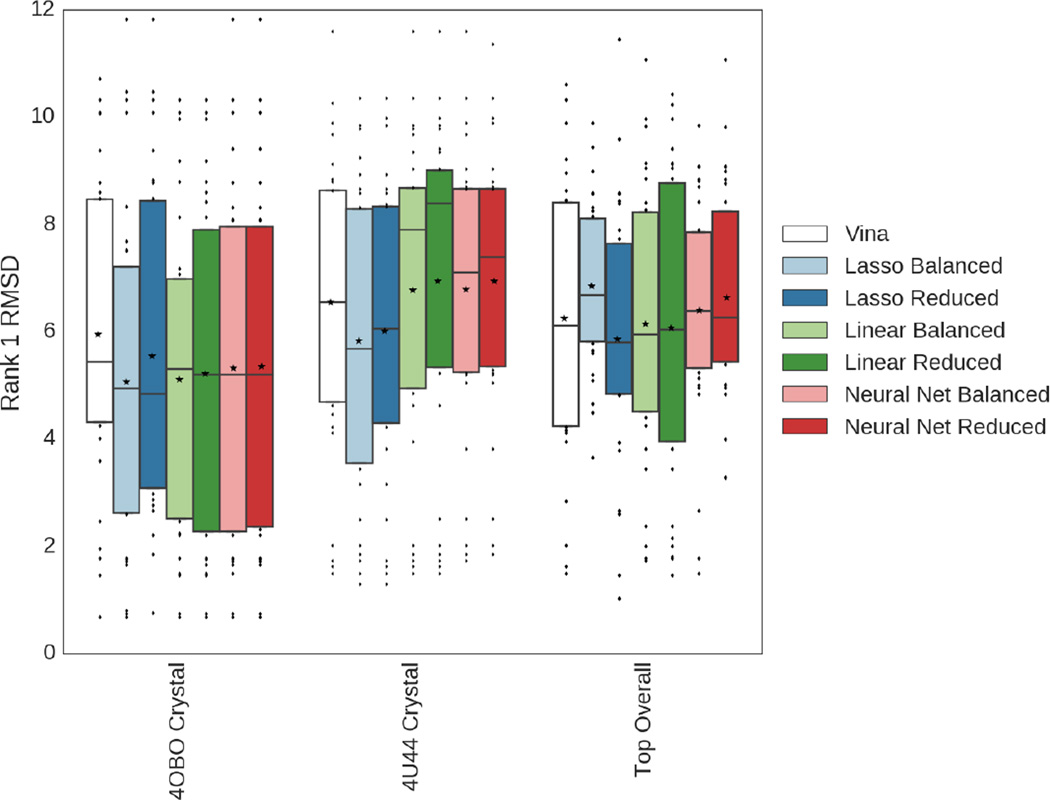
Figure 6 demonstrates that if only poses generated from the 4OBO crystal structure had been scored, a greater number of poses within 4.0 RMSD would have appeared as the top ranked pose chosen by all of the scoring methods except Vina. The assessment of the poses generated by 4U44 is more equivocal; while the lasso- and neural net-based methods demonstrate improved sampling of low RMSD poses if they are restricted to poses generated using 4U44, only for the lasso method trained using the balanced dataset does the lower quartile improve by nearly 2.0 RMSD, with a weaker effect observed for the other methods. The medians of the linear scoring function rankings improve by around 2.0 RMSD by using the full set of poses generated via the complete receptor ensemble rather than the 4U44 crystal structure.
Fig. 6.
Assessment of the mean rank 1 pose RMSD across all 30 ligands, comparing the different classifiers and the methods used to train them, as well as the receptor structures used to generate poses. Boxes show quartiles, lines bisecting the boxes indicate the location of the median, while stars indicate the location of the mean.
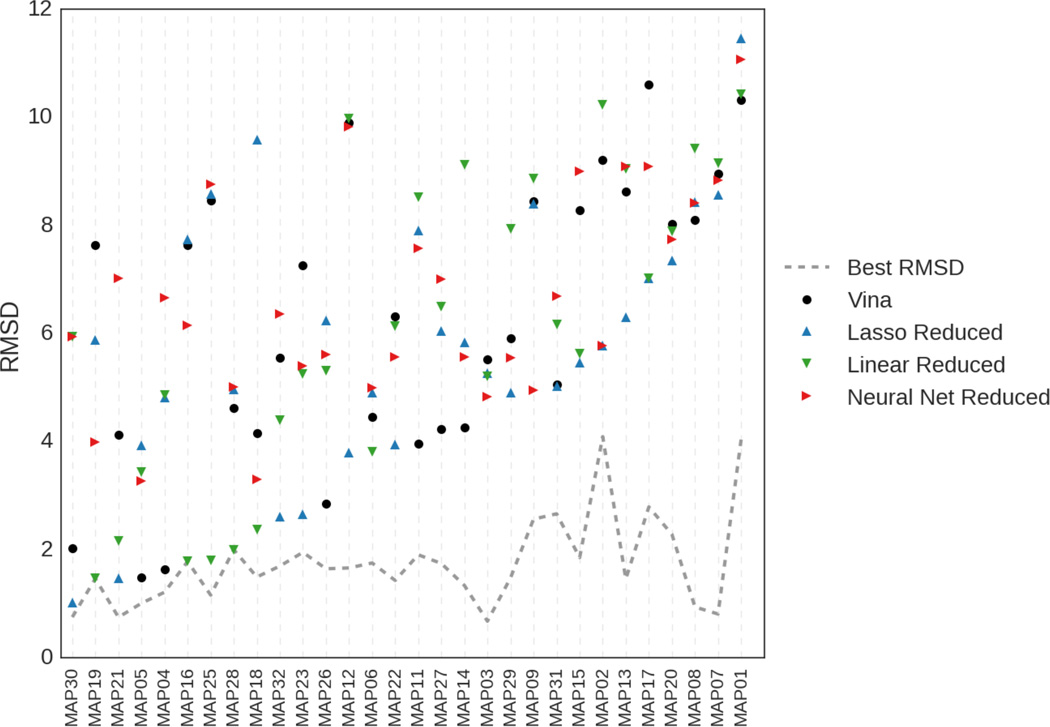
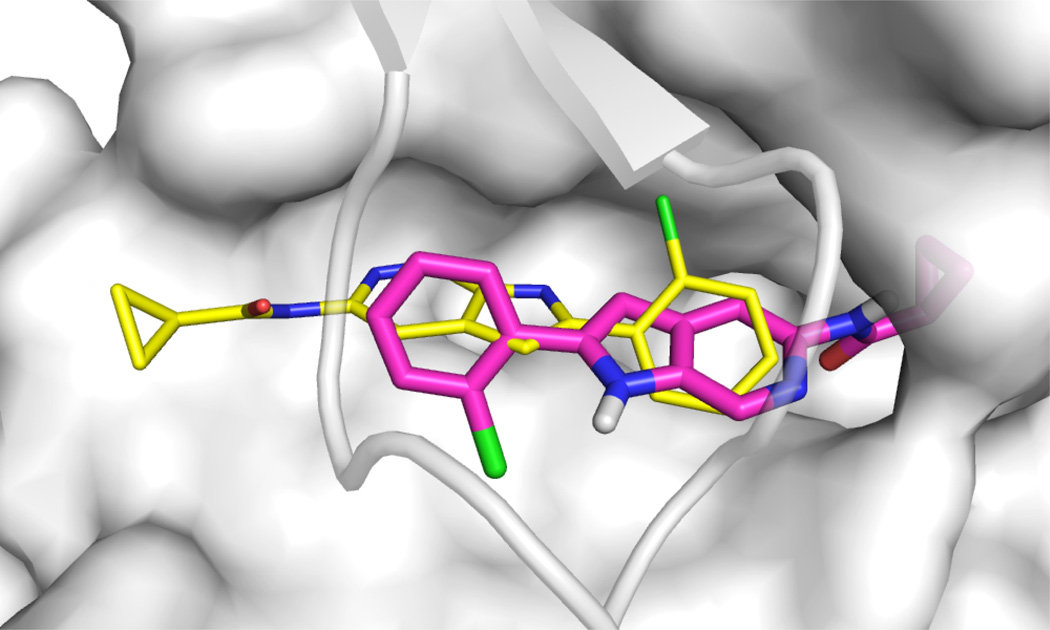
Figure 7 views the rank1 poses produced by each method based on the ligand with which they were associated. One of our methods (not including Vina) gave top rank to a pose within 4.0 RMSD for 13 of the ligands and within 2.0 RMSD for 6 of the ligands. Linear regression or linear regression with lasso, both trained using the reduced dataset, were the methods most successful at selecting low RMSD poses. Of the 17 ligands for which we failed to place a pose under 2.0 RMSD at rank 1, seven had no such pose in the dataset. The remaining ten had at least one pose under 2 RMSD in the dataset, but none of our methods correctly identified any such pose at rank 1. The ligand the methods had the most trouble with, despite the presence of a low (< 1Å) RMSD pose, was MAP07, which is shown in Figure 8. MAP07 has a cyclopropane group that is solvent exposed in the crystal, but all our methods (and Vina) prefer poses where this group is more buried.
Fig. 7.
RMSD of the rank 1 pose each method selected for each ligand in the MAP4K4 test set. The dashed gray line shows the lowest RMSD that could have been obtained by selecting poses from the test set.
Fig. 8.
An example of a challenging ligand for pose selection. The crystal pose for MAP07 is shown as thin yellow sticks while a pose top-ranked by a linear method for this receptor is shown in magenta sticks. The surface of the top of the binding pocket is removed for clarity.
A similar analysis was performed for the 6 ligands in the HSP90 dataset for which crystal structures were made available at the end of the challenge. The linear regression model trained on the balanced dataset was the best performing method on that task, with an average rank 1 pose RMSD of 1.9. However, Vina was more successful at predicting the lowest RMSD poses found in the top 5 ranking, reaching 0.98 RMSD by rank 5. The other methods performed significantly worse than Vina at every rank, and there was no clear consensus regarding whether training with the balanced or the reduced datasets proved advantageous for this task. The targeted training set produced scoring functions that performed the worst overall, generating poses that were on average 1–2.5 RMSD worse than those generated by the non-targeted version of the scoring function. In terms of sampling, two of the receptors produced poses within 2.0 RMSD for five of the six ligands, ten receptors produced poses within 4.0 RMSD for all of the ligands, and all receptors produced poses within 4.0 RMSD for four of the six ligands. Of the seven receptors that produced poses within 2.0 RMSD for at least four ligands, five used crystal waters in docking and two did not; of the two receptors that produced poses within 2.0 RMSD for at least five ligands, one used crystal waters and the other did not. This suggests that including crystal waters may enhance sampling of low RMSD poses and, at a minimum, is not detrimental. However, the small size of the HSP90 test set prevents any definitive conclusion.
3.2 Virtual Screening Performance
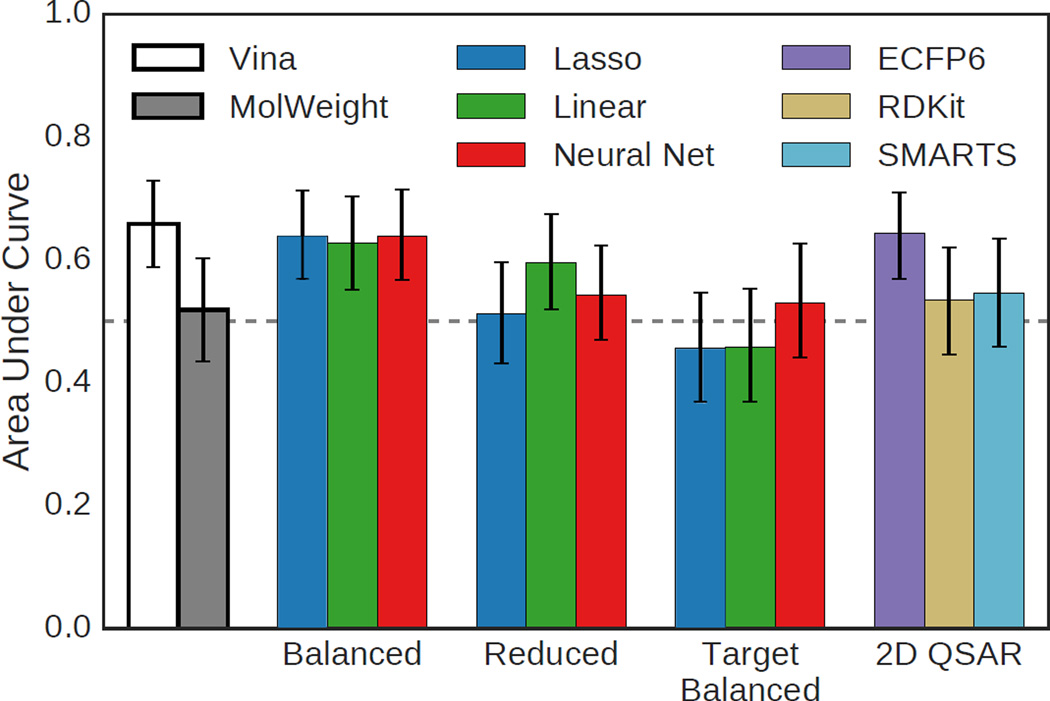
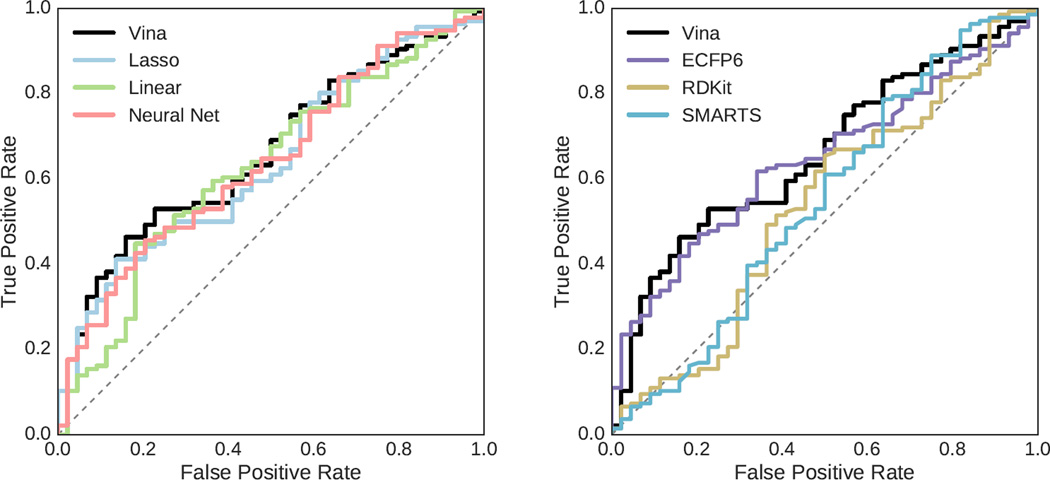
As the HSP90 set of 180 ligands included inactive compounds, it provides a means to evaluate virtual screening performance, that is, how well the various scoring methods discriminate between binders and non-binders. The cutoff for activity was set at 50µM resulting in 136 active and 44 inactive compounds. The score of the top ranked pose selected by each scoring method was used to rank each ligand. The area under the curve (AUC) of the receiver operating characteristic (ROC) curve for the various methods is shown in Figure 9 with 95% confidence intervals, and the ROC curves for selected methods are shown in Figure 10. The best AUC of 0.65 was achieved by Vina, but the structure-based methods trained using the balanced set and the ECFP6 ligand-based method all performed similarly with AUCs of 0.63 or better.
Fig. 9.
Area under the curve (AUC) of the ROC curves generated using various methods to rank HSP90 ligand poses. Error bars indicate the 95% confidence interval as determined by bootstrapping with replacement (1000 iterations). Compounds with a reported activity greater or equal to 50µM were considered inactive.
Fig. 10.
The ROC curves for HSP90 ligands generated using structure-based methods trained on a balanced training set (left) and curves of ligand-based methods (right). Compounds with a reported activity greater or equal to 50µM were considered inactive.
Methods trained using the reduced set, in which decoy examples are not down-sampled to balance the effect of active and inactive compounds on training, fared more poorly. Methods trained on the HSP90 target-specific balanced set were worse than random. Of the ligand-based methods, only ECFP6 fingerprints produced an AUC that was meaningfully above random.
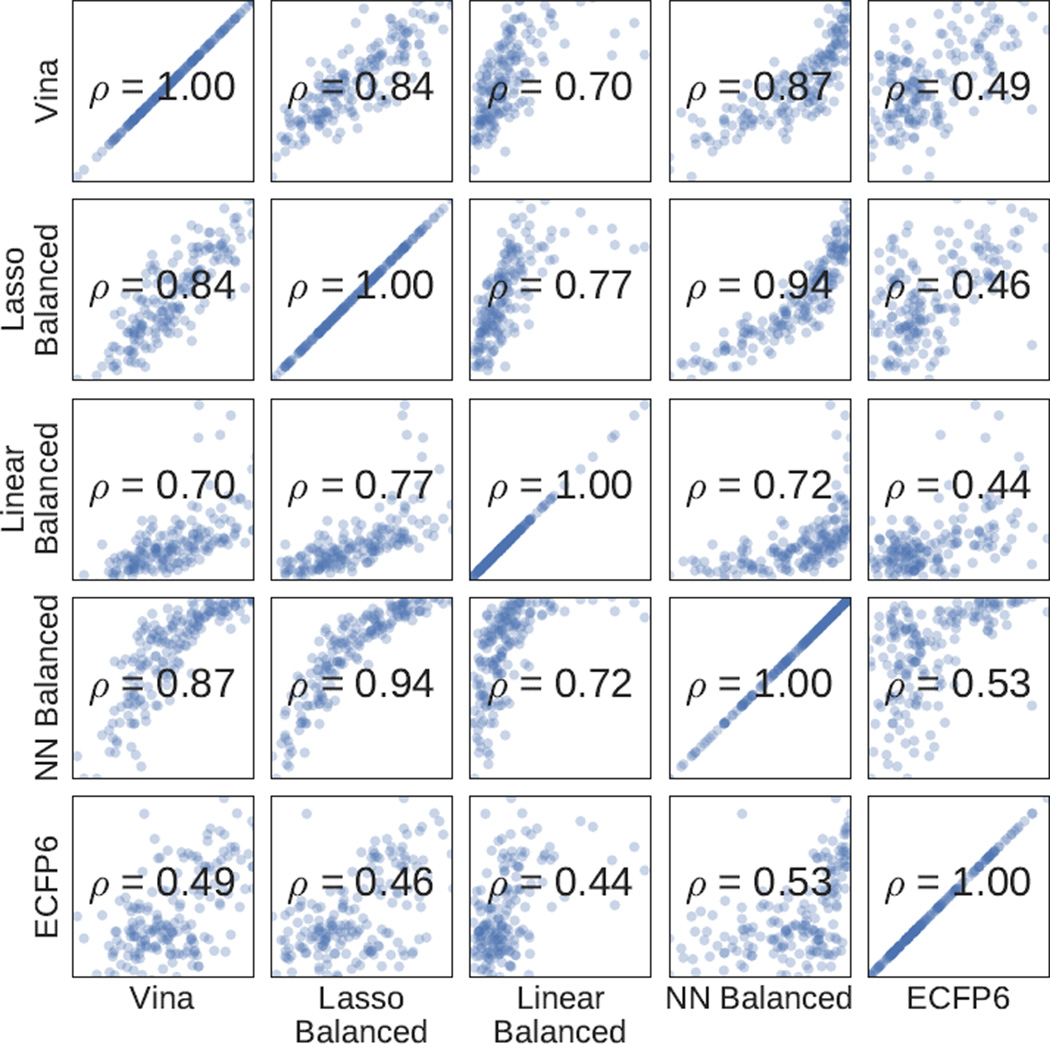
Although Vina, ECFP6, and the balanced methods perform similarly, they still score ligands differently, as shown in Figure 11 which plots the ligand scores of the different methods with respect to each other. The structure-based methods are more correlated with one another than with the ligand-based method.
Fig. 11.
Spearman correlations of HSP90 ligand scores for selected methods. The logit function (an inverse sigmoid) was applied to the neural network score for visualization purposes.
3.3 Affinity Prediction
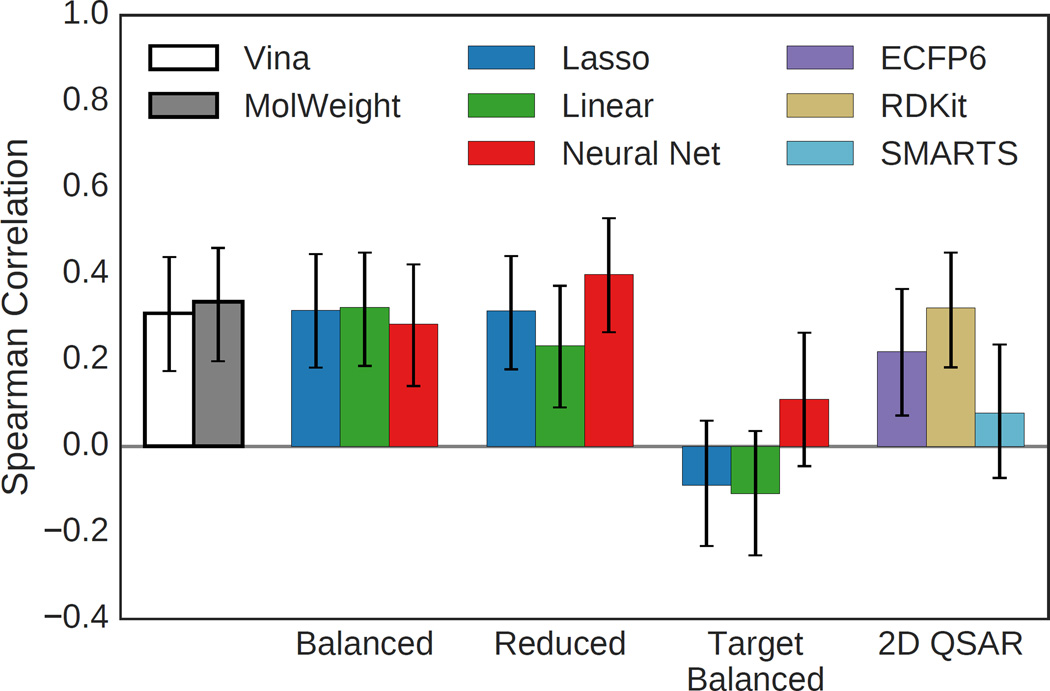
Both the HSP90 and MAP4K4 sets provide an opportunity to assess the ability of the methods to accurately predict the reported activity. Overall correlations between predicted and experimental activity for the HSP90 ligands are shown in Figure 12. As with the virtual screening results, Vina and the structure-based methods trained on the balanced set perform similarly and the methods trained on the HSP90 target-specific training set perform poorly. Methods trained on the reduced set have similar performance to Vina, with the neural net model achieving the highest Spearman correlation coefficient of 0.40. However, this is not a particularly high correlation and is not substantially more than the dataset’s correlation with molecular weight (0.34). Both the ECFP6 and RDKit 2D QSAR regression models achieve statistically significant correlations, but do not outperform the structure-based methods.
Fig. 12.
Spearman correlation coefficients using various methods to rank HSP90 ligands. Only ligands with reported IC50s below 50µM were considered. Error bars indicate the 95% confidence interval as determined by bootstrapping with replacement (1000 iterations).
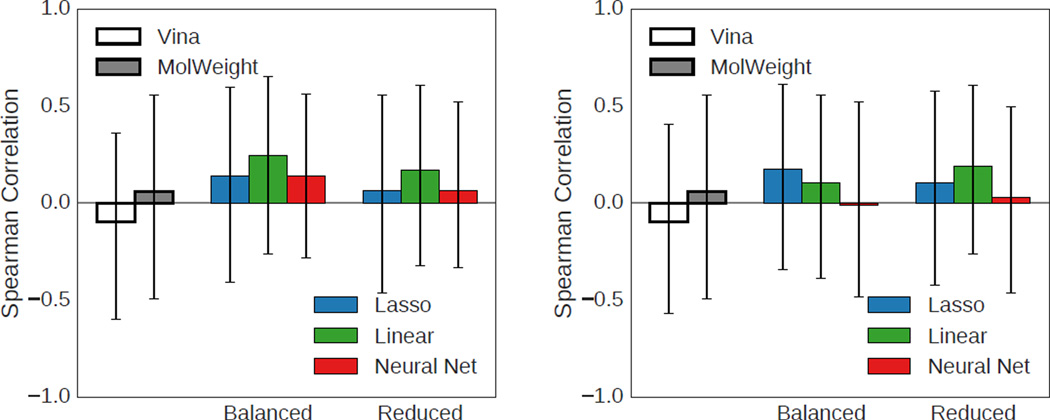
The MAP4K4 dataset has substantially fewer compounds with reported activities (17 ligands) which, as indicated by the 95% confidence intervals in Figure 13, makes it difficult to meaningfully compare methods. However, since the MAP4K4 dataset has the advantage of providing crystal structures for all 17 ligands, we also evaluated affinity prediction performance when scoring the pose with the closest RMSD to the crystal ligand instead of the pose top-ranked by the scoring function. Interestingly, as shown in Figure 13, scoring this superior pose did not result in improved correlations, statistically significant or otherwise.
Fig. 13.
Spearman correlation coefficients using various methods to rank MAP4K4 ligands using the ligand pose top ranked by the given method (left) or the ligand pose with the smallest RMSD to the crystal structure (right). Error bars indicate the 95% confidence interval as determined by boot-strapping with replacement (1000 iterations).
4 Discussion
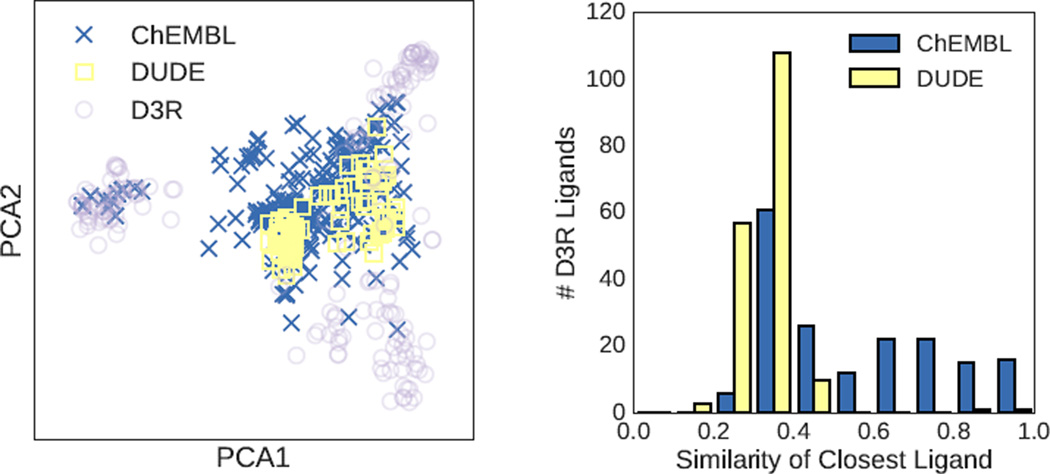
The 2015 D3R Grand Challenge provided an excellent opportunity to prospectively evaluate pose prediction and scoring methods. We evaluated both structure-based and ligand-based machine learning approaches. Somewhat surprisingly [62], the 3D structure-based methods outperformed the 2D methods for the one target, HSP90, where there was sufficient data to construct QSAR models. Although it is possible that the use of more expressive features [63] or models [64] would improve the results, a more likely issue lies in the coverage of the training set with respect to the D3R ligands. Figure 14 show the HSP90 datasets plotted with respect to the first to principal components of the D3R ligands as computed using OpenBabel FP2 fingerprints. The three congeneric series of the D3R set are clearly distinguished as three separate clusters. The ChEMBL dataset used with the ligand-based methods fully covers one cluster but only partially covers the remaining two. In contrast, the DUD-E HSP90 set used for the target-specific structure-based scoring functions has little overlap with the D3R ligands. This property, combined with the set’s small size (88 active ligands), was likely a major factor in the poor performance of these methods.
Fig. 14.
(Left) Structure-based (DUD-E) and ligand-based (ChEMBL) training sets projected on the first two principal components of the D3R ligand set. (Right) Histogram of the Tanimoto coefficient of D3R ligands with the most similar ligand in a given training set. Similarities are computed using OpenBabel FP2 fingerprints.
We used the D3R exercise to evaluate a variety of machine learning based scoring methods that were trained using a novel classification approach. Rather than fitting to affinity data or pose RMSDs, this approach seeks to leverage the large amount of high-throughput screening data available from a wide variety of sources. Framing the problem as a classification between binders and non-binders automatically normalizes for different assay outcomes. In order to utilize binding data in a structure-based approach, protein-ligand structures must be produced through docking. The end result is a large (the DUD-E set used here has more than one million ligands), but extremely noisy (due to docking inaccuracies) dataset. A key goal of this exercise was to evaluate the feasibility of such a training approach as well as compare different approaches to training set construction (i.e., balanced vs reduced).
Although the machine learning approaches did not outperform the AutoDock Vina scoring function, they did perform comparably at pose prediction, virtual screening, and affinity prediction. This may not seem surprising as the terms of the AutoDock Vina scoring function were included as training features. In fact, one of the features was the AutoDock Vina score itself, but omission of the Vina score from the training data produces essentially identical results (score predictions correlate with R>0.99). Nonetheless, we find it encouraging that two distinct modeling methods, linear regression and neural networks, can exploit a large, noisy dataset such as docked DUD-E poses, to achieve comparable results to a state-of-the art scoring function. The comparison between training set construction approaches was inconclusive with the reduced set producing somewhat better results for MAP4K4 pose prediction and the balanced set outperforming on HSP90 screening and affinity prediction. Larger, more accurate training data combined with more expressive structural input features or alternative machine learning approaches should further improve the usability and accuracy of scoring functions learned through classification of docked poses.
Supplementary Material
Acknowledgments
Funding: National Institute of General Medical Sciences [R01GM108340].
We thank the organizers of D3R for their time and effort in running this invaluable exercise. We also are grateful for Nick Rego for his code for calculating SASA protein-ligand interaction terms.
References
- 1.DeWitte RS, Shakhnovich EI. SMoG: de Novo design method based on simple, fast, and accurate free energy estimates .1. Methodology and supporting evidence. J. Am. Chem. Soc. 1996;118(47):11733–11744. [Google Scholar]
- 2.McInnes C. Virtual screening strategies in drug discovery. Curr Opin Chem Biol. 2007;11(5):494–502. doi: 10.1016/j.cbpa.2007.08.033. [PubMed:17936059] [DOI] [PubMed] [Google Scholar]
- 3.Charifson PS, Corkery JJ, Murcko MA, Walters WP. Consensus scoring: A method for obtaining improved hit rates from docking databases of three-dimensional structures into proteins. J Med Chem. 1999;42(25):5100–5109. doi: 10.1021/jm990352k. [PubMed:10602695] [DOI] [PubMed] [Google Scholar]
- 4.Wang R, Lu Y, Wang S. Comparative evaluation of 11 scoring functions for molecular docking. J Med Chem. 2003;46(12):2287–2303. doi: 10.1021/jm0203783. [PubMed:12773034] [DOI] [PubMed] [Google Scholar]
- 5.Kitchen DB, Decornez H, Furr JR, Bajorath J. Docking and scoring in virtual screening for drug discovery: methods and applications. Nat Rev Drug Discov. 2004;3(11):935–949. doi: 10.1038/nrd1549. [PubMed:15520816] [DOI] [PubMed] [Google Scholar]
- 6.Warren GL, Andrews CW, Capelli AM, Clarke B, LaLonde J, Lambert MH, Lindvall M, Nevins N, Semus SF, Senger S, Tedesco G, Wall ID, Woolven JM, Peishoff CE, Head MS. A critical assessment of docking programs and scoring functions. J Med Chem. 2006;49(20):5912–5931. doi: 10.1021/jm050362n. [PubMed:17004707] [DOI] [PubMed] [Google Scholar]
- 7.Cheng T, Li X, Li Y, Liu Z, Wang R. Comparative assessment of scoring functions on a diverse test set. J Chem Inf Model. 2009;49(4):1079–1093. doi: 10.1021/ci9000053. [PubMed:19358517] [DOI] [PubMed] [Google Scholar]
- 8.Cheng T, Li Q, Zhou Z, Wang Y, Bryant SH. Structure-based virtual screening for drug discovery: a problem-centric review. AAPS J. 2012;14(1):133–141. doi: 10.1208/s12248-012-9322-0. ISSN 1550-7416 (Electronic) 1550-7416 (Linking). URL http://www.ncbi.nlm.nih.gov/pubmed/22281989. [PubMed:22281989] [PubMed Central:PMC3282008] [doi:10.1208/s12248-012-9322-0] [DOI] [PMC free article] [PubMed] [Google Scholar]
- 9.Smith Richard D, Dunbar James B, Ung Peter Man-Un, Esposito Emilio X, Yang Chao-Yie, Wang Shaomeng, Carlson Heather A. CSAR Benchmark Exercise of 2010: Combined Evaluation Across All Submitted Scoring Functions. J Chem Inf Model. 2011 Aug;51(9):2115–2131. doi: 10.1021/ci200269q. ISSN 1549-9596. URL http://dx.doi.org/10.1021/ci200269q. [PubMed:21809884] [PubMed Central:PMC3186041] [DOI] [PMC free article] [PubMed] [Google Scholar]
- 10.Huang Sheng-You, Zou Xiaoqin. Scoring and lessons learned with the CSAR benchmark using an improved iterative knowledge-based scoring function. J Chem Inf Model. 2011 Sep;51(9):2097–2106. doi: 10.1021/ci2000727. [PubMed:21830787] [PubMed Central:PMC3190652] [doi:10.1021/ci2000727] [DOI] [PMC free article] [PubMed] [Google Scholar]
- 11.DesJarlais RL, Sheridan RP, Seibel GL, Dixon JS, Kuntz ID, Venkataraghavan R. Using shape complementarity as an initial screen in designing ligands for a receptor binding site of known three-dimensional structure. J Med Chem. 1988;31(4):722–729. doi: 10.1021/jm00399a006. [PubMed:3127588] [DOI] [PubMed] [Google Scholar]
- 12.Schneider G. Virtual screening: an endless staircase? Nature Reviews Drug Discovery. 2010;9(4):273–276. doi: 10.1038/nrd3139. ISSN 1474-1776. [PubMed:20357802] [DOI] [PubMed] [Google Scholar]
- 13.Hsieh Jui-Hua, Yin Shuangye, Liu Shubin, Sedykh Alexander, Dokholyan Nikolay V, Tropsha Alexander. Combined application of cheminformatics- and physical force field-based scoring functions improves binding affinity prediction for CSAR data sets. J Chem Inf Model. 2011 Sep;51(9):2027–2035. doi: 10.1021/ci200146e. [PubMed:21780807] [PubMed Central:PMC3183266] [doi:10.1021/ci200146e] [DOI] [PMC free article] [PubMed] [Google Scholar]
- 14.Rarey Matthias, Kramer Bernd, Lengauer Thomas, Klebe Gerhard. A Fast Flexible Docking Method using an Incremental Construction Algorithm. J. Mol. Biol. 1996 Aug;261(3):470–489. doi: 10.1006/jmbi.1996.0477. ISSN 0022-2836. URL http://www.sciencedirect.com/science/article/B6WK7-45MG2MC-5D/2/6bd203c800c04024407f7f216171b96a. [PubMed:8780787] [DOI] [PubMed] [Google Scholar]
- 15.Wang R, Liu L, Lai L, Tang Y. SCORE: A New Empirical Method for Estimating the Binding Affinity of a Protein-Ligand Complex. J. Mol. Model. 1998;4:379–394. [Google Scholar]
- 16.Harder Edward, Damm Wolfgang, Maple Jon, Wu Chuanjie, Reboul Mark, Xiang Jin Yu, Wang Lingle, Lupyan Dmitry, Dahlgren Markus K, Knight Jennifer L, Kaus Joseph W, Cerutti David S, Krilov Goran, Jorgensen William L, Abel Robert, Friesner Richard A. OPLS3: A force field providing broad coverage of drug-like small molecules and proteins. J. Chem. Theory Comput. 2016 Jan;12(1):281–296. doi: 10.1021/acs.jctc.5b00864. URL http://dx.doi.org/10.1021/acs.jctc.5b00864. [DOI] [PubMed] [Google Scholar]
- 17.Yin Shuangye, Biedermannova Lada, Vondrasek Jiri, Dokholyan Nikolay V. MedusaScore: An accurate force field-based scoring function for virtual drug screening. Journal of Chemical Information and Modeling. 2008 Aug;48(8):1656–1662. doi: 10.1021/ci8001167. URL http://dx.doi.org/10.1021/ci8001167. [DOI] [PMC free article] [PubMed] [Google Scholar]
- 18.Case DA, Cheatham TE, Darden T, Gohlke H, Luo R, Merz KM, Onufriev A, Simmerling C, Wang B, Woods RJ. The Amber biomolecular simulation programs. J. Comput. Chem. 2005;26(16):1668–1688. doi: 10.1002/jcc.20290. ISSN 1096-987X. [PubMed:16200636] [PubMed Central:PMC1989667] [DOI] [PMC free article] [PubMed] [Google Scholar]
- 19.Ewing TJ, Makino S, Skillman AG, Kuntz ID. DOCK 4.0: search strategies for automated molecular docking of flexible molecule databases. J Comput Aided Mol Des. 2001;15(5):411–428. doi: 10.1023/a:1011115820450. [PubMed:11394736] [DOI] [PubMed] [Google Scholar]
- 20.Brooks BR, Bruccoleri RE, Olafson BD. CHARMM: A program for macromolecular energy, minimization, and dynamics calculations. J. Comput. Chem. 1983;4(2):187–217. ISSN 1096-987X. [Google Scholar]
- 21.Lindahl E, Hess B, Van Der Spoel D. GRO-MACS 3.0: a package for molecular simulation and trajectory analysis. J. Mol. Model. 2001;7(8):306–317. ISSN 1610-2940. [Google Scholar]
- 22.Jorgensen WL, Maxwell DS, Tirado-Rives J. Development and testing of the OPLS all-atom force field on conformational energetics and properties of organic liquids. J. Am. Chem. Soc. 1996;118(45):11225–11236. ISSN 0002-7863. [Google Scholar]
- 23.Jones G, Willett P, Glen RC, Leach AR, Taylor R. Development and validation of a genetic algorithm for flexible docking. J Mol Biol. 1997;267(3):727–748. doi: 10.1006/jmbi.1996.0897. [PubMed:9126849] [DOI] [PubMed] [Google Scholar]
- 24.Koes David Ryan, Baumgartner Matthew P, Camacho Carlos J. Lessons Learned in Empirical Scoring with smina from the CSAR 2011 Benchmarking Exercise. Journal of Chemical Information and Modeling. 2013 doi: 10.1021/ci300604z. URL http://pubs.acs.org/doi/abs/10.1021/ci300604z. [PubMed:23379370] [PubMed Central:PMC3726561] [doi:10.1021/ci300604z] [DOI] [PMC free article] [PubMed] [Google Scholar]
- 25.Eldridge MD, Murray CW, Auton TR, Paolini GV, Mee RP. Empirical scoring functions: I. The development of a fast empirical scoring function to estimate the binding affinity of ligands in receptor complexes. J Comput Aided Mol Des. 1997;11(5):425–445. doi: 10.1023/a:1007996124545. [PubMed:9385547] [DOI] [PubMed] [Google Scholar]
- 26.Böhm HJ. The development of a simple empirical scoring function to estimate the binding constant for a protein-ligand complex of known three-dimensional structure. J. Comput.-Aided Mol. Des. 1994;8(3):243–256. doi: 10.1007/BF00126743. ISSN 0920-654X. [PubMed:7964925] [DOI] [PubMed] [Google Scholar]
- 27.Wang R, Lai L, Wang S. Further development and validation of empirical scoring functions for structure-based binding affinity prediction. J. Comput.-Aided Mol. Des. 2002;16(1):11–26. doi: 10.1023/a:1016357811882. ISSN 0920-654X. [PubMed:12197663] [DOI] [PubMed] [Google Scholar]
- 28.Korb O, Stützle T, Exner TE. Empirical scoring functions for advanced protein-ligand docking with PLANTS. J. Chem. Inf. Model. 2009;49(1):84–96. doi: 10.1021/ci800298z. ISSN 1549-9596. [PubMed:19125657] [DOI] [PubMed] [Google Scholar]
- 29.Friesner RA, Banks JL, Murphy RB, Halgren TA, Klicic JJ, Mainz DT, Repasky MP, Knoll EH, Shelley M, Perry JK, Shaw DE, Francis P, Shenkin PS. Glide: a new approach for rapid, accurate docking and scoring. 1. Method and assessment of docking accuracy. J Med Chem. 2004;47(7):1739–1749. doi: 10.1021/jm0306430. [PubMed:15027865] [DOI] [PubMed] [Google Scholar]
- 30.Trott Oleg, Olson Arthur J. AutoDock Vina: Improving the speed and accuracy of docking with a new scoring function, efficient optimization, and multithreading. Journal of Computational Chemistry. 2009;9999(9999) doi: 10.1002/jcc.21334. NA, ISSN 1096-987X. URL http://dx.doi.org/10.1002/jcc.21334. [PubMed:19499576] [PubMed Central:PMC3041641] [DOI] [PMC free article] [PubMed] [Google Scholar]
- 31.Huang SY, Zou X. Mean-Force Scoring Functions for Protein-Ligand Binding. Annu. Rep. Comp. Chem. 2010;6:280–296. ISSN 1574-1400. [Google Scholar]
- 32.Muegge I, Martin YC. A general and fast scoring function for protein-ligand interactions: a simplified potential approach. J Med Chem. 1999;42(5):791–804. doi: 10.1021/jm980536j. [PubMed:10072678] [DOI] [PubMed] [Google Scholar]
- 33.Gohlke H, Hendlich M, Klebe G. Knowledge-based scoring function to predict protein-ligand interactions. J. Mol. Biol. 2000;295(2):337–356. doi: 10.1006/jmbi.1999.3371. [DOI] [PubMed] [Google Scholar]
- 34.Zhou Hongyi, Skolnick Jeffrey. GOAP: a generalized orientation-dependent, all-atom statistical potential for protein structure prediction. Biophys. J. 2011 Oct;101(8):2043–2052. doi: 10.1016/j.bpj.2011.09.012. [PubMed:22004759] [PubMed Central:PMC3192975] [doi:10.1016/j.bpj.2011.09.012] [DOI] [PMC free article] [PubMed] [Google Scholar]
- 35.Mooij WT, Verdonk ML. General and targeted statistical potentials for protein-ligand interactions. Proteins. 2005;61(2):272–287. doi: 10.1002/prot.20588. [PubMed:16106379] [DOI] [PubMed] [Google Scholar]
- 36.Ballester PJ, Mitchell JBO. A machine learning approach to predicting protein-ligand binding affinity with applications to molecular docking. Bioinformatics. 2010;26(9):1169. doi: 10.1093/bioinformatics/btq112. ISSN 1367-4803. [PubMed:20236947] [PubMed Central:PMC3524828] [DOI] [PMC free article] [PubMed] [Google Scholar]
- 37.Huang SY, Zou X. An iterative knowledge-based scoring function to predict protein-ligand interactions: II. Validation of the scoring function. J. Comput. Chem. 2006;27(15):1876–1882. doi: 10.1002/jcc.20505. ISSN 1096-987X. [PubMed:16983671] [DOI] [PubMed] [Google Scholar]
- 38.Rojas Raúl. Neural networks: a systematic introduction. Springer Science & Business Media; 2013. [Google Scholar]
- 39.LeCun Yann, Bengio Yoshua, Hinton Geoffrey. Deep learning. Nature. 2015;521(7553):436–444. doi: 10.1038/nature14539. [DOI] [PubMed] [Google Scholar]
- 40.Ashtawy Hossam M, Mahapatra Nihar R. Machine-learning scoring functions for identifying native poses of ligands docked to known and novel proteins. BMC Bioinformatics. 2015;16(6):1–17. doi: 10.1186/1471-2105-16-S6-S3. ISSN 1471-2105. URL http://dx.doi.org/10.1186/1471-2105-16-S6-S3. [PubMed:25916860] [PubMed Central:PMC4416170] [doi:10.1186/1471-2105-16-S6-S3] [DOI] [PMC free article] [PubMed] [Google Scholar]
- 41.Jorissen Robert N, Gilson Michael K. Virtual screening of molecular databases using a support vector machine. Journal of Chemical Information and Modeling. 2005;45(3):549–561. doi: 10.1021/ci049641u. URL http://dx.doi.org/10.1021/ci049641u. [PubMed:15921445] [doi:10.1021/ci049641u] [DOI] [PubMed] [Google Scholar]
- 42.Sato T, Honma T, Yokoyama S. Combining machine learning and pharmacophore-based interaction fingerprint for in silico screening. J. Chem. Inf. Model. 2009;50(1):170–185. doi: 10.1021/ci900382e. ISSN 1549-9596. [PubMed:20038188] [DOI] [PubMed] [Google Scholar]
- 43.Durrant Jacob D, Amaro Rommie E. Machine-learning techniques applied to antibacterial drug discovery. Chemical Biology & Drug Design. 2015;85(1):14–21. doi: 10.1111/cbdd.12423. ISSN 1747-0285. URL http://dx.doi.org/10.1111/cbdd.12423. [PubMed:25521642] [PubMed Central:PMC4273861] [doi:10.1111/cbdd.12423] [DOI] [PMC free article] [PubMed] [Google Scholar]
- 44.Chupakhin Vladimir, Marcou Gilles, Baskin Igor, Varnek Alexandre, Rognan Didier. Predicting ligand binding modes from neural networks trained on protein–ligand interaction fingerprints. Journal of chemical information and modeling. 2013;53(4):763–772. doi: 10.1021/ci300200r. [PubMed:23480697] [DOI] [PubMed] [Google Scholar]
- 45.Zilian David, Sotriffer Christoph A. Sfcscore rf: a random forest-based scoring function for improved affinity prediction of protein–ligand complexes. Journal of chemical information and modeling. 2013;53(8):1923–1933. doi: 10.1021/ci400120b. [PubMed:23705795] [DOI] [PubMed] [Google Scholar]
- 46.Schietgat Leander, Fannes Thomas, Ramon Jan. Discovery Science. Springer; 2015. Predicting protein function and protein-ligand interaction with the 3d neighborhood kernel; pp. 221–235. [Google Scholar]
- 47.Durrant Jacob D, McCammon J Andrew. Nnscore: A neural-network-based scoring function for the characterization of protein-ligand complexes. Journal of chemical information and modeling. 2010;50(10):1865–1871. doi: 10.1021/ci100244v. [PubMed:20845954] [PubMed Central:PMC2964041] [DOI] [PMC free article] [PubMed] [Google Scholar]
- 48.Durrant Jacob D, McCammon J Andrew. Nnscore 2.0: a neural-network receptor–ligand scoring function. Journal of chemical information and modeling. 2011;51(11):2897–2903. doi: 10.1021/ci2003889. [PubMed:22017367] [PubMed Central:PMC3225089] [DOI] [PMC free article] [PubMed] [Google Scholar]
- 49.Deng Wei, Breneman Curt, Embrechts Mark J. Predicting protein-ligand binding affinities using novel geometrical descriptors and machine-learning methods. Journal of Chemical Information and Computer Sciences. 2004;44(2):699–703. doi: 10.1021/ci034246+. URL http://dx.doi.org/10.1021/ci034246+. [PubMed:15032552] [doi:10.1021/ci034246+] [DOI] [PubMed] [Google Scholar]
- 50.Kramer Christian, Gedeck Peter. Leave-Cluster-Out Cross-Validation Is Appropriate for Scoring Functions Derived from Diverse Protein Data Sets. J. Chem. Inf. Model. 2010;50(11):1961–1969. doi: 10.1021/ci100264e. URL http://pubs.acs.org/doi/abs/10.1021/ci100264e. [doi:10.1021/ci100264e] [DOI] [PubMed] [Google Scholar]
- 51.Gabel Joffrey, Desaphy Jérémy, Rognan Didier. Beware of machine learning-based scoring functions? on the danger of developing black boxes. Journal of chemical information and modeling. 2014;54(10):2807–2815. doi: 10.1021/ci500406k. [PubMed:25207678] [DOI] [PubMed] [Google Scholar]
- 52.Li Hongjian, Leung Kwong-Sak, Wong Man-Hon, Ballester Pedro J. Computational Intelligence Methods for Bioinformatics and Biostatistics. Springer; 2014. The importance of the regression model in the structure-based prediction of protein-ligand binding; pp. 219–230. [Google Scholar]
- 53.Mysinger MM, Carchia M, Irwin JJ, Shoichet BK. Directory of useful decoys, enhanced (DUD-E): better ligands and decoys for better benchmarking. J Med Chem. 2012;55(14):6582–6594. doi: 10.1021/jm300687e. [PubMed:22716043] [PubMed Central:PMC3405771] [DOI] [PMC free article] [PubMed] [Google Scholar]
- 54.rdkit. RDKit: Open-source cheminformatics. [accessed September 4, 2015]; http://www.rdkit.org. [Google Scholar]
- 55.Cherkasov Artem, Muratov Eugene N, Fourches Denis, Varnek Alexandre, Baskin Igor I, Cronin Mark, Dearden John, Gramatica Paola, Martin Yvonne C, Todeschini Roberto, et al. Qsar modeling: where have you been? where are you going to? Journal of medicinal chemistry. 2014;57(12):4977–5010. doi: 10.1021/jm4004285. [PubMed:24351051] [PubMed Central:PMC4074254] [DOI] [PMC free article] [PubMed] [Google Scholar]
- 56.Bento A. Patrícia, Gaulton Anna, Hersey Anne, Bellis Louisa J, Chambers Jon, Davies Mark, Krüger Felix A, Light Yvonne, Mak Lora, McGlinchey Shaun, Nowotka Michal, Papadatos George, Santos Rita, Overington John P. The ChEMBL bioactivity database: an update. Nucleic Acids Research. 2013 Nov;42(D1):D1083–D1090. doi: 10.1093/nar/gkt1031. URL http://dx.doi.org/10.1093/nar/gkt1031. [DOI] [PMC free article] [PubMed] [Google Scholar]
- 57.Rogers David, Hahn Mathew. Extended-connectivity fingerprints. Journal of Chemical Information and Modeling. 2010 May;50(5):742–754. doi: 10.1021/ci100050t. URL http://dx.doi.org/10.1021/ci100050t. [DOI] [PubMed] [Google Scholar]
- 58.Pedregosa Fabian, Varoquaux Gaël, Gramfort Alexandre, Michel Vincent, Thirion Bertrand, Grisel Olivier, Blondel Mathieu, Prettenhofer Peter, Weiss Ron, Dubourg Vincent, et al. Scikit-learn: Machine learning in python. The Journal of Machine Learning Research. 2011;12:2825–2830. [Google Scholar]
- 59.O’Boyle NM, Banck M, James CA, Morley C, Vandermeersch T, Hutchison GR. Open Babel: An open chemical toolbox. Journal of Cheminformatics. 2011;3:33. doi: 10.1186/1758-2946-3-33. [PubMed:21982300] [PubMed Central:PMC3198950] [DOI] [PMC free article] [PubMed] [Google Scholar]
- 60.Jia Yangqing, Shelhamer Evan, Donahue Jeff, Karayev Sergey, Long Jonathan, Girshick Ross, Guadarrama Sergio, Darrell Trevor. Caffe: Convolutional architecture for fast feature embedding. arXiv preprint arXiv:1408.5093. 2014 [Google Scholar]
- 61.Choi Yoonjoo, Deane Charlotte M. FREAD revisited: Accurate loop structure prediction using a database search algorithm. Proteins. 2009 doi: 10.1002/prot.22658. pages NA–NA, URL http://dx.doi.org/10.1002/prot.22658. [DOI] [PubMed] [Google Scholar]
- 62.Tan Lu, Geppert Hanna, Sisay Mihiret T, Gütschow Michael, Bajorath Jürgen. Integrating structure- and ligand-based virtual screening: Comparison of individual, parallel, and fused molecular docking and similarity search calculations on multiple targets. ChemMedChem. 2008 Oct;3(10):1566–1571. doi: 10.1002/cmdc.200800129. URL http://dx.doi.org/10.1002/cmdc.200800129. [DOI] [PubMed] [Google Scholar]
- 63.Lusci Alessandro, Pollastri Gianluca, Baldi Pierre. Deep architectures and deep learning in chemoinformatics: The prediction of aqueous solubility for drug-like molecules. Journal of Chemical Information and Modeling. 2013 Jul;53(7):1563–1575. doi: 10.1021/ci400187y. URL http://dx.doi.org/10.1021/ci400187y. [DOI] [PMC free article] [PubMed] [Google Scholar]
- 64.Chen Beining, Harrison Robert F, Papadatos George, Willett Peter, Wood David J, Lewell Xiao Qing, Greenidge Paulette, Stie Nikolaus. Evaluation of machine-learning methods for ligand-based virtual screening. Journal of Computer-Aided Molecular Design. 2007 Jan;21(1–3):53–62. doi: 10.1007/s10822-006-9096-5. URL http://dx.doi.org/10.1007/s10822-006-9096-5. [DOI] [PubMed] [Google Scholar]
Associated Data
This section collects any data citations, data availability statements, or supplementary materials included in this article.


