

Abstract
Objective(s):
Type 2 diabetes mellitus (T2DM) is associated with circadian disruption. Our previous experimental results have showed that dietary Lycium barbarum. polysaccharide (LBP-4a) exhibited hypoglycemic and improving insulin resistance (IR) activities. This study was to explore the mechanisms of LBP-4a for improving hyperglycemia and IR by regulating biological rhythms in T2DM rats.
Materials and Methods:
The rats of T2DM were prepared by the high-sucrose-fat diets and injection of streptozotocin (STZ). The levels of insulin, leptin and melatonin were measured by enzyme linked immunosorbent assay (ELISA). The effect of LBP-4a on mRNA expression of melatonin receptors (MT2) in epididymal adipose tissue was evaluated by RT-PCR. The expression of CLOCK and BMAL1 in pancreatic islet cells was detected by Western blotting.
Results:
Our data indicated that the 24-hr rhythm of blood glucose appeared to have consistent with normal rats after gavaged administration of LBP-4a for each day of the 4 weeks, and the effects of hypoglycemia and improving hyperinsulinemia in T2DM rats treated at high dose were much better than that at low dose. The mechanisms were related to increasing MT2 level in epididymal adipose tissue and affecting circadian clocks gene expression of CLOCK and BMAL1 in pancreatic islet cells.
Conclusion:
LBP-4a administration could treat T2DM rats. These observations provided the background for the further development of LBP-4a as a potential dietary therapeutic agent in the treatment of T2DM.
Keywords: Circadian clocks, Lycium barbarum, Melatonin receptors, Polysaccharide, Type 2 diabetes mellitus
Introduction
Circadian rhythms have long been known in animals and humans, but taken into account in the therapy of diabetes mellitus in humans has been seldom known. Recently, molecular biology has brought new insight into the mechanisms by which such rhythms are generated (1). New understanding has been revealed that there is a close relationship between circadian clocks and pathophysiological condition in type 2 diabetes mellitus (T2DM) at the molecular level (2). Pancreas secretes insulin to maintain glucose homeostasis, whereas the rhythmic process in the diabetic organism is disrupted (3). In a sense, anti-diabetic therapy is to adjust rhythm disorders associated with diabetes. The sensitivity to hypoglycemic drugs shows that circadian rhythm is both in healthy and diabetic organism (4). It has become increasingly clear that pancreatic islet has its dedicated clock and that controls the rhythm behavior of genes and proteins related with insulin secretion (5). The oscillation period is about 24 hr. The change of insulin secretion and diabetes susceptibility is associated with the mechanisms of dedicated clock. Diabetes mellitus will occur if the dedicated clock is fault. The clock genes and protein products of CLOCK and BMAL1 play a key role in the process (6).
It has been confirmed that the secretion of melatonin exhibits the law with a low volume during the day and a high volume at night, and suprachia- smatic nucleus is regulating source of the rhythm (7). Melatonin receptors (MT) are divided into three subtypes including MT1, MT2 and MT3. MT2 subtype gene mutation could lead to the function loss of melatonin receptors, which affects the function of the circadian clock gene, finally, abnormal insulin secretion happens and leads to the formation of T2DM (8). Melatonin signal introduces paraventricular nucleus through the suprachiasmatic nucleus, whereas leptin and insulin signals introduce paraventricular nucleus through the arcuate nucleus. Leptin and melatonin present functional antagonism, and leptin could regulate fat deposition (9).
Lycium barbarum, small red berry, has been used as a traditional Chinese herbal medicine for the treatment of infertility, cancer, diabetes, abdominal pain, dry cough, fatigue, and headache, also to increase longevity. LBP-4a, the dietary active ingredient extracted from L. barbarum., has been discovered in bioactivities such as enhancing immune function, regulating blood sugar and protecting the nervous system (10, 11). We have previously showed that LBP-4a is composed of heteropolysaccharides and various carbohydrate compositions, and exhibited improving insulin resistance (IR) activities (12). However, any circadian time-related consequences of LBP-4a administration are unknown. In this study, we investigated the effects of LBP-4a on T2DM rats by regulating biological rhythms and clarified its relevant mechanisms. The experimental results may deepen the time biology theory for diabetes, and provide comprehensive, scientific evidence for LBP-4a in the aspect of clinical rational drug use.
Materials and Methods
Drugs and reagents
The fruits of L. barbarum. Were collected in the Ningxia Hui Autonomous region, which is the well-known production area in China and were authenticated at the Heilongjiang August First Land Reclamation University. A specimen (NO.20110609) was deposited in the herbarium of the Botany Department. Streptozotocin (STZ) was from Sigma Chemical Co (St Louis, MO, USA); 0.5% STZ solution was prepared with 0.1 mol/l citric acid and sodium citric acid buffer (pH 4.4) before use. Reagent for triglyceride (TG) and the ELISA kits for insulin, melatonin and leptin were obtained from Nanjing Jiancheng Bioengineering technology (Nanjing Jiancheng Bioengineering technology Co, LTD, China). Hematoxylin, eosin, anti-CLOCK and anti-BMAL1 were purchased from Santa Cruz Biotechnology, Inc. (Dallas, TX, USA). All other reagents and chemicals were of the highest purity grade available.
Preparation of LBP-4a from L. barbarum
LBP-4a isolation, purification and identification were based on our previously published work (12). LBP-4a was identified to be a homogeneous polysaccharide component, which showed a single symmetrical peak following Sephadex G-100 gel chromatography. The MW of LBP-4a was 33,867 Da, and the retention time was 8.257 min by HPLC. In addition, the monosaccharide composition of LBP-4a was analyzed by paper chromatography and revealed the presence of six spots, corresponding to that of galactose, glucose, rhamnose, arabinose, mannose, and xylose. According to the IR spectrum, the purified LBP-4a displayed a broadly stretched, intense peak at 3,428 cm-1, which is a characteristic of hydroxyl group and a weak C-H peak at around 2,915 cm-1. The relatively strong absorption peak at around 1,710 cm-1 indicated the carbonyl group. The absorbance of polysaccharides in the range 1,000-1,200 cm-1 was the C-O-C and C-O-H link band positions. The backbone of sugar residue chains in LBP-4a contained 1→6 indican bonds, according to periodate oxidation. The results of the β-elimination reaction indicated that the chain of polysaccharides and protein were connected by O-linked chemical bond.
Experimental animals and treatments
Wistar rats weighing 230~250g were provided by the Animal Department of Beijing Institute of Traditional Medical and Pharmaceutical Sciences. The animals were treated according to the National Institute of Health Guide for the Care and Use of Laboratory Animals and further approval for their experimentation was obtained from the Animal Ethics Committee of the university. By the methods in reference (13), eight rats were chosen out randomly as control and the rest were fed on high-sucrose-fat diet. After exposure to the high-sucrose-fat diets for 4 weeks, rats were intraperitoneally injected with 0.5% STZ solution at the dose of 50 mg/kg weights. 72 hr after injection, the blood sample was collected from tail vein in the fasted rats, and the level of blood glucose was determined. The blood glucose level of over 16.7 mmol/l was defined as diabetic model rats. Then these rats were randomly assigned to the following three groups with eight rats in each group: the model group, the LBP-4a treatment group at high dose (10 mg/kg·d), and the LBP-4a treatment group at low dose (5 mg/kg·d). In the LBP-4a group, the rats were treated by intragastric administration with LBP-4a dissolved in normal saline and model group rats (T2DM) received normal saline for 4 weeks. All rats were housed in an animal room at 22±2°C and 50±10% relative humidity and had free access to laboratory chow and tap water. The rats were adapted to an inverse 12:12-hr light-dark cycle.
Method of measurement
In order to compare the circadian rhythm changes of blood glucose in normal rats and T2DM rats, all rats were fasted for 12 hr and the blood glucose was tested every 4 hr (at 10 a.m. 2 p.m. 6 p.m, 10 p.m. 2 a.m. and 6 a.m.) for three consecutive days. After taking corresponding time average of every day, the circadian rhythm of blood glucose was evaluated by the cosine method. LBP-4a treatment for 4 weeks, the blood was collected from the eyes of the rats to determine the levels of glucose, insulin, triglyceride, leptin and melatonin. Blood glucose level was measured using a One Touch II Micro Blood Glucose instrument (Jingdu, Japan). The level of triglyceride was analyzed using an autoanalyzer (Beckman, Germany). The levels of insulin, leptin and melatonin were measured by enzyme linked immunosorbent assay (ELISA). All rats were anaesthetized and decapitated and the epididymal fat tissue was obtained as soon as possible for the same location, instantly weighed by electronic microbalance.
Determination of pancreas morphology
The pancreas of treated and control rats was excised and fixed in 4% formalin, embedded in paraffin, and cut into 4 µm sections for histology study.
Isolation of pancreatic islet cells
Animals were anesthetized by intraperitoneal injection of ketamine/xylazine (50 mg/kg and 10 mg/kg) and the abdomen was exposed, and 0.5 mg/ml of collagenase P in 10 ml cold Hanks’ balanced salt solution (HBSS) [pH 7.4; containing KCl, 5.36; CaCl2, 1.26; NaCl, 136; MgSO4 7 H2O, 0.8; Na2HPO4 2 H2O, 0.33; NaHCO3, 4.16; KH2PO4, 0.44) all in mM and gassed with 95% O2, 5% CO2for 5 min at the beginning] was injected into the common bile duct; the expanded pancreas was detached, transmitted to a 50 ml falcon container and placed in a water bath (37°C) for 15 min. At the end of digestion, 30 ml cold HBSS was added and the tube was shaken for 1 min. Islets were hand-picked, washed once with Ca2+/Mg2+-free HBSS, and dispersed into single cells by a brief incubation with 0.05% trypsin-EDTA in a Ca2+/Mg2+-free medium using a mild mechanical disruption. The dispersed islet cells were cultured (25,000-30,000 cells/well) in RPMI-1640 medium supplemented with 10% fetal bovine serum and 1% of penicillin/streptomycin (14).
mRNA expression of MT2 receptor in epididymal adipose tissue by RT-PCR
Adipocytes from epididymal fat pads were isolated by tissue collagenase digestion based on the method with slight modification (15). Fat pads were minced and suspended in 50 ml of Krebs-Ringer solution (0.1 M NaCl, 5 mM KCl, 2.5 mMCaCl2, 1.25 mM MgSO4, 1.25 mM NaH2PO4) containing 25 mM HEPES, 5 mM glucose, 1% BSA, and 50 mg collagenase type II; the buffer was adjusted to pH 7.4 after the addition of BSA. Total RNA was extracted from epididymal fat pads using TRIzol reagent (Life Technologies, Darmstadt, Germany). cDNA synthesis was performed by High Capacity cDNA Reverse Transcription Kit (Life Technologies) using random hexamer primers. The real-time quantitative PCR was performed using iQ SYBR Green Supermix (Bio-Rad, Munich, Germany) according to the manufacturer’s protocol. Primers used were as follows: for MT2 receptor, forward, 5’-ATCACGCTCCTAGAACTCTG-3’ and reverse, 5’-ACTTGTCCGAAGCCTCTTTG-3’, for β-actin, forward, 5’-TCAGGTCATCACTATCGGCAAT-3’ and reverse, 5’-AAAGAAAGGGTGTAAAACGCA-3’. Relative gene expression was quantified using 2-△△C (t) threshold cycle method and β-actin as a reference gene.
Analysis of CLOCK and BMAL1 expression in pancreatic islet cells
After LBP-4a treatment with the given dose for 4 weeks, cells were collected. The proteins were measured by the Bradford assay using bovine serum albumin as the standard and CLOCK and BMAL1 were detected by western blotting analysis. Proteins were eluted by boiling in nonreducing sodium dodecyl sulfate polyacrylamide gel electrophoresis (SDS-PAGE) sample buffer and then subjected to electrophoresis (10% polyacrylamide gel) and electroblotted onto polyvinylidene fluoride membranes. After blocking the membranes, CLOCK and BMAL1 were detected by overnight incubation at 4°C with 0.1 μg/ml biotinylated goat anti-mouse CLOCK and BMAL1 antibody. The membrane was incubated with streptavidin-horseradish peroxidase polymer conjugate in 5% skim milk. After 4 more washes in the same solution, the bands of the proteins were visualized using the ECL DuraTM chemiluminescence detection system.
Statistical analysis
All the data were analyzed using SPSS/13.0 software. Statistical analysis was performed by one-way analysis of variance (ANOVA). P-values of less than 0.05 were considered to be significant. All the results were expressed as the mean ± SD. Biological rhythm of blood glucose was calculated by cosine curve fitting parameters (16). Cosinor analysis involves representation of data span by the best-fitting cosine function of the form: Y=M+Acos(ωt+θ), Y represents the time of measurements for the t individual; M is the median of the cosine curve; A is the amplitude of the function; ω is the angular frequency, and the angular frequency of circadian rhythms is 15°/h; θ is the acrophase (horizontal shift) of the curve. It is possible to use more than one cosine function with different values of ω (whether or not in harmonic relation) or a combined linear-nonlinear rhythmometry (17). The equation could be fitted to the data by conventional methods of least-squares regression analysis.
Results
The effects of LBP-4a on blood glucose and insulin in T2DM rats
To describe blood sugar-time curves between nocturnal and diurnal, blood glucose levels of 6 time point among 24-hr day-night were determinated in each group rats and proceeded macro analysis to compared biological time series concerned with blood glucose levels. The results showed circadian fluctuations of blood glucose in normal rats were obvious alternating at peak and valley value, which exhibited the circadian rhythm changes of blood glucose (Figure, 1a). Within the 24 hr of testing, two peaks (10 p.m. and 10 a.m. respectively) and two valley values (at 6 p.m. and 6 a.m. respectively) were appeared, moreover, blood glucose levels of nocturnal and diurnal were all below 10.0 mmol/l. Compared with the circadian rhythm of blood glucose in normal rats, the time of peak and valley value shifted in T2DM rats. It presented obvious rhythm disorder, which showed the blood glucose levels had two peak time (at 10 a.m. and 6 p.m. respectively) and two valley value time (at 2 p.m. and 2 a.m. respectively), moreover, their blood glucose levels were apparently higher than 16.7 mmol/l. In addition, the blood glucose of peak and valley value was no significant difference in T2DM rats. T2DM rats were divided into two groups treated with LBP-4a at high or low dose, respectively. After 4 weeks, the blood glucose levels at each time point in high dose treated group were significantly lower than before administration, and the peak and valley value time of nocturnal and diurnal appeared to have consistent with normal rats (Figure 1b). In addition, the experimental results also showed that plasma insulin levels were decreased in T2DM rats treated with LBP-4a for 4 weeks. Now these results displayed that the effects of hypoglycemia and improving hyperinsulinemia in T2DM rats treated with LBP-4a at high dose were much better than those at low dose (Table 1).
Figure 1.
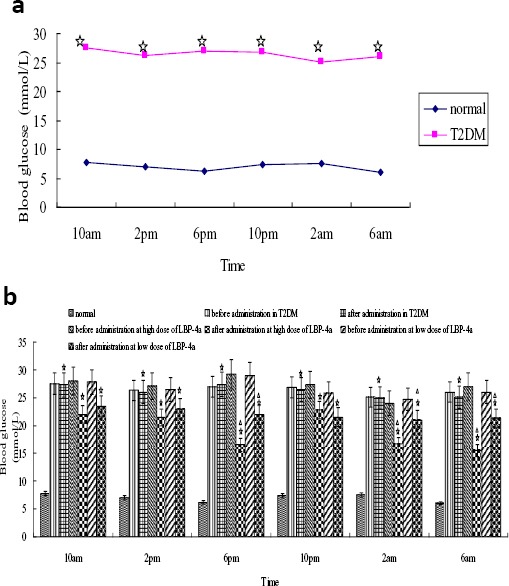
Analysis of the blood glucose levels in rats. (a) The blood glucose comparison of circadian rhythm between normal and diabetes group rats. Compared with normal group, ☆P<0.01
(b) The blood glucose comparison of LBP-4a on T2DM. Compared with normal group in the same time, ☆P<0.01; Compared with 1 day before LBP-4a administration, △P<0.05
Table 1.
Change of blood glucose and insulin in T2DM rats by LBP-4a administration (Mean±SD, n=8)
| Index | LBP-4a(H) | LBP-4a(L) | ||
|---|---|---|---|---|
| before administration | after administration | before administration | after administration | |
| Blood glucose (mmol/l) | 23.57±2.32 | 15.21±1.22* | 23.95±2.45 | 18.57±1.35* |
| Insulin (mU/l) | 6.89±1.23 | 5.01±1.01*▲ | 6.81±1.18 | 6.08±1.27* |
Compared with before the treatment in the same group,
P<0.05; Compared with after the treatment at LBP-4a (L) group,
P<0.05
The effect of LBP-4a on body weight (BW), epididymal fat tissue weight (FW), melatonin, leptin and triglyceride (TG) in T2DM rats
To better understand the effect of LBP-4a on T2DM rats, we evaluated body weight, epididymal fat tissue weight, the levels of melatonin, leptin and triglyceride in T2DM rats. As showed in Table 2, the body weight, epididymal fat tissue weight, the levels of leptin and triglyceride in T2DM rats were all significantly increased compared with normal control group. It suggested that IR and leptin resistance were existed in T2DM rats. Moreover, the relationship between the two was close, which was consistent with the foreign research result (18). The concentration of melatonin, another index that influences fat metabolism, was decreased obviously in T2DM rats. After treatment with LBP-4a (high dose) for 4 weeks, compared with T2DM and LBP-4a (low dose) group, the body weight, epididymal fat tissue weight and leptin concentration were reduced significantly, whereas the concentration of melatonin was increased obviously. The change of the melatonin concentration could indeed play a role as a kind of environmental factors in regulating energy metabolism. The concentration of triglyceride among the groups did not show obvious difference.
Table 2.
Change of BW, FW, Melatonin, Leptin and TG in T2DM rats by LBP-4a administration (Mean±SD, n=8)
| Group | BW (g) | FW (g) | Melatonin (ng/l) | Leptin (ng/dl) | TG (mmol/l) |
|---|---|---|---|---|---|
| Normal | 253.07±32.21 | 1.04±0.27 | 5.47±0.30 | 1.39±0.04 | 0.85±0.11 |
| T2DM | 294.97±39.75 * | 1.41±0.32 * | 4.34±0.21 * | 3.05±0.09 * | 1.27±0.45 * |
| LBP-4a(H) | 258.33±32.17▲ | 1.07±0.35▲ | 4.90±0.24▲ | 2.07±0.05▲ | 1.15±0.31 * |
| LBP-4a(L) | 273.53±33.16• | 1.37±0.40• | 4.72±0.17• | 2.81±0.03• | 1.20±0.28 * |
Compared with normal group
P<0.05,
P<0.01;
Compared with T2DM,
P<0.05
BW: body weight; FW: fat tissue weight; TG: triglyceride
The effect of LBP-4a on pancreas morphology in T2DM rats
It is important to point out that the improving effect of LBP-4a on pancreas in T2DM rats. Morphologic detection of the pancreas from T2DM rats treated with LBP-4a were compared to their control counterparts. The results were illustrated in Figure 2, in the normal control group, the islets were not only round or oval, and dispersed between pancreatic acini but also the quantity was more, and the boundary of islet was clear, no envelop. The disruption of pancreatic architecture could be seen in T2DM rats, such as islet atrophy, less quantity, sparse distribution and degenerative changes. However, these damages were meliorated in T2DM rats treated with LBP-4a, and the improvement was more obvious in the rats treated at high dose.
Figure 2.
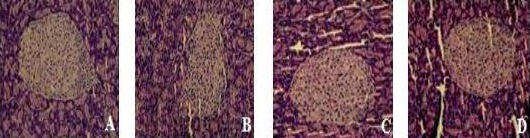
Pathology sections of pancreas (HE ×200)
A: Normal; B: T2DM; C: LBP-4a (H); D: LBP-4a(L)
The effect of LBP-4a on mRNA expression of MT2 in epididymal adipose tissue
We investigated the involvement of melatonin receptor MT2 in T2DM rats treated with LBP-4a. The mRNA expression of MT2 was detected in epididymal adipose tissue by RT-PCR. As showed in Figure 3, the expression level of MT2 was decreased in T2DM rats compared with normal rats. LBP-4a administration for 4 weeks, the expression level was increased, specifically; LBP-4a treatment at high dose was obviously significant (P<0.05).
Figure 3.
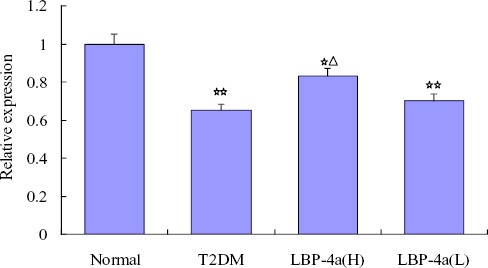
The effect of time-scheduled regimen with LBP-4a on mRNA expression of MT2 in epididymal adipose tissue. Compared with normal group, ☆☆P<0.01, ☆P<0.05; Compared with T2DM group, △P<0.05
The effect of LBP-4a on CLOCK and BMAL1 expression in pancreatic islet cells
Further studies were needed to determine the importance of the clock genes in pancreatic islet cells by assessing the protein products of CLOCK and BMAL1. As showed in Figure 4, a significant decrease in CLOCK and BMAL1 was observed in T2DM rats. However, the expression of CLOCK was significant increase when T2DM rats were treated with LBP-4a, and this effect was more prominent in the group of high dose. In addition, the expression of BMAL1 was significant increase in T2DM rats treated with LBP-4a at high dose, and the effect was not obvious in the group of low dose. The results suggested that LBP-4a treatment at high dose for 4 weeks could affect circadian clocks gene in pancreatic islet cells.
Figure 4.
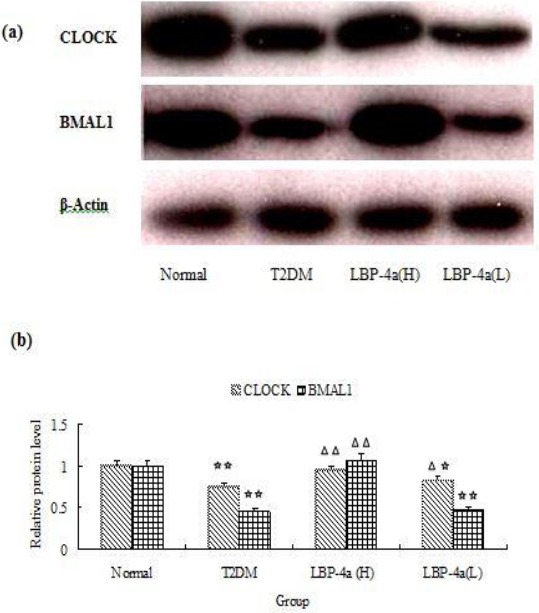
The Effect of LBP-4a on CLOCK and BMAL1 Expression in Islet Cells. (a)Western blot (b) Statistical bar garaph of expression of CLOCK and BMAL1 protein. Immunoblots were scanned within the linear range and quantitated using the computer software. The quantitated values represent the mean± S.D. Compared with Normal, ☆P<0.05; ☆☆P<0.01. Compared with T2DM, △P<0.05; △△P<0.01
Discussion
Circadian rhythm disruption promotes obesity and the development of obesity-associated disorders such as T2DM. A pronounced circadian rhythm in blood glucose concentrations has been described in experimental animals (19). The effectiveness of many drugs are associated with 24-hr rhythms of biochemical processes under the control of the circadian clock (20, 21). In this study, the circadian rhythm of blood glucose was disorder in T2DM rats, and the emerging time of the peak and valley shifted during nocturnal and diurnal. After administration with LBP-4a for 4 weeks, the improving effects in T2DM rats treated at high dose were much better than that at low dose, which attributed to the recoverment of normal circadian rhythm of blood glucose.
Circadian misalignment is associated with the increased risk of T2DM. Meanwhile, the mechanism is partly explained by decreased melatonin (22). Melatonin could change body weight, which might be related to the change of plasma leptin. In our study, melatonin level was increased, whereas leptin level was decreased in T2DM rats treated with LBP-4a. The serum leptin levels were increased in T2DM rats, which was consistent with the results of a previous study (18, 23). Leptin, a hormone produced by adipocytes, reduces food intake and body weight (24). In an obese condition, leptin signaling is attenuated, and then leads to leptin resistance and hyperleptinemia (25). Leptin is also an important messenger for fat-islet feedback shaft. Insulin can stimulate the secretion of leptin, in turn, leptin creates negative feedback for inhibiting insulin secretion. Leptin resistance in the brain results in excess triglyceride accumulation in adipose tissue, muscle, liver, and the pancreas, which will trigger IR (26). IR is a precursor and a characteristic feature of T2DM (27). LBP-4a treatment could improve hyperleptinemia by attenuating obesity, thus, contributing to improving insulin sensitivity and hyperglycemia in T2DM rats. But the specific signal transduction mechanism remained to be further research. The triglyceride levels were not changed, which just illustrated the change of the adipose tissue metabolism or just a reflection of melatonin function itself. Perhaps melatonin produced a unique impact on epididymal fat tissue metabolism, which was from the effect of melatonin on reproductive function.
Studies have confirmed that melatonin receptor signaling regulated the islet failure in T2DM. MT2 gene mutations make melatonin receptor function miss, which will affect the functions of circadian clock gene, ultimately lead to abnormal insulin secretion and T2DM (28, 29). Interestingly, the expression level of MT2 was decreased in epididymal adipose tissue of T2DM rats, nevertheless, LBP-4a administration for 4 weeks, the expression level was increased, and the effect was obviously in high dose group. Thus, the above results revealed a novel and peripherally regulated mechanism by treatment with LBP-4a for T2DM.
A circadian clock of local tissue is in pancreatic islet cells, which could integrate biological rhythm signals and metabolism signals (30). It could therefore be concluded that biological rhythm analysis was a deeper understanding and treatment for T2DM. Specifically, pancreatic islet cells secretory function and survival are under transcriptional control of the circadian clock. Circadian disruption in diabetes prone rodents accelerates hyperglycemia through induction of islet failure (6). CLOCK and BMAL1 are two helix-loop-helix transcription factors which are essential components of the circadian clock (31). To further elucidate the promoting mechanism of LBP-4a, we analyzed the role of clocks in pancreatic islet cells of T2DM rats. In the present study, one of the key observations was that the dedicated clocks regulated rhythmic blood glucose; however, the circadian rhythm was changed in T2DM rats. These results were consistent with the findings, which the decrease of pancreas-specific CLOCK and BMAL1 exhibited a loss of circadian rhythms in glucose tolerance and insulin secretion (32). Furthermore, our results suggested that the decreased expression of CLOCK and BMAL1 also show impaired regulation on islet growth, survival, and proliferation. LBP-4a could affect the expression of CLOCK and BMAL1 in pancreatic islet cells and improve thedamaged pancreaticislet (Figure 2). These findings suggested that the improving effective mechanism of LBP-4a for T2DM rats might be related to the expression of CLOCK and BAML1 in the pancreatic islet cells.
Conclusion
In view of this, we are optimistic to speculate the unique advantage of LBP-4a will display when the biological clock theory is introduced to the treatment for T2DM. It will become clear that the tight connections are in between thededicated circadian clock system and T2DM. The current study will provide a theoretical basis for developing LBP-4a, a health food products based on chronotherapeutics for T2DM clinic treatment.
Of note, our experimental results came from studies in nocturnal laboratory rodents; however, some relevant findings in diurnal mammals, including humans have not given. The experimental results is only reference for human, the specific situation of the human still need further study.
Acknowledgment
This research was supported by the China Postdoctoral Science Foundation of China (grant no. 2014M551281).
Conflict of interest
The authors declare that they have no conflict of interest.
References
- 1.Sohail S, Yu L, Bennett DA, Buchman AS, Lim ASP. Irregular 24-hr activity rhythms and the metabolic syndrome in older adults. Chronobiol Int. 2015;10:1–12. doi: 10.3109/07420528.2015.1041597. [DOI] [PMC free article] [PubMed] [Google Scholar]
- 2.Nishi T, Saeki K, Obayashi K. The effect of blue-blocking intraocular lenses on circadian biological rhythm: protocol for a randomised controlled trial (CLOCK-IOL colour study) BMJ Open. 2015;5:e007930. doi: 10.1136/bmjopen-2015-007930. [DOI] [PMC free article] [PubMed] [Google Scholar]
- 3.Wang K, Sun Y, Lin P, Song J, Zhao R, Li W, et al. Liraglutide Activates AMPK Signaling and Partially Restores Normal Circadian Rhythm and Insulin Secretion in Pancreatic Islets in Diabetic Mice. Biol Pharm Bull. 2015;38:1142–9. doi: 10.1248/bpb.b15-00024. [DOI] [PubMed] [Google Scholar]
- 4.Sohail S, Yu L, Bennett DA, Buchman AS, Lim AS. Diurnal variations of blood glucose by continuous blood glucose monitoring in peritoneal dialysis patients with diabetes. Adv Perit Dial. 2014;30:54–59. [PubMed] [Google Scholar]
- 5.Rakshit K, Thomas AP, Matveyenko AV. Does disruption of circadian rhythms contribute to beta-cell failure in type 2 diabetes? Curr Diab Rep. 2015;14:474–478. doi: 10.1007/s11892-014-0474-4. [DOI] [PMC free article] [PubMed] [Google Scholar]
- 6.Gale JE, Cox HI, Qian J, Block GD, Colwell CS, Matveyenko AV. Disruption of circadian rhythms accelerates development of diabetes through pancreatic beta-cell loss and dysfunction. J Biol Rhythms. 2011;26:423–433. doi: 10.1177/0748730411416341. [DOI] [PMC free article] [PubMed] [Google Scholar]
- 7.Peschke E, Bähr I, Mühlbauer E. Experimental and clinical aspects of melatonin and clock genes in diabetes. J Pineal Res. 2015;59:1–23. doi: 10.1111/jpi.12240. [DOI] [PubMed] [Google Scholar]
- 8.Karamitri A, Vincens M, Chen M, Jockers R. Involvement of melatonin MT2 receptor mutants in type 2 diabetes development. Med Sci (Paris) 2013;29:778–784. doi: 10.1051/medsci/2013298018. [DOI] [PubMed] [Google Scholar]
- 9.Ríos-Lugo MJ, Jiménez-Ortega V, Cano-Barquilla P, Mateos PF, Spinedi EJ, Cardinali DP, et al. Melatonin counteracts changes in hypothalamic gene expression of signals regulating feeding behavior in high-fat fed rats. Horm Mol Biol Clin Investig. 2015;21:175–183. doi: 10.1515/hmbci-2014-0041. [DOI] [PubMed] [Google Scholar]
- 10.Hu YT, Li Q, Yang H. Protective effect of polysaccharides on simulated microgravity-induced functional inhibition of human NK cells. Carbohydr Polym. 2014;101:819–827. doi: 10.1016/j.carbpol.2013.10.021. [DOI] [PubMed] [Google Scholar]
- 11.Zhao R, Li QW, Li J, Zhang Tao. Protective effect of Lycium barbarum polysaccharide 4 on kidneys in streptozotocin-induced diabetic rats. Can J Physiol Pharmacol. 2009;87:711–719. doi: 10.1139/y09-068. [DOI] [PubMed] [Google Scholar]
- 12.Zhao R, Qiu B, Li QW. LBP-4a improves insulin resistance via translocation and activation of GLUT4 in OLETF rats. Food Funct. 2014;5:811–820. doi: 10.1039/c3fo60602c. [DOI] [PubMed] [Google Scholar]
- 13.Wu M, Ji H, Li P. Study of hypoglycemic mechanism of Tang kening on diabetic rats induced by STZ. Journal of Nanjing Chinese Trational Medical and Medicine University. 1999;15:22–25. [Google Scholar]
- 14.Szot GL, Koudria P, Bluestone JA. Murine pancreatic islet isolation. J Vis Exp. 2007;7:255–256. doi: 10.3791/255. [DOI] [PMC free article] [PubMed] [Google Scholar]
- 15.Fred Z, Jean AK, David EB. Inhibition of Isoproterenol- Induced Lipolysis in Rat Inguinal Adipocytesin Vitroby Physiological Melatonin via a Receptor-Mediated Mechanism. Endocrinology. 2014;142:3783–3790. doi: 10.1210/endo.142.9.8378. [DOI] [PubMed] [Google Scholar]
- 16.Nelson W, Tong YL, Lee JK, Halberg F. Methods for cosinorrhythmometry. Chronobiologia. 1979;6:305–323. [PubMed] [Google Scholar]
- 17.Šoltésová D, Monošíková J, Koyšová L, Veselá A, Mravec B, Herichová I. Effect of Streptozotocin-induced Diabetes on Clock Gene Expression in Tissues Inside and Outside the Blood-brain Barrier in Rat. Exp Clin Endocrinol Diabetes. 2013;121:466–474. doi: 10.1055/s-0033-1349123. [DOI] [PubMed] [Google Scholar]
- 18.Wautem M, Considine RV, Yudkin JS. Leptin levels in type 2 diabetes: associations with measures of insulin resistance and insulin secretion. Horm Metab Res. 2003;35:92–96. doi: 10.1055/s-2003-39054. [DOI] [PubMed] [Google Scholar]
- 19.Cuesta M. From daily behavior to hormonal and neurotransmitters rhythms: comparison between diurnal and nocturnal rat species. Horm Behav. 2009;55:338–347. doi: 10.1016/j.yhbeh.2008.10.015. [DOI] [PubMed] [Google Scholar]
- 20.Koyanagi S. Molecular basis of choronopharmacology. Seikagaku. 2014;86:774–777. [PubMed] [Google Scholar]
- 21.Sancar A, Lindsey-Boltz LA, Gaddameedhi S, Selby CP, Ye R, Chiou YY, et al. Circadian clock, cancer, and chemotherapy. Biochemistry. 2015;54:10–23. doi: 10.1021/bi5007354. [DOI] [PMC free article] [PubMed] [Google Scholar]
- 22.Markova-Car EP, Jurišić D, Ilić N, Pavelić SK. Running for time: circadian rhythms and melanoma. Tumour Biol. 2014;35:8359–68. doi: 10.1007/s13277-014-1904-2. [DOI] [PubMed] [Google Scholar]
- 23.Sato A, Kawano H, Notsu T, Ohta M, Nakakuki M, Mizuguchi K, et al. Antiobesity effect of eicosapentaenoic acid in high-fat/high-sucrose diet-induced obesity: importance of hepatic lipogenesis. Diabetes. 2010;59:2495–504. doi: 10.2337/db09-1554. [DOI] [PMC free article] [PubMed] [Google Scholar]
- 24.Pelleymounter MA, Cullen MJ, Baker MB, Hecht R, Winters D, Boone T, et al. Effects of the obese gene product on body weight regulation in ob/ob mice. Science. 1995;269:540–543. doi: 10.1126/science.7624776. [DOI] [PubMed] [Google Scholar]
- 25.Myers JMG, Leibel RL, Seeley RJ, Schwartz MW. Obesity and leptin resistance: distinguishing cause from effect. Trends Endocrinol Metab. 2010;21:643–51. doi: 10.1016/j.tem.2010.08.002. [DOI] [PMC free article] [PubMed] [Google Scholar]
- 26.Unger RH. Lipotoxic diseases. Annu Rev Med. 2002;53:319–36. doi: 10.1146/annurev.med.53.082901.104057. [DOI] [PubMed] [Google Scholar]
- 27.Manrique C, Sowers JR. Insulin resistance and skeletal muscle vasculature: significance, assessment and therapeutic modulators. Cardiorenal Med. 2014;4:244–256. doi: 10.1159/000368423. [DOI] [PMC free article] [PubMed] [Google Scholar]
- 28.Mulder H, Nagorny CL, Lyssenko V. Melatonin receptors in pancreatic islets: good morning to a novel type 2 diabetes gene. Diabetologia. 2009;52:1240–1249. doi: 10.1007/s00125-009-1359-y. [DOI] [PubMed] [Google Scholar]
- 29.Geoffroy PA, Lajnef M, Bellivier F, Jamain S, Gard S, Kahn JP, et al. Genetic association study of circadian genes with seasonal pattern in bipolar disorders. Sci Rep. 2015;19:10232. doi: 10.1038/srep10232. [DOI] [PMC free article] [PubMed] [Google Scholar]
- 30.Buxton OM, Cain SW, O’Connor SP. Adverse metabolic consequences in humans of prolonged sleep restriction combined with circadian disruption. Sci Transl Med. 2012;4:129–143. doi: 10.1126/scitranslmed.3003200. [DOI] [PMC free article] [PubMed] [Google Scholar]
- 31.Gekakis N, Staknis D, Nguyen HB. Role of the CLOCK protein in the mammalian circadian mechanism. Science. 1998;280:1564–1569. doi: 10.1126/science.280.5369.1564. [DOI] [PubMed] [Google Scholar]
- 32.Marcheva B, Ramsey KM, Buhr ED. Disruption of the clock components CLOCK and BMAL1 leads to hypoinsulinaemia and diabetes. Nature. 2010;466:627–631. doi: 10.1038/nature09253. [DOI] [PMC free article] [PubMed] [Google Scholar]