Abstract
Secondary inorganic aerosols (SIA) are the predominant components of fine particulate matter (PM2.5) and have significant impacts on air quality, human health, and climate change. In this study, the Community Multiscale Air Quality modeling system (CMAQ) was modified to incorporate SO2 heterogeneous reactions on the surface of dust particles. The revised model was then used to simulate the spatiotemporal characteristics of SIA over China and analyze the impacts of meteorological factors and dust on SIA formation. Including the effects of dust improved model performance for the simulation of SIA concentrations, particularly for sulfate. The simulated annual SIA concentration in China was approximately 10.1 μg/m3 on domain average, with strong seasonal variation: highest in winter and lowest in summer. High SIA concentrations were concentrated in developed regions with high precursor emissions, such as the North China Plain, Yangtze River Delta, Sichuan Basin, and Pearl River Delta. Strong correlations between meteorological factors and SIA pollution levels suggested that heterogeneous reactions under high humidity played an important role on SIA formation, particularly during severe haze pollution periods. Acting as surfaces for heterogeneous reactions, dust particles significantly affected sulfate formation, suggesting the importance of reducing dust emissions for controlling SIA and PM2.5 pollution.
Secondary inorganic aerosols (SIA; i.e., sulfate, nitrate, and ammonium) are the predominant components of fine particles (PM2.5) in China, making up about 30–40% of total PM2.5 mass annually1,2, and even over 50% of PM2.5 mass during some heavy pollution episodes3. Previous studies have demonstrated that SIA has considerable impacts on human health, visibility, and climate change4,5,6,7.
Numerical modeling is a useful method for analyzing the pollution characteristics and crucial processes involved in SIA formation. SIA is generated mainly through the oxidation and neutralization of sulfur dioxide (SO2), nitrogen oxides (NOX), and ammonia (NH3). Chemical transport models consider traditional oxidation paths, such as SO2 oxidization by the hydroxyl radical (OH) in the gas phase, or by dissolved hydrogen peroxide (H2O2), ozone (O3), oxygen (O2), and organic peroxides in the aqueous phase. The formation paths of nitric acid (HNO3) include the gas-phase oxidation of OH during the day and the hydrolysis of nitrogen pentoxide (N2O5) at night. However, numerous studies have demonstrated that chemical transport models cannot simulate SIA well, especially underestimating sulfate concentrations significantly8,9,10,11. This bias could probably be attributed to the lack of some path in the transition of SO2 to sulfate.
The results of field observations and laboratory studies suggest that dust particles can enhance sulfate concentration. First, dust particles are rich in transition metals such as iron (Fe) and manganese (Mn), which can catalyze the oxidation of dissolved SO2 by O212. Using isotopic analysis, Harris et al. identified this pathway as the dominant in-cloud oxidation pathway for sulfate formation during their observation period in Germany13. In most current modeling studies, the sulfate generated by the catalyzed oxidation of SO2 was not considered because of the absence of this mechanism in the model used or the lack of emissions. Furthermore, numerous laboratory studies have confirmed the existence of heterogeneous reactions of SO2 on the surface of dust particles14,15,16. However, this pathway is not considered in most chemical transport models.
In this study, we estimated the emissions of dust particles and chemical components. To improve the model’s capability to reproduce SIA concentrations, we incorporated the heterogeneous reactions of SO2 on the surface of dust particles into the Community Multiscale Air Quality (CMAQ) modeling system, which is a widely used regional chemical transport model17,18,19. Pollution characteristics and the impacts of meteorological parameters and dust particles on SIA were investigated through full-year simulations over China by using the revised CMAQ models. The results of this study increase our understanding of the characteristics of SIA pollution in China and provide new insights on air pollution control strategies.
Results
Simulation of ambient SIA
We considered the impacts of dust particles to obtain better model performance in the SIA simulation, specifically for sulfate concentrations. First, we estimated the emissions of dust aerosols, including from erodible lands, roads, and construction activities. The dust emissions from erodible lands were calculated using the in-line windblown dust model in the CMAQ. The threshold friction velocity for loose, fine-grained soil was revised according to Chinese monitoring data to increase the capacity of the model to simulate windblown dust in China20. Information on erodible lands, including shrub land, shrub grass, and barren land, was derived from Moderate Resolution Imaging Spectroradiometer (MODIS) data. The emission factor approach was used to estimate the fugitive dust emissions from roads and construction activities (see Supplementary Section 1). In addition to the total dust emissions, we estimated the emissions of the key dust components that influence sulfate generation, including Ca2+, Fe (III), and Mn (II) (see Supplementary Section 1). Ca2+ increases the pH of cloud water, which affects the rate of aqueous-phase oxidation of S(IV). Fe(III) and Mn(II) catalyze the aqueous oxidation of S(IV) by O2. Based on the estimated dust emissions, the heterogeneous reactions of SO2 on the surface of dust particles were incorporated into the CMAQ modeling system (see Supplementary Section 2).
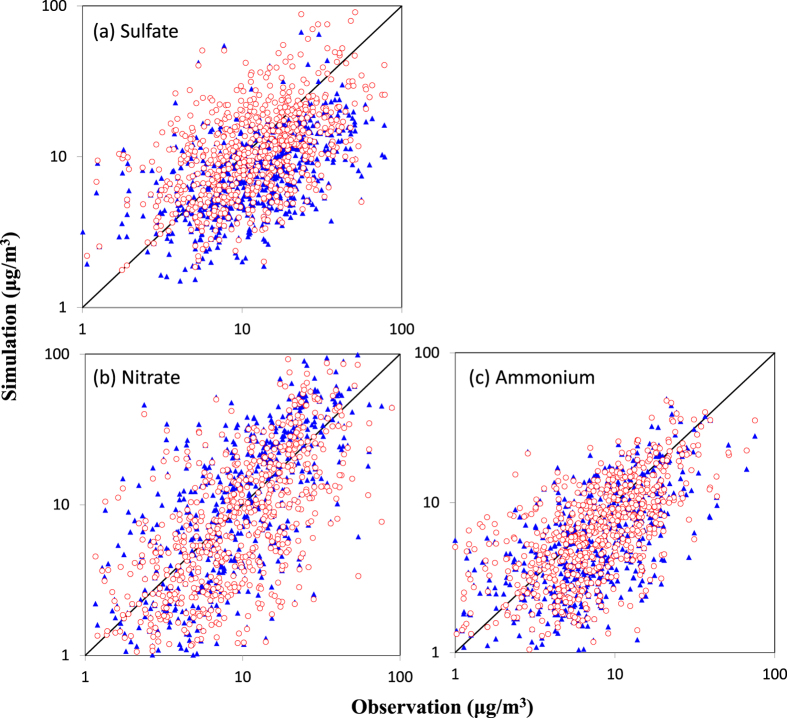
Two parallel experiments were conducted in a 36 km by 36 km simulation domain covering the whole China (see Supplementary Fig. 1). The default CMAQ modeling system was used in Simulation I, whereas sulfate enhancement by dust was considered in Simulation II. Daily observations at eight monitoring sites were used to evaluate the model performance for SIA simulation (see Supplementary Fig. 1 and Supplementary Table 5). The default CMAQ modeling system significantly underestimated sulfate concentrations, with a normalized mean bias (NMB) of −41.3% (see Supplementary Table 6). With the inclusion of dust impacts, the revised CMAQ model reduced the NMB to −12.3%, and increased the R (correlated coefficient) value from 0.4 to 0.5 (Fig. 1). NH3 partitioning with SO42− and NO3− generates SIA, and (NH4)2SO4 is the preferential species. Because of the increase in simulated sulfate concentration, the revised simulation reduced the overestimation of nitrate concentrations and the underestimation of ammonium concentrations. The NMB was reduced from 24.2% to −3.3% for nitrate and from −21.6% to −16.5% for ammonium.
Figure 1. Comparison of the simulated and observed daily concentrations for sulfate, nitrate and ammonium.
Blue triangles are results for Simulation I, and red circles are results for Simulation II.
Spatial and seasonal patterns of SIA over China
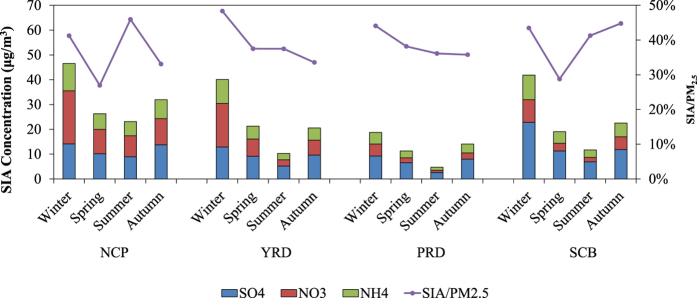
The concentrations of SIAs are shown to be highest in winter, followed by autumn and spring, and lowest in summer (see Supplementary Fig. 3). This seasonal pattern was affected by precursor emissions, wet deposition, and diffusion conditions. In winter, SO2 and NOX emissions were highest due to more coal consumption associated with heating activities in north China. Additionally, the planetary boundary layer (PBL) height and precipitation were also lowest in winter, creating favorable conditions for SIA accumulation. Moreover, the low temperatures during winter were favorable for nitrate to stay aerosol phase. High SIA concentrations were concentrated in some developed regions with high precursor emissions, such as the North China Plain (NCP), Yangtze River Delta (YRD), Sichuan Basin (SCB), and Pearl River Delta (PRD). The total SIA concentrations in these regions were 32.0, 23.1, 23.8 and 12.2 μg/m3, accounting for 36%, 40%, 40% and 39% of PM2.5 concentrations, respectively (Fig. 2). NO3− and NH4+ concentrations were highest in the NCP region, whereas SO42− concentrations were highest in the SCB region, agreeing with the spatial pattern of the precursor emissions. In winter, SIA pollution was most severe and the SIA proportions in PM2.5 were also high, at >40% for all regions. The NCP and SCB regions exhibited the lowest SIA proportions in spring because of largest contributions from windblown dust. For the YRD and PRD regions, the SIA proportions were comparatively lower in autumn, which was consistent with the observations in these regions21,22.
Figure 2. Simulated SIA concentrations and the ratios of SIA/PM2.5 in different season for the NCP, YRD, PRD and SCB region.
Meteorological impacts on SIA pollution levels
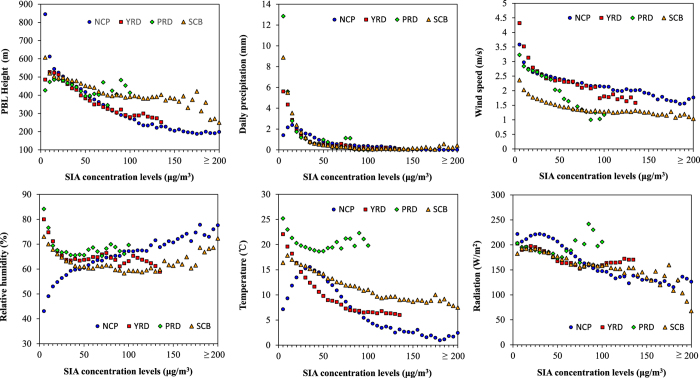
We analyzed meteorological characteristics under different SIA pollution levels in the four aforementioned regions to increase our understanding of the characteristics and causes of SIA pollution. Six meteorological factors were considered. PBL height, precipitation, and wind speed were considered because they affect the physical processes of SIA removal and dilution, such as diffusion and deposition. Additionally, relative humidity, temperature, and solar radiation were considered because they affect the chemical processes of SIA generation, such as heterogeneous oxidation, thermodynamic reactions, and photochemical oxidation. As shown in Fig. 3, “X-coordinate” refers to the 21 SIA concentration levels from 0 to >200 μg/m3 with an interval of 5 μg/m3. “Y-coordinate” refers to the mean value of the meteorological factor in all the grids where the daily SIA concentration was within the specific SIA concentration interval. Meteorological characteristics in each region were not the same, because of difference in latitude and topography. In the NCP region, decreasing PBL height and wind speed aggravated SIA accumulation more than precipitation did. Additionally, the SIA concentration presented a significant positive correlation with relative humidity, which was attributed to the enhanced heterogeneous generation under high relative humidity and stable meteorological conditions3,23. As expressed in the Supplementary Equation 4, the uptake coefficient of SO2 heterogeneous reactions increased rapidly with increasing relative humidity. The similar positive correlation existed in the SCB region under heavy SIA pollution level (>150 μg/m3). At the same time, a negative correlation existed between SIA concentration and radiation in the NCP and SCB regions, indicating that heterogeneous oxidation under high relative humidity was more critical for SIA generation than photochemical oxidation was, particularly under severe SIA pollution. But, in the PRD region, photochemical oxidation would be more important. First, solar radiation in the PRD was stronger than that in the NCP and SCB because of the region’s lower latitude. These factors resulted in stronger photochemical oxidation in the PRD compared to the NCP and SCB regions. Dust concentrations in the PRD were also comparatively lower, which led to lower heterogeneous oxidation. Additionally, for the PRD region, among three meteorological factors affecting physical processes, wind speed decreased significantly under SIA pollution condition, but PBL height and precipitation remained relatively stable. This indicated that low wind speed was a critical factor of SIA pollution in this region. In all regions except the PRD, a distinct negative correlation existed between SIA concentrations and temperature. Lower temperature was favorable for NH4NO3 to keep stable.
Figure 3. The correlations between meteorological factors and SIA pollution levels.
Sulfate enhancement by dust particles
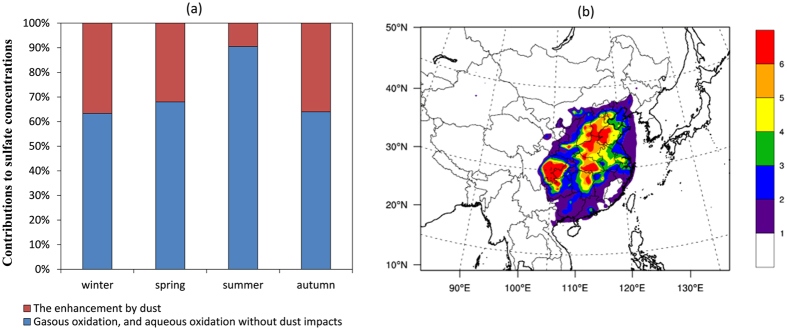
By comparing the simulation results with and without dust impacts, we quantified the sulfate enhancement by dust impacts. The aggregate sulfate concentration was increased by 1.4 μg/m3, averagely. As shown in Fig. 4a, the seasonal sulfate enhancement percentage was highest in winter (37%) and lowest in summer (10%). The main reason was that low precipitation and stable atmospheric structure in winter were favorable for the accumulation of dust particles and thus provided more reactive interfaces for the heterogeneous generation of SO2. Additionally, the concentrations of oxidative gases, such as OH, O3, and H2O2, were low in winter because of less solar radiation. This weakened the importance of gaseous and aqueous oxidation by OH, O3, and H2O2. In contrast, in summer, the dust particle concentrations were low, but the oxidant concentrations were high. Dust particles caused high sulfate enhancement in the SCB and NCP regions, with averages of 5.3 and 4.5 μg/m3, respectively (Fig. 4b). These two regions were greatly affected by high SO2 and dust particle pollution. The simulated regional annual average SO2 concentrations of the SCB and NCP regions were 24.1 and 30.1 μg/m3, and their annual average fine dust particle concentrations were 17.3 and 25.8 μg/m3, respectively. These concentrations were considerably denser than those in other parts of China.
Figure 4.
(a) Seasonal contributions of different pathways to sulfate production in China; (b) Spatial distribution of the increased sulfate concentrations (μg/m3) caused by dust impacts. This figure is produced using the NCAR Command Language (Version 6.2.1) [Software]. (2014). Boulder, Colorado: UCAR/NCAR/CISL/TDD. http://dx.doi.org/10.5065/D6WD3XH5, and Microsoft office 2013 (https://www.microsoft.com/).
The enhancement of sulfate formation by dust particles was also important in some heavy pollution episodes. For instance, a severe winter haze occurred over the North China in January, 2013, when the highest PM2.5 concentration could be above 500 μg/m3 and the sulfate concentration presented a rapid growth when the haze occurred3,24. He et al.24 discovered that the increased sulfate proportion on haze days was accompanied by an increase in the mineral proportion, indicating the importance of dust particles in sulfate generation. We analyzed the impacts of dust during the heaviest pollution episode (January 9–17, 2013). As shown in Supplementary Fig. 4, an average sulfate concentration of 51.6 μg/m3 for the whole episode was measured at a site in Tsinghua University, Beijing (40.0°N, 116.3°E)25. The corresponding simulated average sulfate concentration for the entire episode increased from 18.4 to 30.6 μg/m3. The daily enhancement for sulfate concentration was highest on January 12, at approximately 31 μg/m3. These results suggest the importance of reducing dust emissions for controlling SIA and PM2.5 pollution.
Discussion
Several uncertainties and limitations still exist in this study. First, the uptake coefficients of the heterogeneous reactions of SO2 on dust particles surface and the RH-dependent parameterization were identified according to limited literature. Because of the lack of quantitative laboratory results in the current literature, we neglected the impacts of temperature, dust particle compositions, surface conditions, and NOX promotion24,26. Additional studies are required to quantify the uptake coefficients of SO2 on dust particle surfaces more accurately. Second, the model system used in this study did not include the aerosol direct effects, which could enhanced SIA concentrations27 and improved the underestimation of sulfate concentration during episodes of severe pollution. Furthermore, the estimation of fugitive dust emissions involved high uncertainty because of limited local measurements for emission factors and the lack of accurate location information. More accurate estimates of SIA precursors and dust emissions are required for simulating SIA concentrations and dust impacts better.
Methods
We incorporated the SO2 heterogeneous reactions on the dust surface to the CMAQ model version 5.0.2. The uptake of the heterogeneous reaction was parameterized by a pseudo-first-order rate constant. We considered the impacts of relative humidity on the uptake coefficient28 and the uptake coefficient under the dry condition was identified as to be 6 × 10⁻⁵ referring to previous studies on the interaction between SO2 and dust particles14,15,16,29 (see Supplementary Section 2). Additionally, we estimated the emissions of dust aerosols, including from erodible lands, road and construction activities. The dust emissions from erodible lands were calculated by the revised in-line windblown dust model in the CMAQ. The fugitive dust emissions from road and construction activities were estimated using an emission factor approach (see Supplementary Section 1). We also estimated the emissions of the key components of dust affecting sulfate generation, including Ca2+, Fe (III) and Mn (II) (see Supplementary Section 1).
We applied both the revised and default CMAQ models over a simulation domain covering the whole China, with a grid resolution of 36 km × 36 km. It is based on a Lambert projection with the two true latitudes of 25°N and 40°N and an origin of 34°N, 110°E. The coordinates of the bottom left corner were (x = −3114 km, y = −2448 km). Twenty-three vertical layers were used from the surface to the tropopause. The gas-phase chemistry and aerosol modules chosen in the CMAQ model were the CB05 chemical mechanism and the AERO6 model. The meteorological fields for the CMAQ simulations were generated using the Weather Research and Forecasting (WRF) model, version 3.5. Because considerable changes and developments have occurred in China in the past 20 years, the default land-use data was outdated. Therefore, we updated the land-use data in the WRF using MODIS data. The other WRF data sources and major physics options were same as described in our previous paper20. The model performance for the meteorological prediction was reasonably acceptable (see Supplementary Table 3). Except the dust emissions, the emissions of other pollutants were estimated using the method described in our previous paper30. The activity data, and technology distribution for each sector were updated. The emissions of NH3 from the fertilizer application were calculated online using the bi-directional CMAQ model31. Compared with previous studies, this method considered more influencing factors, such as meteorological fields, soil and fertilizer application, and provided improved spatial and temporal resolution. The biogenic emissions were calculated by the Model of Emissions of Gases and Aerosols from Nature (MEGAN)32.
The model simulation period is the whole year of 2013. We also selected additional simulation periods of 2011 based on availability of observational data. The model evaluation was described in detail in supplementary section 3. We defined four key metropolitan regions for region-specific analysis, as shown in Supplementary Fig. 1.
Additional Information
How to cite this article: Fu, X. et al. Modeling analysis of secondary inorganic aerosols over China: pollution characteristics, and meteorological and dust impacts. Sci. Rep. 6, 35992; doi: 10.1038/srep35992 (2016).
Publisher’s note: Springer Nature remains neutral with regard to jurisdictional claims in published maps and institutional affiliations.
Supplementary Material
Acknowledgments
This work was sponsored by the MEP’s Special Funds for Research on Public Welfare (201409002), Strategic Priority Research Program of the Chinese Academy of Sciences (XDB05020300), and National Natural Science Foundation of China (21521064). This work was completed on the “Explorer 100” cluster system of Tsinghua National Laboratory for Information Science and Technology. The authors also appreciate the help of Prof. Litao Wang from Hebei University of Engineering and Prof. Yu Song from Peking University.
Footnotes
Author Contributions X.F. and S.X.W. designed the research; X.F. performed the simulations and analyzed the results; X.C. performed the model evaluation. S.Y.C. processed the emission inventory; S.X.W., J.X. and J.M.H. provided important academic guidance.
References
- Cao J.-J. et al. Winter and Summer PM2.5 Chemical Compositions in Fourteen Chinese Cities. Journal of the Air & Waste Management Association 62, 1214–1226, 10.1080/10962247.2012.701193 (2012). [DOI] [PubMed] [Google Scholar]
- Yang F. et al. Characteristics of PM2.5 speciation in representative megacities and across China. Atmospheric Chemistry and Physics 11, 5207–5219, 10.5194/acp-11-5207-2011 (2011). [DOI] [Google Scholar]
- Zheng G. J. et al. Exploring the severe winter haze in Beijing: the impact of synoptic weather, regional transport and heterogeneous reactions. Atmospheric Chemistry and Physics 15, 2969–2983, 10.5194/acp-15-2969-2015 (2015). [DOI] [Google Scholar]
- Chang W., Liao H. & Wang H. Climate Responses to Direct Radiative Forcing of Anthropogenic Aerosols, Tropospheric Ozone, and Long-Lived Greenhouse Gases in Eastern China over 1951–2000. Advances in Atmospheric Sciences 26, 748–762, 10.1007/s00376-009-9032-4 (2009). [DOI] [Google Scholar]
- Dominici F. et al. Chemical Composition of Fine Particulate Matter and Life Expectancy In 95 US Counties Between 2002 and 2007. Epidemiology 26, 556–564, 10.1097/ede.0000000000000297 (2015). [DOI] [PMC free article] [PubMed] [Google Scholar]
- Huang W. et al. Seasonal Variation of Chemical Species Associated With Short-Term Mortality Effects of PM2.5 in Xi’an, a Central City in China. Am. J. Epidemiol. 175, 556–566, 10.1093/aje/kwr342 (2012). [DOI] [PMC free article] [PubMed] [Google Scholar]
- Tan J.-H. et al. Chemical characteristics of haze during summer and winter in Guangzhou. Atmospheric Research 94, 238–245, 10.1016/j.atmosres.2009.05.016 (2009). [DOI] [Google Scholar]
- McKeen S. et al. Evaluation of several PM2.5 forecast models using data collected during the ICARTT/NEAQS 2004 field study. Journal of Geophysical Research-Atmospheres 112, 10.1029/2006jd007608 (2007). [DOI] [Google Scholar]
- Tuccella P. et al. Modeling of gas and aerosol with WRF/Chem over Europe: Evaluation and sensitivity study. Journal of Geophysical Research-Atmospheres 117, 10.1029/2011jd016302 (2012). [DOI] [Google Scholar]
- Wang S. et al. Verification of anthropogenic emissions of China by satellite and ground observations. Atmospheric Environment 45, 6347–6358, 10.1016/j.atmosenv.2011.08.054 (2011). [DOI] [Google Scholar]
- Xing J. et al. Observations and modeling of air quality trends over 1990–2010 across the Northern Hemisphere: China, the United States and Europe. Atmospheric Chemistry and Physics 15, 2723–2747, 10.5194/acp-15-2723-2015 (2015). [DOI] [Google Scholar]
- Brandt C. & Vaneldik R. Transition-metal-catalyzed oxidation of sulfur(IV) oxides - atmospheric-relevant processes and mechanisms. Chemical Reviews 95, 119–190, 10.1021/cr00033a006 (1995). [DOI] [Google Scholar]
- Harris E. et al. Enhanced Role of Transition Metal Ion Catalysis During In-Cloud Oxidation of SO2. Science 340, 727–730, 10.1126/science.1230911 (2013). [DOI] [PubMed] [Google Scholar]
- Adams J. W., Rodriguez D. & Cox R. A. The uptake of SO2 on Saharan dust: a flow tube study. Atmospheric Chemistry and Physics 5, 2679–2689 (2005). [Google Scholar]
- Gao Y. C. & Chen D. Heterogeneous reactions of sulfur dioxide on dust. Science in China Series B-Chemistry 49, 273–280, 10.1007/s11426-006-0273-0 (2006). [DOI] [Google Scholar]
- Usher C. R., Al-Hosney H., Carlos-Cuellar S. & Grassian V. H. A laboratory study of the heterogeneous uptake and oxidation of sulfur dioxide on mineral dust particles. Journal of Geophysical Research-Atmospheres 107, 471310.1029/2002jd002051 (2002). [Google Scholar]
- Backes A. M., Aulinger A., Bieser J., Matthias V. & Quante M. Ammonia emissions in Europe, part II: How ammonia emission abatement strategies affect secondary aerosols. Atmospheric Environment 126, 153–161, 10.1016/j.atmosenv.2015.11.039 (2016). [DOI] [Google Scholar]
- Han X., Zhang M. G., Zhu L. Y. & Skorokhod A. Assessment of the impact of emissions reductions on air quality over North China Plain. Atmospheric Pollution Research 7, 249–259, 10.1016/j.apr.2015.09.009 (2016). [DOI] [Google Scholar]
- Sharma S., Chatani S., Mahtta R., Goel A. & Kumar A. Sensitivity analysis of ground level ozone in India using WRF-CMAQ models. Atmospheric Environment 131, 29–40, 10.1016/j.atmosenv.2016.01.036 (2016). [DOI] [Google Scholar]
- Fu X. et al. Source, transport and impacts of a heavy dust event in the Yangtze River Delta, China, in 2011. Atmospheric Chemistry and Physics 14, 1239–1254, 10.5194/acp-14-1239-2014 (2014). [DOI] [Google Scholar]
- Lai S. et al. Characterization of PM2.5 and the major chemical components during a 1-year campaign in rural Guangzhou, Southern China. Atmospheric Research 167, 208–215, 10.1016/j.atmosres.2015.08.007 (2016). [DOI] [Google Scholar]
- Wang H. L. et al. Chemical composition of PM2.5 and meteorological impact among three years in urban Shanghai, China. Journal of Cleaner Production 112, 1302–1311, 10.1016/j.jclepro.2015.04.099 (2016). [DOI] [Google Scholar]
- Wang X. et al. The secondary formation of inorganic aerosols in the droplet mode through heterogeneous aqueous reactions under haze conditions. Atmospheric Environment 63, 68–76, 10.1016/j.atmosenv.2012.09.029 (2012). [DOI] [Google Scholar]
- He H. et al. Mineral dust and NOx promote the conversion of SO2 to sulfate in heavy pollution days. Scientific Reports 4, 10.1038/srep04172 (2014). [DOI] [PMC free article] [PubMed] [Google Scholar]
- Cao C. et al. Inhalable Microorganisms in Beijing’s PM2.5 and PM10 Pollutants during a Severe Smog Event. Environmental Science & Technology 48, 1499–1507, 10.1021/es4048472 (2014). [DOI] [PMC free article] [PubMed] [Google Scholar]
- Wei C. Modeling the effects of heterogeneous reactions on atmospheric chemistry and aerosol properties Doctor thesis, University of Iowa, (2010).
- .Wang J. D. et al. Impact of aerosol-meteorology interactions on fine particle pollution during China’s severe haze episode in January 2013. Environmental Research Letters 9, 10.1088/1748-9326/9/9/094002 (2014). [DOI] [Google Scholar]
- Sun Y. et al. The impact of relative humidity on aerosol composition and evolution processes during wintertime in Beijing, China. Atmospheric Environment 77, 927–934, 10.1016/j.atmosenv.2013.06.019 (2013). [DOI] [Google Scholar]
- Crowley J. N. et al. Evaluated kinetic and photochemical data for atmospheric chemistry: Volume V - heterogeneous reactions on solid substrates. Atmospheric Chemistry and Physics 10, 9059–9223, 10.5194/acp-10-9059-2010 (2010). [DOI] [Google Scholar]
- Zhao B. et al. Impact of national NOx and SO2 control policies on particulate matter pollution in China. Atmospheric Environment 77, 453–463, 10.1016/j.atmosenv.2013.05.012 (2013). [DOI] [Google Scholar]
- Fu X. et al. Estimating NH3 emissions from agricultural fertilizer application in China using the bi-directional CMAQ model coupled to an agro-ecosystem model. Atmospheric Chemistry and Physics 15, 6637–6649, 10.5194/acp-15-6637-2015 (2015). [DOI] [Google Scholar]
- Guenther A. et al. Estimates of global terrestrial isoprene emissions using MEGAN (Model of Emissions of Gases and Aerosols from Nature). Atmospheric Chemistry and Physics 6, 3181–3210 (2006). [Google Scholar]
Associated Data
This section collects any data citations, data availability statements, or supplementary materials included in this article.


