

Abstract
We assessed the performance of a cadmium zinc telluride (CZT)-based Medipix3RX x-ray detector as a candidate for micro-computed tomography (micro-CT) imaging. This technology was developed at CERN for the Large Hadron Collider. It features an array of 128 by 128, 110 micrometer square pixels, each with eight simultaneous threshold counters, five of which utilize real-time charge summing, significantly reducing the charge sharing between contiguous pixels. Pixel response curves were created by imaging a range of x-ray intensities by varying x-ray tube current and by varying the exposure time with fixed x-ray current. Photon energy-related assessments were made by flooding the detector with the tin foil filtered emission of an I-125 radioisotope brachytherapy seed and sweeping the energy threshold of each of the four charge-summed counters of each pixel in 1 keV steps. Long term stability assessments were made by repeating exposures over the course of one hour. The high properly-functioning pixel yield (99%), long term stability (linear regression of whole-chip response over one hour of acquisitions: y = −0.0038x + 2284; standard deviation: 3.7 counts) and energy resolution (2.5 keV FWHM (single pixel), 3.7 keV FWHM across the full image) make this device suitable for spectral micro-CT. The charge summing performance effectively reduced the measurement corruption caused by charge sharing which, when unaccounted for, shifts the photon energy assignment to lower energies, degrading both count and energy accuracy. Effective charge summing greatly improves the potential for calibrated, energy-specific material decomposition and K edge difference imaging approaches.
Keywords: CZT-based spectral micro-CT, x-ray microtomography, photon counting, Medipix, charge sharing
1. INTRODUCTION
The recent availability of functioning CZT-based spectral x-ray detectors with effective charge summing capabilities presents enhanced opportunities for spectral micro-CT imaging. The transition from silicon to a CZT-based detection layer significantly extends the upper limit of the x-ray energy operating range. This extended operating range encompasses the K absorption edges of several contrast enhancement materials of interest including iodine, barium, gadolinium and gold. There is work underway to explore these materials for new and enhanced contrast materials.1 Functional charge summing, introduced in the Medipix3RX reduces the count and energy measurement corruption that occurs due to charge sharing between adjacent pixels.2,3 This document reports our evaluation of a CZT-based Medipix3RX x-ray detector. Each pixel’s response to a range of x-ray intensities and acquisition exposure times is explored. Energy resolution and long term stability are also evaluated.
The perfect detector for spectral computed tomography applications would have all pixels operating with no pixel-to-pixel variation in sensitivity. All pixels would have perfect energy resolution. X-ray beams of any intensity would be properly quantified. Repeated measurements would yield identical results. Pixel sizes would be dynamically programmable. While devices have greatly improved in recent years, they have not yet achieved these ideals. The question then becomes for what are they good enough? Based on the results of this study we believe the performance of this device makes it an excellent candidate for implementation in spectral micro-CT equipment. We look forward to the developments in the field that will be made possible as devices of this caliber are implemented and their use becomes widespread.
2. METHODS
The assessments undertaken for this report required a range of configurations and methods. The pixel response measurements utilized an x-ray tube source with both varying x-ray current settings applied to the x-ray tube and varying exposure time settings applied to the detector. Photon counting spectral detectors are generally limited in the frequency with which subsequent events can occur and still be properly measured. This is due to the time required for ‘processing’ each event. When events occur with insufficient time between them for processing, a phenomenon called pulse-pileup occurs. This corrupts the measurement device’s linearity as two or more events are counted as one event or in some cases the ‘too-close’ events are ignored. Pulse-pileup probability increases when the count rate of incident events increases. Measures to maintain the count rate in an appropriate operating range for the device must be employed. Modifying the x-ray current and/or the x-ray-to-detector distance are common methods for establishing and maintaining proper count rates. In this evaluation two methods of assessing the pixels’ response to x-ray were performed. In one set of pixel response measurements, the exposure time is fixed and the x-ray current is varied to evaluate the response to varying x-ray intensity. The maximum x-ray current was set such that the resulting count rate at the detector corresponded to the manufacturer’s recommended maximum. This test is sensitive to the pulse pileup phenomena as x-ray intensity increases. In the second set of pixel response measurements the x-ray current is set to achieve a count rate of about one-half of the manufactured recommended maximum. The detector exposure time is then incremented across a range from the minimum exposure time setting to the setting where the signal reaches the maximum count limit of the detector pixel. In this way, the device is operating over the entire counter range without the influence varying pulse pileup. For the long term stability testing, multiple images of the x-ray source were acquired over the course of about 1 hour. The energy resolution assessment utilized a tin-filtered Iodine-125 brachytherapy seed with varying energy threshold settings applied to the detector.
2.1 Bad pixel mask determination
Some pixels in the detector do not respond to input signals properly. These pixels are identified and their spatial location in the images is defined by a bad pixel mask. This mask can be applied as a screening tool to subsequent images to remove the bad pixels. Pixels that are unresponsive or respond improperly are identified as bad pixels.
2.1.1 Equipment and setup
The bad pixel mask is generated by an automated process on the MARS scanner.
2.1.2 Measurement technique
The x-ray source and detector are allowed to warm up and stabilize. Images are acquired with no x-ray and then with x-ray applied with the beam open. Bad pixels are identified and the mask is created. Unique masks are created to match scanning protocols when differences in the protocols change the x-ray illumination levels (source to detector distance, area of scan field or x-ray current) or energy thresholds. Masks expire at regular intervals to ensure that any drift in the source or detector is accommodated.
2.2 Pixel response evaluation 1 – varying x-ray current, fixed exposure time
In this evaluation images are acquired at incrementally increasing x-ray tube current settings. With each increase of current, the photon arrival rate per pixel increases. This challenges the pixel’s ability to linearly respond to increasing counting rates. When the arrival rate exceeds the pixel’s ability to properly register each event, pulse pileup occurs. The pixel’s normally linear response to increasing signal input begins to deviate from linear. Pileup can cause incorrect measurement of the incident signal because simultaneous or close thereto events are not counted at all, or are only counted as one. Pileup can also cause an error in the allocation of the events to the proper energy threshold; multiple events processed as one may have their energies summed, resulting in misallocation. It is not possible to totally eliminate the chance that two photons will arrive simultaneously. It is possible to greatly reduce the likelihood by restricting operating conditions to levels that the device can accommodate. The photon arrival rate is controlled by proper setting of the x-ray source current, proper adjustment of the distance between the x-ray source and the detector, or both. Pulse pileup can be assessed by increasing the arrival rate of photons and observing the device’s response. The device’s normal linear response will plateau when significant pileup begins to occur.
2.2.1 Equipment and setup
The x-ray source for this set of measurements was a Comet x-ray tube with a tungsten target operated at 120kVp, over a range from 0.1 to 0.9 mA with 15.4 mm Al filtering at the exit port. The source-to-detector distance was approximately 1200 mm. The detector was the MARS Biomedical CZT-based Medipix3RX. All detector thresholds were set to 15 keV. Pulse pileup behavior for this device was assessed by determining the range of x-ray current settings which would result in photon arrival rates below 10 counts/mS/pixel (the vendor’s maximum recommended count rate). The images were open-beam exposures.
2.2.2 Measurement technique
A 10 minute camera warmup was performed from startup to allow the camera to stabilize. The x-ray current was set to 0.9 mA, the point where the detector count rate approached 10 counts/mS/pixel. The detector exposure time was set to 100mS, resulting in counts per exposure of approximately 1000 counts per pixel for the maximum arrival rate condition. 400 images were acquired at each setting of x-ray current from 0.1 mA to 0.9 mA with 0.1 mA increments.
2.3 Pixel response evaluation 2 – varying exposure time, fixed x-ray current
This section explores the response of the detector to fixed amplitude x-ray with varying exposure times over the usable range of the threshold counters (0 to 4095). Each pixel’s measurement of the incident x-ray over the varying range of exposure times will generate a response curve reflecting the pixel’s behavior and range of linear operation. Pixels may respond properly, exhibit no response or exhibit an improper response. Improper and non-responsive pixels can be accommodated as long as they are limited in number.
2.3.1 Equipment and setup
The x-ray source for this set of measurements was a Comet x-ray tube with a tungsten target operated at 120kVp 0.2mA with 2.5 mm Al filtering at the exit port. The source-to-detector distance was approximately 1200 mm. The detector was the MARS Biomedical CZT-based Medipix3RX. The detector thresholds were set at 15, 25, 35, 45, 55, 65 and 75 keV. The images were open-beam exposures.
2.3.2 Measurement technique
A 10 minute camera warmup was performed from startup to allow the camera to stabilize. The x-ray current was set to generate an average count rate of 3.9 counts/mS/pixel. Following the warmup 400 frames were acquired at each exposure time setting. Exposure time settings were 1, 2, 4, 8, 16, 32, 64, 128, 256, 384, 512, 640 and 768 mS.
2.4 Long Term Stability
The long term stability assessment is basically a repeatability test. Repeated images with the same source and detector setting were acquired over the course of one hour. Ideally there would be no difference between the measurements. This is critical for CT applications, as many images are required to create the tomographic reconstruction. The mathematical processes involved require consistent performance of the radiation source as well as the detector. Furthermore in some CT applications such as continuous-rotation, helical, and/or in-vivo studies it is difficult or impossible to reacquire corrupt projection images even if they can easily be detected in real time.
2.4.1 Equipment and setup
The x-ray source for this set of measurements was a Comet x-ray tube with a tungsten target operated at 120kVp 0.2mA with 2.5 mm Al filtering at the exit port. The source-to-detector distance was approximately 1200 mm. The detector was the MARS Biomedical CZT-based Medipix3RX. The detector thresholds were set at 20, 30, 40, 50, 61, 71 and 81 keV. These setup conditions resulted in an average count rate of 4.56 counts/mS/pixel. The exposure time for each image was 500 mS with the image-repeat period set to 3.6 seconds. The images were open-beam exposures.
2.4.2 Measurement technique
No specific camera warmup was performed as this test was intended to explore changes in the camera response over time. The camera had been powered up for about 18 minutes before the first set of images were collected. The x-ray source was energized and allowed to stabilize. 1000 frames over the course of 1 hour were acquired.
2.5 Photon energy resolution
The photon energy content of the incident radiation on Medipix-based detectors is derived by processing the counts accumulated in each of the 8 energy threshold counters in each pixel. Each of the 8 counters has a threshold associated with it. A photon event at the detector is processed into an electronic pulse. The height of the pulse is proportional to the energy of the photon that generated the pulse. If the pulse height exceeds the threshold for a given counter, that counter is incremented. At the end of an exposure sequence, each counter contains the sum of all of the counts that exceeded its threshold. The counters are read out and provide a measure of the number of events that occurred in each pixel that exceeded each of the counter’s associated threshold values. The setting for each of the 8 thresholds for each pixel is set globally for the whole detector. Each event that occurs is observed simultaneously by all 8 thresholds. Threshold results can be processed to yield ‘energy bin’ results by subtracting one threshold measurement from another. Each energy bin contains the count of the number of photons that were between the two thresholds that were employed to generate the bin. The preceding description is accurate only in the case where each photon generates a pulse in only one pixel. In reality many photons fall on or near pixel boundaries. When this occurs, the charge generated from the event is shared between two or more pixels. Thus multiple pixels register the single event, none with the proper energy. This corrupts the counting and the energy measurement accuracy. What was one event registers as two or more events of lower energy. This phenomenon is referred to as charge sharing and is responsible for the ‘low energy tail’ that appears on energy response plots of monochromatic sources. The latest version of the Medipix device has implemented a remedy to charge sharing referred to as charge summing. Charge summing detects shared events, sums their pulse height and the appropriate counters are incremented in only one of the pixels. Thus proper energy thresholding and event counting is restored. Charge summing is available on the lower 4 thresholds on this Medipix3RX device. For this reason, only the lower 4 thresholds were utilized in this evaluation.
2.5.1 Equipment and setup
The photon source for the energy resolution assessment was an Iodine-125 brachytherapy seed. Iodine-125 sources produce photons primarily at 27.4726, 27.202, 31.236, 31.774 and 35.4922 keV.4 The majority of photons are at the two narrowly separated 27 keV energies. A tin foil (K-edge 29.2keV) filter, 0.4 mm thick, was placed between the source and detector to preferentially attenuate the 31 and 35 keV components. The distance from the source to the detector was approximately 21 mm. The activity of the source was approximately 2.38 mCi. The detector exposure time was set to 4 seconds. The energy threshold set to 20 keV resulted in an average signal of 10.95 counts per pixel per exposure. (0.0025 counts/mS/pixel)
2.5.2 Measurement technique
Measurements were made by stepping the energy threshold over the energy range of 20 to 36 keV to cover the expected emission from the Iodine-125. The increment between measurements was 1 keV. All eight thresholds for each pixel were set to the same value for each measurement. One hundred exposures were acquired at each energy threshold setting.
3. RESULTS
The results of this assessment will determine whether this detector is suitable for spectral micro-CT applications. An overall evaluation of the number of properly operating pixels will determine if the device has adequate physical coverage to be utilized for CT. Pulse pileup results will determine how fast the imager can create spectral images. Linearity results will determine how many calibration points will be required to get adequate accuracy in the signal level measurement. The long term stability assessment will determine if the device is sufficiently stable to provide the repeatability required for the multitude of images necessary for computed tomography. Unless otherwise noted, both properly functioning and non-functioning pixels are included in the figures below for completeness. In actual application, only the properly functioning pixels would be utilized for measurements.
3.1 Overall properly functioning pixels
Properly functioning pixels in a detector are those which respond linearly and consistently to the input signal. In this device, 16193 out of 16384 (98.7 %) pixels were properly functioning. (Figure 1) This detector is a good candidate for additional testing and potential implementation because of its high percentage of properly functioning pixels.
Figure 1.

The left panel displays a typical open-beam image from this detector. The right panel shows the bad-pixel map. Bad pixels in this mask were identified as pixels with no counts, extreme counts, high variance or unstable counts (counts vary beyond the expected noise range in the source from frame to frame with stable illumination).
3.2 Pulse pileup
Pulse pileup is indicated when a pixel’s response to increasing count rate conditions deviates from linear due to the inability to process additional photons as the count rate increases. In this case, for count rates up to about 10 counts/mS/pixel (the manufacturer’s recommended maximum), this device exhibits no apparent pulse pileup. (Figure 2) Operation above the manufacturer’s recommended maximum count rate was not pursued hence the count rate at which the device would exhibit pulse pileup was not attained in this assessment.
Figure 2.

Investigation for evidence of pulse pileup. The left panel shows the response of all of the pixels to increasing x-ray current. For improved clarity, the middle panel shows a subset of 34 pixels. The right panel shows one representative pixel along with its linear curve fit. No evidence of pulse pileup is apparent.
3.3 Linearity
The functioning pixels of this detector exhibit very linear response over the operating range of the counters, 0 to 4095. (Figure 3) There is a spread in the gain between pixels, but those differences can be accommodated by applying flatfield correction. The only caveat for proper flatfield correction is that the exposure time must be set to ensure that the highest-gain ‘functional’ pixel is not forced beyond its linear range maximum in the open beam condition.
Figure 3.
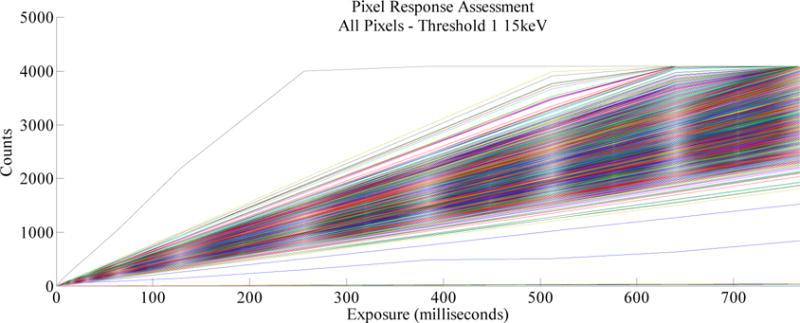
The properly functioning pixels exhibit the desired linear response in this plot of each pixel’s response as exposure time increased over a range from 1 to 768 mS. Excluding the one high-gain outlier (top trace), an exposure time of 500mS would allow the maximum number of useable pixels in their linear ranges. Lower gain, non-linear and non-responsive pixels would be excluded.
3.4 Long term stability
The functional pixels in this detector show excellent stability over the course of one hour of continuous acquisitions. (Figure 4) The functional pixels form the closely grouped horizontal band in the figure. Close inspection reveals some vertical widening of the band at the beginning of the acquisitions. The width of the band stabilizes after 2 to 3 minutes. This can be attributed to the normal expected drift during the detector warmup period. The slope of a linear fit to the average response of the whole detector over 60 minutes was −0.0038. The standard deviation of that dataset was 3.7 counts; the average value was 2282 counts.
Figure 4.

Functional pixels show a narrow band of very stable measurements over the course of one hour. The plots outside the concentrated band of functioning pixels represent the non-functioning pixels that would be eliminated from consideration by applying the bad-pixel mask.
3.5 Energy resolution
The measurement of the 27.4 keV peak of the tin-filtered Iodine-125 radiation shows a spread of the detected energy of 3.7 keV (FWHM) when the responses of all of the pixels are averaged. The spread of the detected energy of a representative pixel is 2.5 keV (FWHM). Both measurements show peaks in good agreement with the peak emission of the filtered I-125 radiation of 27.4 keV. (Figure 5) While there is some signal on the lower energy side of the peaks of some of the pixels, the charge summing greatly reduces the amplitude of the charge sharing contamination.
Figure 5.

Left panel shows the response (sum of 100 images) of all the pixels over the energy range from 20 to 35 keV while the detector was being flooded with the radiation from the Iodine-125 seed, filtered with 0.4 mm of tin. The middle panel shows the plot with all of the pixels averaged. The right panel shows the plot of a single pixel’s response.
4. CONCLUSION
This device is the first Medipix3RX we have tested. The performance of this detector is excellent in each of the categories evaluated. Only 1.3% of its pixels are non-functioning. The device is very linear across the functioning pixels. The energy resolution is excellent on the pixel level, 2.5 keV FWHM and only 1.2 keV broader across the whole device. The device is stable over the times required for typical micro-CT acquisitions. The charge summing effectively reduces the charge sharing that would otherwise corrupt the count and energy measurements. We are excited to apply this device in our spectral micro-CT applications and to utilize it to explore the opportunities that spectral imaging provides.
Acknowledgments
This research was supported in part by NIH Grant, EB016966.
APPENDICIES
This appendix contains supplemental details about the MARS Scanner, the x-ray source used for this evaluation and the detector.
3.1 MARS scanner
The MARS scanner is an early prototype predecessor to the currently available commercial model.
3.1.1 MARS scanner X-ray source
Manufacturer: Source-Ray, Inc. 50 Fleetwood Ct, Ronkonkoma, NY USA 11779
Model: SB-80-1K
Tube Model Number: 90507 (Oxford Instruments)
SN: 59977
5.2 X-ray source used for testing
5.2.1 X-ray Tube
Manufacturer: Comet Technologies USA, Inc., 100 Trap Falls Road Extension, Shelton, CT USA 06484
Model: MXR-160HP/11
Type Number: 915370.51
SN: 60-1219
5.2.2 X-ray Generator
Manufacturer: GULMAY Incorporated 480 Brogdon Road, Suite 100, Suwanee, GA
Model: CF 160-2/3
Serial Number: 0049-1011
5.3 Detector
5.3.1 Detector Manufacturer
Manufacturer: Mars Bioimaging Ltd., Christchurch, New Zealand
Model: CZT Medipix3RX V5B-RX-S1
Serial Number: 0003
5.3.2 Detector Description
This detector is an area detector, 14 by 14 mm square. The area is divided into 128 by 128 pixels. Each pixel is 110um square. Each pixel contains 8 simultaneous threshold counters. The first 5 of these counters have active charge summing. One counter is dedicated to the arbitration function and its threshold is preset by the manufacturer. The threshold settings for the remaining counters are user programmable. For the purposes of this study only the 4 charge-summed counters were evaluated.
References
- 1.Roeder R. A Spectral of Library Nanoparticle Contrast Agents for Spectral (Color) X-ray Imaging. NSF Award. 2013 Jul 14; Abstract #1309587. http://www.nsf.gov/awardsearch/showAward?AWD_ID=1309587&HistoricalAwards=false.
- 2.Hamann E, Koenig T, Zuber M, Cecilia A, Tyazhev A, Tolbanov O, Procz S, Fauler A, Baumbach T, Fiederle M. Performance of a Medipix3RX spectroscopic pixel detector with a high resistivity gallium arsenide sensor. IEEE Transactions on Medical Imaging. 2015;34(3):707–715. doi: 10.1109/TMI.2014.2317314. [DOI] [PubMed] [Google Scholar]
- 3.Ballabriga R, Alozy J, Blaj G, Campbell M, Fiederle M, Frojdh E, Heijne EHM, Llopart X, Pichotka M, Porcz S, Tlustos L, Wong W. The Medipix3RX: a high resolution, zero dead-time pixel detector readout chip allowing spectroscopic imaging. Proc Journal of Instrumentation – IOP Science. 2013;8:C02016. [Google Scholar]
- 4.Chiste V, et al. Table of Radionuclides (Vol. 6–A =22to242) Edite par le BIPM, Sevres. 2011:37–41. ( http://www.nucleide.org/DDEP_WG/Nuclides/I-125_tables.pdf)