

Abstract
Background & objectives:
Insidious symptomatology, late clinical presentation and poor prognosis of oesophageal cancer (EC) highlight the pressing need for novel non-invasive biomarkers for early tumour diagnosis and better prognosis. The present study was carried out to evaluate the clinical significance of circulating and tissue miR-144 expression in oesophageal cancer.
Methods:
Clinical significance of miR-144 expression was evaluated in preneoplastic (12) and neoplastic (35) oesophageal cancer tissues as well as matched distant non-malignant tissues using real-time PCR (qPCR). Circulating levels of miR-144 were also analyzed in serum samples of EC patients as well as normal individuals to determine the diagnostic potential of miR-144. Further, targets of miR-144 were predicted using bioinformatic tools and their gene ontology (GO) terms were assigned.
Results:
Real-time PCR analysis revealed significant upregulation of miR-144 in 29 of 35 (83%) EC tissues as compared to matched distant non-malignant tissues (P=0.010). All the dysplastic tissues showed upregulation of miR-144 as compared to their matched distant non-malignant tissues. Relative levels of circulating miR-144 in serum significantly distinguished EC patients from normal controls (P=0.015; AUC = 0.731) with high sensitivity of 94.7 per cent. Bioinformatically predicted target, PUR-aplha (PURA) was found to be significantly (P=0.018) downregulated in 81 per cent (26/32) EC patients and its expression was found to be significantly and negatively correlated with miR-144 expression at mRNA level.
Interpretation & conclusions:
Our findings showed significant upregulation of miR-144 in serum samples of EC patients indicating its potential as minimally invasive marker. Further studies need to be done to understand the role of miR-144 in the pathogenesis of EC.
Keywords: Circulating miRNA, diagnostic potential, oesophageal cancer, PUR-alpha, real-time PCR, SPRED1
Oesophageal cancer (EC) is the eighth most common cancer and the sixth most common cause of death from cancer worldwide1. In India the estimated number of death was 39,000 and five year prevalence was 22,000 in 20121. The incidence rate of EC in India in men is approximately double those in women (male:female ratio 1.8:1)1. At early stages, oesophageal cancer tends to be asymptomatic in nature resulting in late clinical presentation and poor prognosis.
In spite of improvements in diagnostic and therapeutic modalities, the five year survival rate of this disease remains 17-23 per cent2,3, mainly due to lack of sensitive, specific and reproducible markers for early diagnosis and better monitoring of the disease. Hence, it is imperative to discover novel non-invasive or minimally-invasive biomarkers for early detection of oesophageal cancer.
Micro RNAs (miRNAs) are being extensively analyzed for their diagnostic as well as therapeutic potential in various diseases4,5. Circulating miRNAs have been found to show aberrant expression in cancers6,7. In addition to their altered expression in tissues, miRNAs are highly stable, readily detectable and easy to access in body fluids making them good targets for minimally/non invasive detection of cancer8,9.
Altered expression of miR-144 has been reported in cancers viz. nasopharyngeal carcinoma10 rectal cancer11, chronic myeloid leukaemia12 and gastric carcinoma13. Overexpression of miR-144 in cancer may be due to gene amplification as it is located on chromosome 17q11.2, a region reported to be amplified in oesophageal adenocarcinoma14 and nasopharyngeal carcinoma15. Guo et al16 have shown upregulation of miR-144 in oesophageal cancer tissues using microarray. In another study, Yang et al17 demonstrated significant upregulation of miR-144 in oesophageal cancer using microarray, but their quantitative reverse transcriptase PCR results for validation of microarray data were not significant. Xie et al18 demonstrated significant upregulation of miR-144 in saliva of oesophageal cancer patients. However, none of these studies have analyzed the expression of miR-144 in preneoplastic oesophageal tissues to explore its potential as an early diagnostic marker. Moreover, expression of miR-144 in serum samples of oesophageal cancer patients has not been analyzed yet.
Thus keeping in view the limited information of miR-144 in oesophageal cancer, the aim of the present study was to determine the clinical significance of miR-144 in oesophageal cancer tissues and explore its potential as minimally invasive diagnostic marker by analyzing its expression in serum of EC patients and healthy subjects. Further, in silico tools were used to identify novel targets of miR-144.
Material & Methods
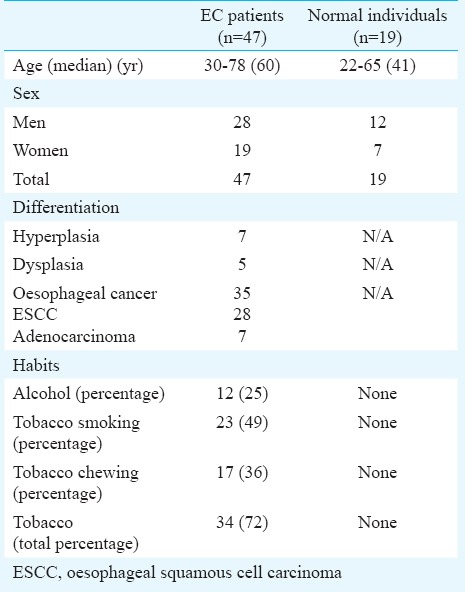
Forty seven endoscopically resected tumours and matched distant non-malignant oesophageal tissue biopsy specimens (obtained from a region at least 8 cm away from the tumour) were collected at the department of Gastroenterology, All India Institute of Medical Sciences, New Delhi, India, from July 2010 to January 2013. All biopsy specimens were diagnosed and verified by histopathological analysis. The tumours were histopathologically graded as preneoplastic (n=12) and neoplastic (n=35). Of the 12 preneoplastic tissues, seven were hyperplastic and five showed evidence of dysplasia. After collection, the samples were immediately snap frozen in liquid nitrogen and stored at -80°C. Patients demographic, clinical and pathological data including age, gender, alcohol consumption, tobacco and histological differentiation were recorded in a predesigned proforma (Table I). Of the 47 patients, blood samples were collected from 19 patients whose tumours were analysed for the expression of miR-144. Blood samples were also collected from 19 age and gender matched normal healthy individuals. The serum was separated and stored at -80°C till further use. This study was approved by the institutional human ethics committee prior to its commencement and an informed written consent was obtained from each patient.
Table I.
Clinicopathological characteristics of patients with oesophageal cancer (EC) and normal individuals
RNA extraction and first strand complementary DNA (cDNA) synthesis: RNA from EC and matched non-malignant tissues was isolated using PAXgene Tissue miRNA Kit (Qiagen, Copenhagen, Denmark), while total RNA from serum of patients and healthy individuals was extracted using QIAamp Viral RNA Mini Kit (Qiagen, Copenhagen, Denmark) as described previously19. First strand cDNA was synthesized from DNA free total RNA using universal cDNA synthesis kit (Exiqon A/S, Vedbaek, Denmark), following the method described elsewhere19.
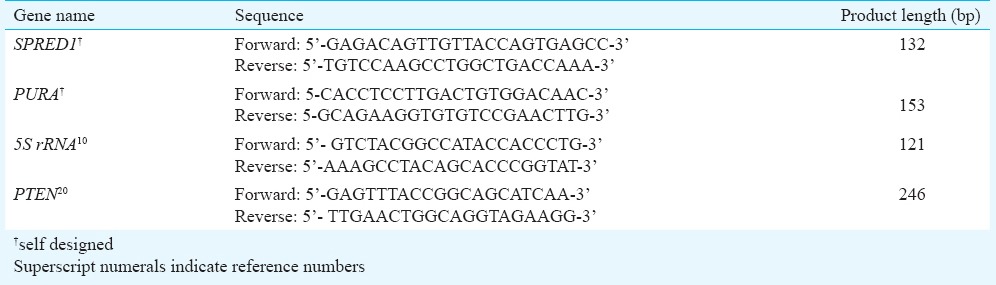
Quantitative real time PCR (qPCR): miR-144 expression analysis was carried out using LNA™ (locked nucleic acid) forward and reverse primers (Exiqon A/S, Vedbaek, Denmark; http://www.exiqon.com/ls/_layouts/DownloadHttpHandler/Download.ashx?dUrl=http://coreone-prod/shop/excel-downloader-for-qpcr-or-unirt.jsp?type=unirt) and SYBR Green master mix (Exiqon A/S, Vedbaek, Denmark) on Opticon2 Real time PCR system (Biorad, USA) using a protocol described previously19. Primers for PURA and SPRED1 were designed using NCBI Primer-Blast tool, whereas primers for PTEN and 5S ribosomal RNA (5S rRNA) were taken from previous studies10,20. qPCR of PURA, SPRED1 and PTEN was carried out using gene specific primers (Table II) and KAPA SYBR fast real time PCR kit (Kapa Biosystems, Boston Massachusettes, US) following manufacturer's protocol.
Table II.
Primers used for qPCR analysis
5S rRNA was used as an internal control to evaluate the levels of miR-144 and its target by qPCR. For validating 5S rRNA as an internal control, the concentration of RNA was determined and a variable Vi was calculated, where Vi = SampleiCon/50-SampleiCt5s18. A stable value of Vi indicated that the expression level of 5S rRNA remained stable and it could be used as an internal control. The cycle threshold (Ct) was recorded for each sample. 2-ΔΔCT method was used to calculate the fold change (where ΔCt = (Ct miRNA – Ct 5s) and ΔΔCt = ΔCt tumour tissue -ΔCt distant non-malignant tissue) and histogram was drawn using Livak's method21 to represent fold change in expression of circulating miR-144 in representative EC patients as compared to matched healthy controls. Melting curve analysis22 was used for qPCR amplification products and confirmed by agarose gel electrophoresis.
Statistical analysis: Population distributions of EC and normal samples were determined using Shapiro-Wilk test and populations having P>0.05 were considered normally distributed. Differences between groups (EC and normal) were evaluated using Student's t test and Mann-Whitney U test. Point-biserial correlation was used to analyze the correlation between miR-144 expression (ΔCt) and tumour status (oesophageal cancer samples were taken as 1 to represent presence of tumour and non-malignant tissues were taken as 0 to represent absence of tumor). All calculations were carried out using SPSS software 13.0 (SPSS Inc, Chicago, IL, USA). The receiver operating characteristic (ROC) curve was used to assess the diagnostic accuracy and area under the ROC curve (AUC) was determined. The correlation between miR-144 expression and mRNA levels of target genes i.e., PURA, SPRED1 and PTEN was analyzed using Pearson correlation test.
Target prediction and gene ontology (GO) terms determination: The miRGen targets interface, which provides an intersection for the four widely used target prediction tools (miRanda, TargetScanS, PicTar and DIANA-microT) was used for prediction of miR-144 targets23. Most putative targets of miR-144 were further screened by using a two way approach as described previously19. In the first approach, only targets predicted by at least three softwares were selected and their minimum free energy of hybridization (MFE) was determined using RNAhybrid. The most putative targets were further screened out on the basis of their MFE where -21 kcal/mol was taken as the cut-off. Gene ontology terms were determined for all the predicted targets using Gene Ontology Tools developed at Lewis Sigler Institute, Princeton University24 and blast2go tool25.
In the second approach, most putative targets were screened on the basis of their GO terms, number of binding sites, PCT (probability of conserved targeting), context score and MFE using TargetScan (http://www.targetscan.org/vert_71/), PicTar (http://pictar.mdc-berlin.de/) and RNAhybrid (http://bibiserv.techfak.uni-bielefeld.de/rnahybrid/) softwares.
Results
Upregulation of miR-144 in EC tissues: Expression of miR-144 was observed in preneoplastic and neoplastic oesophageal tissues and their matched distant non-malignant tissues using qPCR. For both populations, Shapiro-Wilk test confirmed significant deviation from normal distribution (P<0.05; Fig. 1a and 1b).
Fig. 1.

Panels (a) and (b) show histograms representing population distribution of oesophageal cancer (EC) tissues and matched distant non-malignant tissues. Panels (c) and (d) show histograms representing population distribution of EC patients and normal subjects based on serum samples analysis.
miR-144 was found to be significantly upregulated in 83 per cent (29/35) of oesophageal cancer patients (P=0.010). Mean ΔCt value for cancer tissue was 5.75 (standard error of mean, SEM = 0.96) and for non-malignant tissue it was 8.704 (SEM = 0.98). Fig. 2a and 2b show the relative expression of miR-144 in representative EC tissue specimens and matched distant non-malignant oesophageal tissues. miR-144 was found to be upregulated in 90 per cent (24/28) oesophageal squamous cell carcinoma (ESCC) tissues and 71 per cent (5/7) oesophageal adenocarcinoma tissues as compared to their matched distant non-malignant tissues.
Fig. 2.

Increased expression of miR-144 in oesophageal cancer (EC): (a) Histogram showing comparison of ΔCt (inverted) for miR-144 in representative EC tissues (C1-C6) and matched distant non-malignant tissues (N1-N6). High value of 1/Δct represents high miRNA expression. (b) Boxplot diagram showing differential expression of miR-144 in cancer vs matched distant non-malignant tissues. High value of 1/ΔCt represents high miRNA expression. (c) ROC curve of miR-144 for discriminating EC tissues from distant non-malignant tissues.
Since high value of ΔCt represents low miRNA expression, a significant negative correlation was found between ΔCt (r=-0.253, P=0.034) and tissue type.
Of the 12 preneoplastic tissues, 43 per cent (3/7) hyperplastic tissues and 100 per cent dysplastic (5/5) tissues showed upregulation of miR-144 as compared to their matched distant non-malignant tissues. ROC curve analysis yielded an AUC of 0.678 (95% CI: 0.552-0.805, P=0.010) (Fig. 2c).
Upregulation of miR-144 in EC serum samples: The expression of miR-144 was examined in serum samples from 19 EC patients and 19 normal individuals using qPCR. Population distribution in EC samples and normal individuals was determined, and the hypothesis that the sample population distribution follows a normal distribution/Gaussian distribution was checked by Shapiro-Wilk test (Fig. 1c and 1d). EC samples were normally distributed (P>0.05; P=0.231) whereas normal samples deviated significantly from normal distribution (P<0.05; P=0.001). As populations were not normally distributed a non-parametric test (Mann-Whitney U test) was employed to determine the difference between the two groups. miR-144 was significantly (P=0.015) upregulated in serum samples of EC patients as compared to normal controls with mean ΔCt value of 7.43 (SEM=0.561) for cancer and 11.88 (SEM=1.605) for normal subjects (Fig. 3b). Mean ΔCt value of normal samples was used for normalization to calculate the fold change in expression of circulating miR-144. Circulating miR-144 was found to be upregulated by more than two folds in 18 of 19 oesophageal cancer patients as compared to normals. Fig. 3a shows the relative expression of miR-144 in representative EC serum samples and matched normal samples. Point-biserial correlation was used to analyze the correlation between miR-144 expression (ΔCt) and serum type where oesophageal cancer serum samples were taken as 1 to represent presence of tumour and normal as 0 to represent absence of tumor. Since, high value of ΔCt represents low miRNA expression, a significant negative correlation was found between ΔCt (r=-0.399, P=0.006) and serum type. The AUC for circulating miR-144 was 0.731 (P=0.015) in terms of discriminating EC patients from normal subjects (Fig. 3c).
Fig. 3.

Increased expression of circulating miR-144: (a) Histogram showing comparison of fold change for miR-144 in representative EC patients (C1-C6) and matched healthy controls (N1-N6). (b) Boxplot showing differential expression of miR-144 in serum samples. Lower value of ΔCt represents higher miRNA expression. High value of 1/ΔCt represents high miRNA expression. (c) ROC curve of circulating miR-144 for discriminating EC patients from normal subjects.
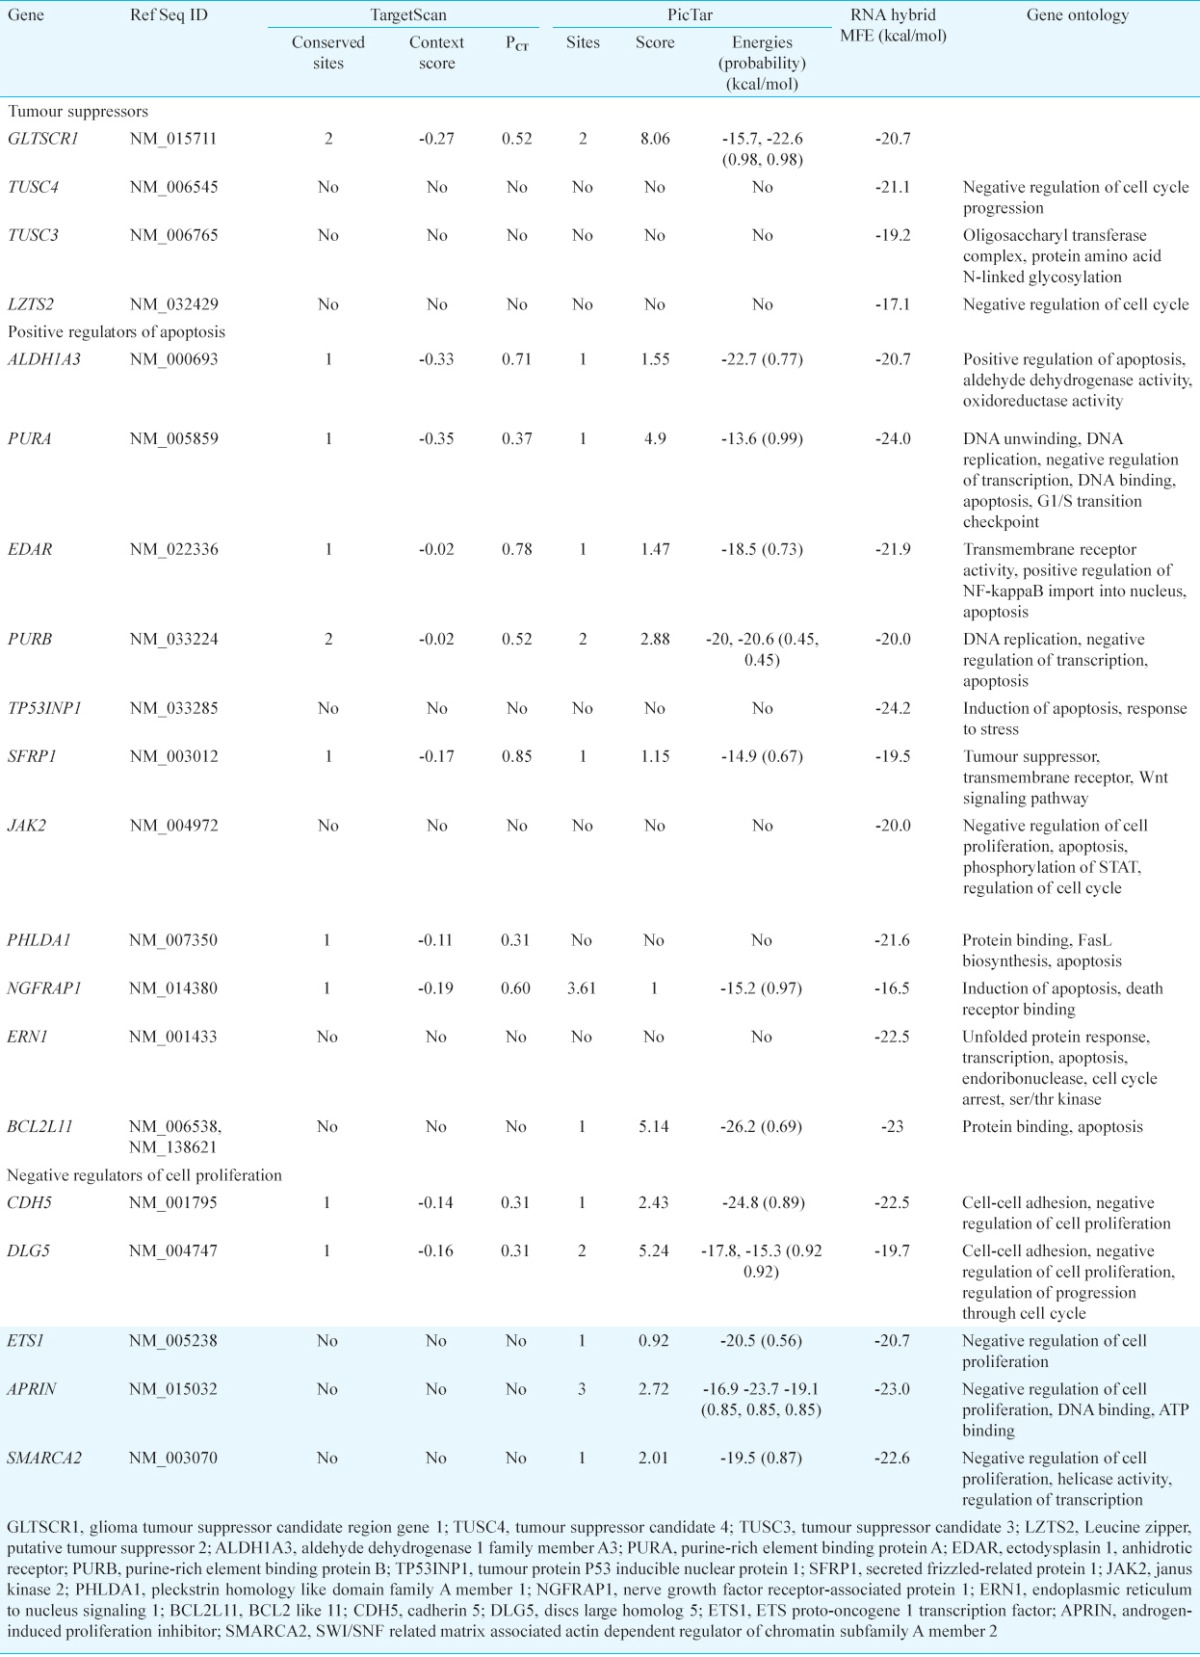
In silico target prediction and GO term determination: DIANA-miRGen was used to predict miR-144 targets, followed by target screening using a two-way approach. In the first approach, MFE was calculated using RNAhybrid for targets that were commonly predicted (~ 100) by all three prediction programmes namely miRanda, PicTar and TargetScanS. SPRED1 (sprouty-related, EVH1 domain containing 1; MFE = -25.2 kcal/mol), NR2F2 (nuclear receptor subfamily 2, group F, member 2; MFE = -24.4 kcal/mol) and FBXL3 (F-box and leucine-rich repeat protein 3; MFE = -24.2 kcal/mol) were found to be the most putative targets of miR-144 (Table III). In the second approach targets were screened for three GO terms viz. tumour suppressor, positive regulator of apoptosis/apoptosis and negative regulator of cell proliferation. Most putative targets were selected by determining context scores, number of conserved sites and MFE by using PicTar, TargetScanS and RNAhybrid. On the basis of these parameters, most putative target found for tumour suppressor term was GLTSCR1 (glioma tumour suppressor candidate region gene 1), for positive regulator of apoptosis targets were PURA (purine-rich element binding protein A) and ALDH1A3 (aldehyde dehydrogenase 1 family, member A3). For negative regulator of cell proliferation, CDH5 (cadherin 5, type 2, vascular endothelium) and DLG5 [discs, large homolog 5 (Drosophila)] were the most potential targets (Table IV).
Table III.
Potential targets for miR-144 taking -22 Kcal/mol as cut-off for minimum free energy of hybridization (MFE) (by first approach)
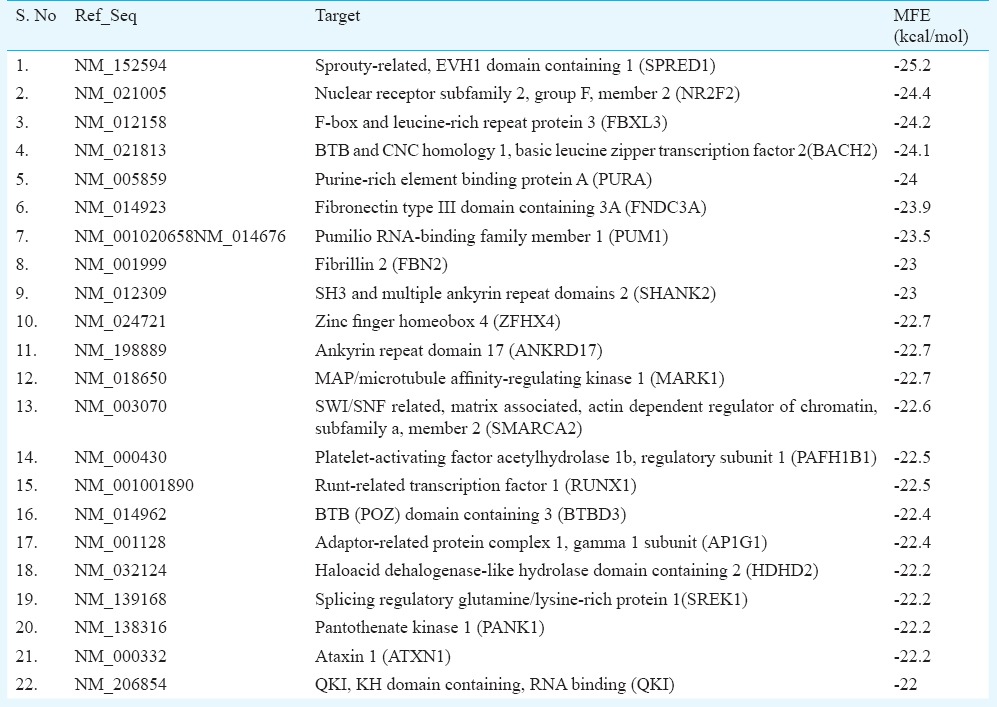
Table IV.
Potential targets of miR-144 as predicted by second approach
Downregulation of PURA in EC tissues: Expression of PURA was analysed in 43 oesophageal cancer tissues (32 neoplastic and 11 preneoplastic) and their matched distant non-malignant tissues using qPCR. EC samples were normally distributed (P=0.443) but for population of non-malignant tissues, Shapiro-Wilk test confirmed significant deviation from normal distribution (P=0.004; Fig. 4a and b). PURA was found to be significantly downregulated in 81 per cent (26/32) of oesophageal cancer patients (P=0.018). Mean ΔCt value for cancer tissue was 13.89 (SEM=0.801) and for non-malignant tissue it was 10.66 (SEM=1.097). Fig. 5a shows the relative expression of PURA in representative oesophageal cancer tissue specimens and matched distant non-malignant oesophageal tissues. Out of eleven preneoplastic tissues, it was found to be downregulated in 43 per cent (3/7) hyperplastic and 75 per cent (3/4) dysplastic tissues as compared to their matched distant non-malignant tissues. ROC curve analysis yielded an AUC of 0.672 (95% CI: 0.539-0.805, P=0.018) (Fig. 5b).
Fig. 4.

Panels (a) and (b) show histograms representing population distribution of PURA ΔCt for EC tissues and matched distant non-malignant tissues. Panels (c) and (d) show histograms representing population distribution of SPRED1 ΔCt for EC patients and normal subjects.
Fig. 5.
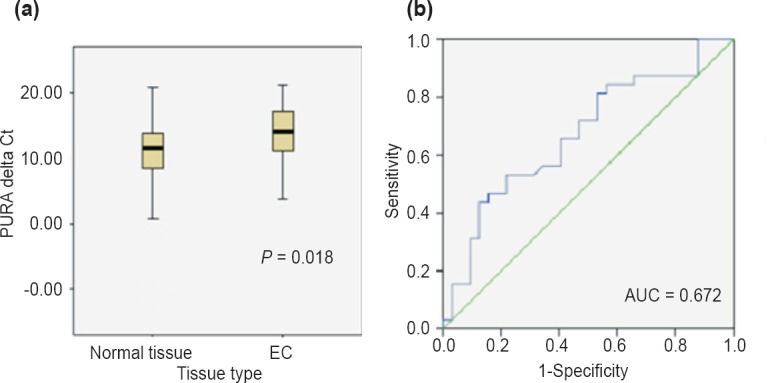
(a). Boxplot diagram showing differential expression of PURA in cancer vs matched distant non-malignant tissues. (b) ROC curve of PURA for discriminating EC tissues from distant non-malignant tissues.
Downregulation of SPRED1 in EC tissues: Expression of SPRED1 was analysed in 43 oesophageal cancer tissues (32 neoplastic and 11 preneoplastic) and their matched distant non-malignant tissues. Population of EC tissues was normally distributed (P=0.450), however, for non-malignant tissue samples, Shapiro-Wilk test confirmed significant deviation from normal distribution (P=0.001) (Fig. 4c and d). SPRED1 was found to be downregulated in 69 per cent (22/32) of oesophageal cancer patients, however, the downregulation was not significant (P=0.177). Mean ΔCt value for cancer tissue was 13.88 (SEM=0.778) and for non-malignant tissue it was 11.82 (SEM=1.079). Of the 11 preneoplastic tissues, it was found to be downregulated in 57 per cent (4/7) hyperplastic and 75 per cent (3/4) dysplastic tissues as compared to their matched distant non-malignant tissues.
Correlation between miR-144 and target genes: RNAhybrid and PicTar were used to locate miR-144 binding sites in 3’UTR region of PURA (Fig. 6a). Correlation between miR-144 and its putative targets (PURA amd SPRED1) was analysed using pearson correlation test in 41 EC tissues (31 neoplastic and 10 preneoplastic) as compared to their matched distant non-malignant tissues. miR-144 expression was found to be significantly and inversely correlated with PURA expression in 75 per cent (31/41) oesophageal cancer tissues (r=-0.344; P=0.028) suggesting PURA to be the downstream target of miR-144 (Fig. 6b). The other putative target, i.e. SPRED1, was also inversely correlated with miR-144 expression in 65 per cent (27/41) oesophageal tissues, however, this correlation was not found to be significant (r=-0.145, P=0.365).
Fig. 6.
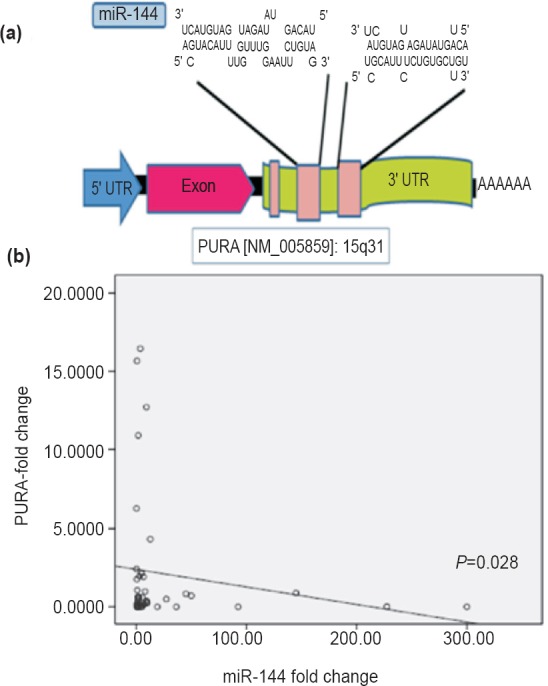
Negative association between miR-144 and its bioinformatically predicted target PURA: (a) Picture depicting miR-144 binding sites in 3’UTR region of PURA as predicted by RNAhybrid and PicTar. (b) Scatter plot showing negative correlation between miR-144 and PURA.
Correlation of PTEN with miR-144 and its target: PTEN was found to be downregulated in 56 per cent (17/30) EC tissues as compared to matched distant non-malignant tissues. Pearson correlation test was used to analyze the correlation between PTEN, miR-144 and newly identified potential targets of miR-144, i.e. PURA and SPRED1. A significant positive correlation was observed (r=0.404; P=0.027) between expression levels of PURA mRNA and PTEN mRNA levels. A negative but not significant correlation (r=-0.233) was observed between miR-144 expression and PTEN mRNA levels. SPRED-1 expression was also found to be positively correlated (r=0.238) with PTEN expression, however, the correlation was not significant.
Discussion
In the present study, the levels of miR-144 were assessed in non-neoplastic, preneoplastic and neoplastic oesophageal tissues as well as serum samples from patients with oesophageal cancer and normal individuals. miR-144 was found to be significantly upregulated in 83 per cent oesophageal cancer tissues as compared to their matched-distant non-malignant tissues. The dysplastic tissues showed upregulation of miR-144 as compared to their matched distant non-malignant tissues, indicating that miRNA may have a role in early stages of oesophageal carcinogenesis. In addition, significantly higher miR-144 levels in serum samples of patients with EC as compared to normals indicate the potential of this miRNA as minimally invasive marker for diagnosis of oesophageal cancer.
The observed upregulation of miR-144 in EC in the present study is consistent with its previously suggested oncogenic function in nasopharyngeal carcinoma and its increased expression in renal cancer10,11. Earlier microarray studies showed differential expression of miR-144 in ESCC16,17,18. Therefore, in the present study we used LNA™ technology. This can discriminate between miRNAs differing by one nucleotide thereby allowing excellent discrimination of miRNAs with high specificity.
miR-144 plays an important role in regulating cell proliferation, clonigenicity, migration, invasion and tumour formation in various cancers10. Various studies have validated PTEN10,26, RB126, mTOR27, and caspase-328 to be the direct targets of miR-144. Zhang et al10 showed that miR-144 overexpression suppressed expression of PTEN promoting G1 phase transition due to increase in expression of Akt and cyclin D1. It also led to decreased E-cadherin expression resulting in increase in migration and invasion. miR-144 treatment has also been shown to sufficiently reduce the levels of procaspase-3 affecting the activation of caspase cascade28. Lee et al26 have reported that Rb1, a well known negative cell cycle regulator is targeted by versican-bound miRNAs like miR-144 and miR-199a-3p and transfection of versican 3’ UTR interfered miRNA functioning freeing RB1 and PTEN for mRNA translation. We identified two new targets of miR-144, PURA and SPRED1. PURA, one of the newly identified targets, was found to be significantly downregulated in 81 per cent of oesophageal cancer tissues as compared to their matched distant non-malignant tissues. Down-regulation of PURA has also been observed in other cancers viz., chronic myeloid leukaemia29 and androgen-independent prostate cancer30. PURA exhibits the characteristics of a tumour suppressor protein and its overexpression blocks the cell cycle in G1 or G2 phases of proliferating cells with distinct morphological consequences31. Our results demonstrate that PURA may be a potential target of miR-144 and observed downregulation of PURA may be caused by increased expression of miR-144. However, further analysis of PURA at protein level is warranted to shed light on regulation at translational level.
The other predicted target of miR-144 SPRED1, was found to be downregulated in 69 per cent EC tissues as compared to matched distant non-malignant tissues. Although an inverse correlation of SPRED1 was observed with miR-144 expression at mRNA level in 65 per cent oesophageal cancer tissues, the correlation was not significant. Since in animals, instead of mRNA degradation, translational repression is a major mechanism for gene silencing by miRNAs32, further analysis at protein level is warranted to validate its association with miR-144.
In this study, we also analyzed the expression of one of the proven miR-144 targets i.e., PTEN using qPCR (data not shown). PTEN was observed to be downregulated in 56 per cent EC tissues as compared to matched distant non-malignant tissues. A significant positive correlation was observed (r=0.404; P=0.027) between expression levels of PURA mRNA and PTEN mRNA supporting our finding that PURA may be a target of miR-144.
In conclusion, our results demonstrated increased expression of circulating miR-144 in serum of oesophageal cancer patients, which could be used to discriminate ooesophageal cancer patients from normal individuals with good sensitivity (94.7%). Also, upregulation of miR-144 in all the dysplastic EC tissues as compared to their matched-distant non-malignant tissues suggests that it may serve as a biomarker for early detection of oesophageal cancer. Further investigation on miRNA-144 functions by introducing its antagonist may help better understand the role of this miRNA in pathogenesis of EC and may provide a potential strategy for treating this disease.
Acknowledgment
Authors acknowledge the Department of Biotechnology; Ministry of Science and Technology; Government of India, New Delhi, for financial support. The first author (PS) thanks the Council of Scientific and Industrial Research, New Delhi for fellowship.
Footnotes
Conflicts of Interest: None.
References
- 1.Ferlay J, Soerjomataram I, Ervik M, Dikshit R, Eser S, Mathers C, et al. Lyon, France: International Agency for Research on Cancer; 2013. GLOBOCAN 2012 v1.0, Cancer Incidence and Mortality Worldwide: IARC Cancer Base No. 11. Available from: http://globocan.iarc.fr/pages/factsheetscancer.aspx . [Google Scholar]
- 2.Howlader N, Noone AM, Krapcho M, Garshell J, Miller D, Altekruse SF, et al., editors. SEER cancer statistics review, 1975-2011. Bethesda, MD, USA: National Cancer Institute; 2014. [Google Scholar]
- 3.Allum WH, Stenning SP, Bancewicz J, Clark PI, Langley RE. Long-term results of a randomized trial of surgery with or without preoperative chemotherapy in esophageal cancer. J Clin Oncol. 2009;27:5062–7. doi: 10.1200/JCO.2009.22.2083. [DOI] [PubMed] [Google Scholar]
- 4.Zhu H, Leung SW. Identification of microRNA biomarkers in type 2 diabetes: a meta-analysis of controlled profiling studies. Diabetologia. 2015;58:900–11. doi: 10.1007/s00125-015-3510-2. [DOI] [PubMed] [Google Scholar]
- 5.Sun C, Huang F, Liu X, Xiao X, Yang M, Hu G, et al. miR-21 regulates triglyceride and cholesterol metabolism in non-alcoholic fatty liver disease by targeting HMGCR. Int J Mol Med. 2015;35:847–53. doi: 10.3892/ijmm.2015.2076. [DOI] [PubMed] [Google Scholar]
- 6.Clancy C, Joyce MR, Kerin MJ. The use of circulating microRNAs as diagnostic biomarkers in colorectal cancer. Cancer Biomark. 2015;15:103–13. doi: 10.3233/CBM-140456. [DOI] [PMC free article] [PubMed] [Google Scholar]
- 7.Wang B, Zhang Q. The expression and clinical significance of circulating microRNA-21 in serum of five solid tumors. J Cancer Res Clin Oncol. 2012;138:1659–66. doi: 10.1007/s00432-012-1244-9. [DOI] [PMC free article] [PubMed] [Google Scholar]
- 8.Mitchell PS, Parkin RK, Kroh EM, Fritz BR, Wyman SK, Pogosova-Agadjanyan EL, et al. Circulating microRNAs as stable blood-based markers for cancer detection. Proc Natl Acad Sci USA. 2008;105:10513–8. doi: 10.1073/pnas.0804549105. [DOI] [PMC free article] [PubMed] [Google Scholar]
- 9.Chen X, Ba Y, Ma L, Cai X, Yin Y, Wang K, et al. Characterization of microRNAs in serum: a novel class of biomarkers for diagnosis of cancer and other diseases. Cell Res. 2008;18:997–1006. doi: 10.1038/cr.2008.282. [DOI] [PubMed] [Google Scholar]
- 10.Zhang LY, Ho-Fun Lee V, Wong AM, Kwong DL, Zhu YH, Dong SS, et al. MicroRNA-144 promotes cell proliferation, migration and invasion in nasopharyngeal carcinoma through repression of PTEN. Carcinogenesis. 2013;34:454–63. doi: 10.1093/carcin/bgs346. [DOI] [PubMed] [Google Scholar]
- 11.Gaedcke J, Grade M, Camps J, Søkilde R, Kaczkowski B, Schetter AJ, et al. The rectal cancer microRNAome--microRNA expression in rectal cancer and matched normal mucosa. Clin Cancer Res. 2012;18:4919–30. doi: 10.1158/1078-0432.CCR-12-0016. [DOI] [PMC free article] [PubMed] [Google Scholar]
- 12.Machová Poláková K, Lopotová T, Klamová H, Burda P, Trnìnı M, Stopka T, et al. Expression patterns of microRNAs associated with CML phases and their disease related targets. Mol Cancer. 2011;10:41. doi: 10.1186/1476-4598-10-41. [DOI] [PMC free article] [PubMed] [Google Scholar]
- 13.Akiyoshi S, Fukagawa T, Ueo H, Ishibashi M, Takahashi Y, Fabbri M, et al. Clinical significance of miR-144-ZFX axis in disseminated tumour cells in bone marrow in gastric cancer cases. Br J Cancer. 2012;107:1345–53. doi: 10.1038/bjc.2012.326. [DOI] [PMC free article] [PubMed] [Google Scholar]
- 14.Falk GW, Skacel M, Gramlich TL, Casey G, Goldblum JR, Tubbs RR, et al. Fluorescence in situ hybridization of cytologic specimens from Barrett's esophagus: a pilot feasibility study. Gastrointest Endosc. 2004;60:280–4. doi: 10.1016/s0016-5107(04)01687-6. [DOI] [PubMed] [Google Scholar]
- 15.Chen YJ, Ko JY, Chen PJ, Shu CH, Hsu MT, Tsai SF, et al. Chromosomal aberrations in nasopharyngeal carcinoma analyzed by comparative genomic hybridization. Genes Chromosomes Cancer. 1999;25:169–75. [PubMed] [Google Scholar]
- 16.Guo Y, Chen Z, Zhang L, Zhou F, Shi S, Feng X, et al. Distinctive microRNA profiles relating to patient survival in esophageal squamous cell carcinoma. Cancer Res. 2008;68:26–33. doi: 10.1158/0008-5472.CAN-06-4418. [DOI] [PubMed] [Google Scholar]
- 17.Yang M, Liu R, Sheng J, Liao J, Wang Y, Pan E, et al. Differential expression profiles of microRNAs as potential biomarkers for the early diagnosis of esophageal squamous cell carcinoma. Oncol Rep. 2013;29:169–76. doi: 10.3892/or.2012.2105. [DOI] [PubMed] [Google Scholar]
- 18.Xie Z, Chen G, Zhang X, Li D, Huang J, Yang C, et al. Salivary microRNAs as promising biomarkers for detection of esophageal cancer. PLoS One. 2013;8:e57502. doi: 10.1371/journal.pone.0057502. [DOI] [PMC free article] [PubMed] [Google Scholar]
- 19.Sharma P, Saraya A, Gupta P, Sharma R. Decreased levels of circulating and tissue miR-107 in human esophageal cancer. Biomarkers. 2013;18:322–30. doi: 10.3109/1354750X.2013.781677. [DOI] [PubMed] [Google Scholar]
- 20.Hornig-Do HT, Montanari A, Rozanska A, Tuppen HA, Almalki AA, Abg-Kamaludin DP, et al. Human mitochondrial leucyl tRNA synthetase can suppress non cognate pathogenic mt-tRNA mutations. EMBO Mol Med. 2014;6:183–93. doi: 10.1002/emmm.201303202. [DOI] [PMC free article] [PubMed] [Google Scholar]
- 21.Livak KJ, Schmittgen TD. Analysis of relative gene expression data using real-time quantitative PCR and the 2(-Delta Delta C(T)) Method. Methods. 2001;25:402–8. doi: 10.1006/meth.2001.1262. [DOI] [PubMed] [Google Scholar]
- 22.Hein J, Schellenberg U, Bein G, Hackstein H. Quantification of murine IFN gamma mRNA and protein expression: impact of real-time kinetic RT-PCR using SYBR green I dye. Scand J Immunol. 2001;54:285–9. doi: 10.1046/j.1365-3083.2001.00928.x. [DOI] [PubMed] [Google Scholar]
- 23.Megraw M, Sethupathy P, Corda B, Hatzigeorgiou AG. miRGen: A database for the study of animal microRNA genomic organization and function. Nucleic Acids Res. 2007;35:D149–55. doi: 10.1093/nar/gkl904. [DOI] [PMC free article] [PubMed] [Google Scholar]
- 24.Boyle EI, Weng S, Gollub J, Jin H, Botstein D, Cherry JM, et al. GO: TermFinder-open source software for accessing Gene Ontology information and finding significantly enriched Gene Ontology terms associated with a list of genes. Bioinformatics. 2004;20:3710–5. doi: 10.1093/bioinformatics/bth456. [DOI] [PMC free article] [PubMed] [Google Scholar]
- 25.Conesa A, Götz S, Garcia-Gomez JM, Terol J, Talón M, Robles M. Blast2GO: a universal tool for annotation, visualization and analysis in functional genomics research. Bioinformatics. 2005;21:3674–6. doi: 10.1093/bioinformatics/bti610. [DOI] [PubMed] [Google Scholar]
- 26.Lee DY, Jeyapalan Z, Fang L, Yang J, Zhang Y, Yee AY, et al. Expression of versican 3’-untranslated region modulates endogenous microRNA functions. PLoS One. 2010;5:e13599. doi: 10.1371/journal.pone.0013599. [DOI] [PMC free article] [PubMed] [Google Scholar]
- 27.Iwaya T, Yokobori T, Nishida N, Kogo R, Sudo T, Tanaka F, et al. Downregulation of miR-144 is associated with colorectal cancer progression via activation of mTOR signaling pathway. Carcinogenesis. 2012;33:2391–7. doi: 10.1093/carcin/bgs288. [DOI] [PubMed] [Google Scholar]
- 28.Ovcharenko D, Kelnar K, Johnson C, Leng N, Brown D. Genome-scale microRNA and small interfering RNA screens identify small RNA modulators of TRAIL-induced apoptosis pathway. Cancer Res. 2007;67:10782–8. doi: 10.1158/0008-5472.CAN-07-1484. [DOI] [PubMed] [Google Scholar]
- 29.Bruchova H, Borovanova T, Klamova H, Brdicka R. Gene expression profiling in chronic myeloid leukemia patients treated with hydroxyurea. Leuk Lymphoma. 2002;43:1289–95. doi: 10.1080/10428190290026358. [DOI] [PubMed] [Google Scholar]
- 30.Inoue T, Leman ES, Yeater DB, Getzenberg RH. The potential role of purine-rich element binding protein (PUR) alpha as a novel treatment target for hormone-refractory prostate cancer. Prostate. 2008;68:1048–56. doi: 10.1002/pros.20764. [DOI] [PubMed] [Google Scholar]
- 31.Stacey DW, Hitomi M, Kanovsky M, Gan L, Johnson EM. Cell cycle arrest and morphological alterations following microinjection of NIH3T3 cells with Pur alpha. Oncogene. 1999;18:4254–61. doi: 10.1038/sj.onc.1202795. [DOI] [PubMed] [Google Scholar]
- 32.Ambros V. A hierarchy of regulatory genes controls a larva to-adult developmental switch in C. elegans. Cell. 1989;57:49–57. doi: 10.1016/0092-8674(89)90171-2. [DOI] [PubMed] [Google Scholar]