

Abstract
Objective
Electrocorticography (ECoG) has become an important tool in human neuroscience and has tremendous potential for emerging applications in neural interface technology. Electrode array design parameters are outstanding issues for both research and clinical applications, and these parameters depend critically on the nature of the neural signals to be recorded. Here, we investigate the functional spatial resolution of neural signals recorded at the human cortical surface. We empirically derive spatial spread functions to quantify the shared neural activity for each frequency band of the electrocorticogram.
Approach
Five subjects with high-density (4mm center-to-center spacing) ECoG grid implants participated in speech perception and production tasks while neural activity was recorded from the speech cortex, including superior temporal gyrus, precentral gyrus, and postcentral gyrus. The cortical surface field potential was decomposed into traditional EEG frequency bands. Signal similarity between electrode pairs for each frequency band was quantified using a Pearson correlation coefficient.
Main results
The correlation of neural activity between electrode pairs was inversely related to the distance between the electrodes; this relationship was used to quantify spatial falloff functions for cortical subdomains. As expected, lower frequencies remained correlated over larger distances than higher frequencies. However, both the envelope and phase of gamma and high gamma frequencies (30-150Hz) are largely uncorrelated (<90%) at 4mm, the smallest spacing of the high-density arrays. Thus, ECoG arrays smaller than 4mm have significant promise for increasing signal resolution at high frequencies, whereas less additional gain is achieved for lower frequencies.
Significance
Our findings quantitatively demonstrate the dependence of ECoG spatial resolution on the neural frequency of interest. We demonstrate that this relationship is consistent across patients and across cortical areas during activity.
Keywords: electrocorticography, brain machine interface, neural device design, spatial resolution, neural frequency band
1. Introduction
Electrocorticography (ECoG) is a method of recording electrical neural signals from the cortical surface and is a well-established clinical tool for localizing seizure foci in epileptic patients. Clinical ECoG records neural activity using electrodes positioned in a grid arrangement, usually spaced 1cm apart. More recently ECoG has found utility in both scientific and engineering applications due to its high spatial and temporal resolution relative to noninvasive imaging approaches. In research applications, high frequency neural responses have been shown to be informative for task-related neural decoding, while low frequency bands can serve as markers for neural states (N. E. Crone, Korzeniewska, & Franaszczuk, 2011; Engel & Fries, 2010; Fries, Nikolić, & Singer, 2007; Kellis et al., 2010; Lachaux, Axmacher, Mormann, Halgren, & Crone, 2012; Miller et al., 2007; Ray, Crone, Niebur, Franaszczuk, & Hsiao, 2008; Womelsdorf & Fries, 2007). Moreover, high frequency neural signals have been described to be more spatially discrete than low frequency signals(Buzsaki & Draguhn, 2004; Edwards et al., 2009; Leski, Lindén, Tetzlaff, Pettersen, & Einevoll, 2013; Pesaran, 2010; Viventi et al., 2011). However, the spatial resolution of neural signals from the human cortical surface with respect to these functional neural frequency bands has never been fully quantified in humans.
Higher density ECoG grids collect more information from the cortical surface than the standard 1 cm grids, leading to better decoding performance in brain machine interface applications(Blakely, Miller, Rao, Holmes, & Ojemann, 2008; Breshears et al., 2011; Flinker, Chang, Barbaro, Berger, & Knight, 2011; Kellis et al., 2010; Khodagholy et al., 2015; Leuthardt, Freudenberg, Bundy, & Roland, 2009; Wang et al., 2009). In most cases, these high density arrays have covered a very small area of cortex, and therefore large scale comparisons of shared signal in space have not been evaluated. Recently, correlations in the raw signal have been explored with respect to distance using a clinical ECoG array and a microwire ECoG array(Kellis et al., 2015). However, the measured signals from the microwire array are inherently different from those of the clinical array due to filtering effects of electrode size and shape(Kent & Grill, 2014; Lempka et al., 2011). Furthermore, the microwire array can examine signal similarity only within a very small area of cortex, while the clinical array sparsely samples a wide expanse of cortex that may or may not be actively engaged at the time of recording.
Ultra high-density, low impedance electrode arrays for chronic human recordings are not presently FDA approved in the United States, which is a dilemma for empirically deriving spatial resolution values for this work. Work in animal models can give us some insight into spatial correlations at higher electrode density(Kajikawa & Schroeder, 2011; Katzner et al., 2009; Xing, Yeh, & Shapley, 2009); however, it may be that spatial correlations in human cortex differ due to differences in underlying cytoarchitecture, cortical thickness, and differences in cortical folding across species(Elston, 2003). Thus, we hope that this study serves to illustrate the utility of moving toward higher-density arrays in human subjects as well. A high-density ECoG grid with 4mm spacing of electrodes offers a unique opportunity to identify shared signal at close spacing of electrodes, over a broad area of active cortex, and across neural frequency bands. We describe frequency band-specific spatial spread at the cortical surface in patients performing speech-related tasks. We use these observations to compare spatial spread functions across patients and across functional areas during speech perception and production tasks.
2. Materials and Methods
2.1 Experimental setup
2.1.1. Subjects
Experimental procedures were approved by the Committee for Human Research at the University of California, San Francisco, and all participants provided written informed consent. Patients undergoing ECoG grid implantation for epilepsy focus localization (N=5, 0M/5F, 25 – 41 years old) volunteered to participate in this research study. Patients were implanted with 256 channel high-density subdural electrode arrays (AdTech, Racine, WI or Integra, Plainsboro, NJ) with 4mm center-to-center spacing (1.17mm exposed diameter). Electrodes were positioned according to clinical criteria but included coverage over the superior temporal gyrus and the ventral sensorimotor cortex (pre- and post-central gyri). An electrode in the sub-galeal space served as the reference electrode and ground.
2.1.2. Tasks and stimuli
The patients either spoke or listened to sentences taken from the TIMIT database (Garofolo, 1993; Wrench, 1999). In the listening task, patients heard a subset of 125 sentences drawn pseudo-randomly from a list of 499 sentences spoken by 354 male and 145 female speakers. In the speaking task, patients were instructed to read a set of 50 sentences, presented visually on a laptop screen at a user-driven pace. In both tasks, sentences were chosen to evenly sample the distribution of phonemes present in English. These tasks lasted approximately 5-10 minutes each. Presentation of experimental stimuli was synchronized to neural recordings and controlled using custom MATLAB software running on a Windows laptop.
2.2 Recording and data processing
Signals were acquired at a sampling rate of 3051.8 Hz and were amplified and digitized using a Tucker-Davis Technologies (Alachua, FL, USA) neural recording system (RZ2 DSP combined with a 256-channel PZ2 amplifier). Manual artifact and channel rejection was performed, followed by common average referencing (CAR) (N. Crone, Boatman, Gordon, & Hao, 2001). The CAR consists of the mean across sixteen-channel banks of non-rejected electrodes that are spatially arranged in a row that spans 6cm. The CAR approximates the activity contributed by the original reference, so subtracting the CAR from each channel largely removes contributions of the original reference electrode and electrical artifacts that are often present in groups of sixteen channels due to shared connectors and cabling (see Crone et al. 2001 for a discussion of CAR in ECoG recordings). The CAR can also be thought of as the spatial DC portion of the signal, and CAR-re-referencing as a typical mean or DC removal.
The signal from each electrode channel was filtered into 40 frequency bands using an FFT followed by a Hilbert transform with logarithmically increasing center frequencies (range of CF = 4.07 Hz – 193.8 Hz). The analytic amplitude, also known as the envelope, and the phase were calculated for each (Edwards et al., 2009). The filtered frequencies were then averaged into frequency bands corresponding to the traditional theta (4 – 7 Hz), alpha (7 – 14 Hz), beta (15 – 30 Hz), gamma (30 – 60 Hz), and high gamma (70 – 150 Hz) bands. This signal was then z-scored with respect to rest (no-task) epochs within the same recording. The anatomical location of electrodes was determined with the aid of co-registered brain CT and MRI images. The precentral gyrus (preCG), the postcentral gyrus (postCG), the suprasylvian region, the superior temporal gyrus (STG), and the middle temporal gyrus (MTG) were grouped and evaluated separately for some analyses.
2.3 Analytical methods
Electrodes were chosen for analysis within an anatomically defined area using a bootstrap t-test to find electrodes that responded significantly to speech over silence in the high gamma band. The high gamma band was chosen because it has been shown to exhibit specificity in activation to speech sounds in eloquent cortex. Electrode responses during speech were compared to responses during silence using short consonant-vowel syllables as the stimulus. The threshold p-value for inclusion was p<0.001 over 10,000 bootstrap iterations. Of the 256 electrodes on the grid, an average of 80±6 electrodes were anatomically localized to the superior temporal gyrus, which is expected to respond to speech sounds. Of these anatomically localized electrodes, an average of 87% showed significant responses to speech over silence.
A Pearson correlation coefficient was calculated between the time series of either the analytic amplitude or the phase of each electrode pair within the anatomically and functionally defined subset (described above) and associated with the Euclidean distance between the electrodes. Figure 1 shows representative data along with its subsequent comparison for two nearby electrodes. For simplicity, the term ‘component’ will be used to refer to either the analytic amplitude or the phase of a single frequency band for a single patient. The entire 5-10 minutes of data from each task were used to derive the correlation coefficient for the aforementioned subsets of electrode pairs. Both the electrode subset and the time series used to derive correlation coefficients varied by task. The datasets for the two tasks were analyzed independently. We calculated chance level correlations for each frequency band by randomizing the data for each component in time for each electrode separately and repeating the correlation measures for all distances. Correlations for the randomized data fell very close to zero (± 5×10⁻⁴) irrespective of frequency band and distance.
Figure 1.

Comparing ECoG signals from adjacent electrodes. (A) MRI reconstruction with CT co-registered electrode positions. (Inset) Two adjacent electrodes are spaced 4mm apart on the STG (green and blue). (B) Sound waveform of example sentence presented aurally. (C) Raw ECoG signal from green electrode (after notch filtering and common average referencing). (D-E) Time-locked neural signal from the blue (D) and the green (E) electrodes in the theta range. Light color shaded lines are bandpassed signal in the theta range, while dark colored lines are the analytic amplitude of the signal. (F) Analytic amplitudes are overlaid, and show high correlation (R=0.83, over approximately 5 minutes of data) (G) Phase traces for the same electrodes show high correlation (R=0.65, also over approximately 5 minutes of data).
To define the spatial relationship of correlation between electrode pairs, we modeled the falloff of the electrode correlations vs. distance, using the interquartile range of the data for each component. We tested exponential (equation 1), Lorentzian (equation 2), Gaussian (equation 3), and power law (equation 4) functions to describe this falloff. These equations were chosen to fit the data because they are typical equations that describe non-linear fall offs and that allow for the necessary observation that when distance is zero, correlation is one. A constant term was added where necessary to correct for the noise floor of the correlation dataset, which is most likely due to either shared activity from the reference electrode or shared noise (Bruns, Eckhorn, Jokeit, & Ebner, 2000). In each case, the number of free parameters was limited to two to avoid over-fitting of the function to the data.
| (1) |
| (2) |
| (3) |
| (4) |
These functions were fit separately for each component, allowing maximum goodness of fit and equal opportunity for different functions to describe the different frequencies. The best-fit equation was chosen as the one with the highest R-squared value using a least-squares method. For each component, the best-fit function across patients was chosen to represent the average falloff of correlation versus distance. To adequately capture the curvature of the falloff, we used only pairwise correlations at distances of 20mm and below. Using data in this range minimizes the contribution to the fit from the noise floor of low correlation, which is also captured in the constant c. The fits with the highest R-squared values were corroborated by visual inspection; the data were well approximated by the chosen fit for every patient at every frequency.
3. Results
The goal of our study was to quantify the average spatial spread at the cortical surface for each functional frequency band. Using high-density ECoG arrays and data from human intracranial recordings, we applied a correlation-based analysis to determine the extent of shared signal across the cortical surface for the amplitude and phase content of five frequency bands.
A natural starting point for estimating spatial falloff is to look at that of the raw signal before decomposing the signal into frequency bands. This is shown in Figure 2, where for each distance of separation on the electrode grid, the interquartile range of data points is plotted as a box plot. The majority of electrode pairs are correlated above noise floor only within 2cm; after this distance of separation between electrodes the plot approximates a horizontal line. Therefore, only electrodes located 2cm or less from one another were used for analyses. We then fit curves to the data points corresponding to electrode pair correlations to describe the falloff of correlation with distance. The best fit in this example is plotted with a dashed line. Note that the curve continues to points that are unobservable by the high-density grid, including distances less that 4mm. This part of the curve is extrapolated, and it can give us intuition about what correlations would be observed in the raw signal with more closely spaced electrodes, with the caveat that correlations at distances below 1.17mm (the contact diameter of the electrode) are underestimated.
Figure 2.
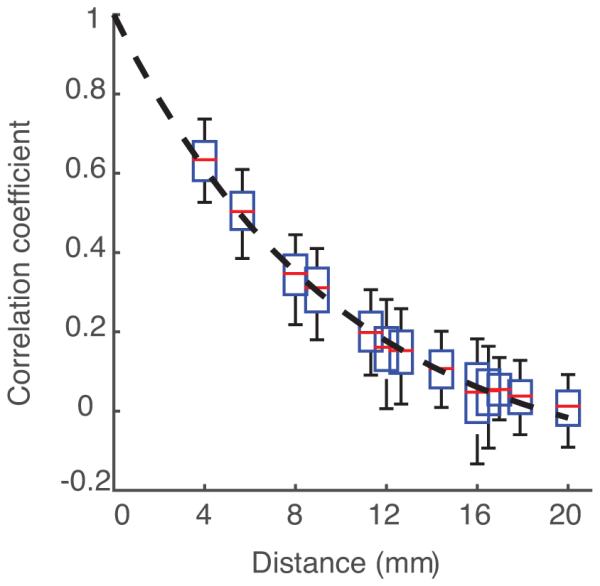
Raw signal correlation decreases with distance. The falloff of correlation coefficient for pairs of neural signals as distance between electrode pairs increases. Blue outline represents the interquartile range of data. Red lines are the median of each plot. Black whisker lines represent the upper and lower quartiles of data. Black dashed line shows the exponential fit, chosen as such because it has the highest R2 value of the functions that attempted to fit the data. There are no observations below 4mm, the closest spacing of electrodes.
Correlations at low frequencies are higher in magnitude and more widespread than at high frequencies. This is shown in Figure 3 for the theta and the high gamma frequency bands. The high gamma band signals at nearby electrodes show a lower maximum correlation in comparison to the theta band signals, and the spatial spread of notable correlations encompasses less area on the cortical surface than that of theta. As expected, we observe a decrease in correlation between pairs of electrodes as the distance increases between them.
Figure 3.

Comparison of ECoG spatial spread for low and high spectral frequency bands. The part of the brain that is represented in the insets is shown in the boxed portion of the full brain above. In the inset to the left, correlations in analytic amplitude for the theta band are shown for one electrode. The same electrode is shown at right, along with correlations in the analytic amplitude of the high gamma frequency band. The theta band (left) shows higher correlations over a larger area than the high gamma band (right). The electrode to which all pairwise correlations are made is shown in blue for each.
The correlations between electrode pairs differ predictably not only by frequency band but also by whether or not the patient was engaged in a task. The tasks that we examined were speech perception and production. The rest versus task distinction is particularly evident in the high gamma band for electrodes that are considered active (see Methods for details in determining which are active). Figure 4 shows the drastic difference in correlation patterns with distance for electrodes in the STG when the patient listened to speech versus when the patient sat quietly. Points at each distance are represented in a distribution plot to compare the shape of distributions. The correlations are more variable and on average higher during rest than when the patient is listening to speech. Both the median and the mean are lower during activity than during rest at all distances. A paired t-test was performed for the correlation values at each distance, and at all distances shown (distance<20mm) there were statistically significant differences in correlations for task vs. rest (p<0.05). Similar differences in correlation with activity have been described elsewhere (Buckner & Vincent, 2007; Cohen & Kohn, 2011; Fukushima, Saunders, Leopold, Mishkin, & Averbeck, 2012). Because correlations decrease with activity, the spatial spread function shows a steeper fall off during activity than during rest. Considering this fact, and additionally considering that the neural signal of interest is most likely elicited while a subject is engaged in a task of some sort, we decided to base the remainder of our analyses on electrodes that are considered active in an anatomical area, during a stimulus that elicits that activity.
Figure 4.

Distributions of high gamma correlations for rest versus activity. Correlations decrease markedly in the high gamma frequency when the subject performs a task. Distributions at each distance are shown for the high gamma analytic amplitude activity for active electrodes in STG of one patient during a listening task. The gray plots show the distributed values of correlations between electrodes at each distance during rest, while the green plots show this distribution during the task. At each distance, the same number of data points are used to create the distributions in gray and green.
As mentioned in Section 2.3, four functions were fit to the data. Representative data from the theta band of one subject is shown with all fit lines superimposed in Figure 5. The Lorentzian and exponential forms were similar in shape and in goodness-of-fit, and the R-squared value for goodness-of-fit was quite high for both (R2Lorentzian = 0.93, R2exponential = 0.92). Indeed, the best fit choice was either Lorentzian or exponential for all components tested; however, the difference between R2 values for these models increased for high neural frequencies (gamma and high gamma). Regardless of whether the function tested was Lorentzian or exponential, the resulting fit lines for correlation decrease with distance differed only slightly. In all cases, the Lorentzian and exponential forms were greatly superior to the Gaussian and Power Law forms in describing the falloff in correlation for each component.
Figure 5.

Best fit functions approximate representative data (theta band analytic amplitude) for a single subject. A distribution plot of pairwise correlations at each distance are shown in blue. The best fit line for this component is a Lorentzian fit, shown by the line in blue. The Lorentzian form is followed closely in goodness-of-fit by the exponential form, shown by a dashed line. The goodness-of-fit further decreases for the Gaussian fit, and finally for the Power Law.
Across frequency bands there is a nonlinear falloff of correlation with distance for both amplitude and phase of the signal. The falloff becomes steeper as the neural frequency increases. This is shown in Figure 6 where best fits are averaged over five patients. The fits shown are for electrodes in the STG while the patients listened to sentences. There is a clear similarity in falloff pattern for theta and alpha bands and for gamma and high gamma bands. In the analytic amplitude data, correlation falloffs were best fit by a Lorentzian function in individual patients as well as the subject-pooled data. For phase correlations, theta and alpha were best fit by an exponential function, whereas beta, gamma, and high gamma were best fit by the Lorentzian. Importantly, the best fit function in each case was identical across patients. This did not have to be the case, since the analytic amplitude and phase for each frequency band for each patient were fit separately. The functional form of best fit for any patient could have differed from that of the other patients for the same component; however, all components of the same class were fit best with the same functional form across all five patients. This made the task of defining a best fit curve for each component easy because we simply average the coefficients of best fit for each component across patients.
Figure 6.

Electrode pair correlations decrease predictably as a function of distance. A curve-fitting algorithm was used to fit four equations to the data. The fit with the highest R-squared value was chosen to represent the frequency band. Fit lines become steeper with increasing neural frequency for all patients, indicating a sharper falloff of shared variability for high frequency bands with distance. The result is averaged over five patients for active electrode pairs over the STG. Dark lines indicate the mean fit across patients; lighter background fill indicates standard error across patients. The gray shaded region is the region of the fit in which there were no neighboring electrode pairs below 4mm.
To determine if the form or slope of the best fit function differs by anatomical location, we then took correlations between electrodes overlying the preCG and postCG while the patient spoke sentences, a task that evokes reliable activity in the sensorimotor cortex(Bouchard, Mesgarani, Johnson, & Chang, 2013). The correlation analysis was repeated for these anatomical areas. Again we found the same effect: a steeper correlation falloff with increasing neural frequency. On closer comparison of fits between areas, we found that the spatial correlation falloff fit lines for preCG, postCG, and STG did not differ significantly (p>0.05, paired t-test with Bonferroni correction for multiple comparisons). Therefore, the presented results also apply to the pre- and post-central gyri as well as to the STG. This is shown in Figure 7 as a function of the coefficient B, which represents the steepness of descent of the fits. This coefficient value is conserved over patients and anatomical areas, but notably not across frequency bands. The shift in value can be noted best for the same function form for all analytic amplitude fall offs. The B values shift from a relatively high value to a lower value as frequency band increases, corresponding to the increased steepness of the fall off with distance. The same pattern is seen with best fits in the phase data.
Figure 7.

The steepness of correlation falloff values are conserved across patients and cortical regions, but differ by frequency band. (A) The Lorentzian equation (see Methods, equation 2) is the equation of best fit to represent falloff of correlation with distance for all frequency bands. The B value is representative of the steepness of the curve. The mean and standard error of the B value across patients for each cortical area is represented with a center point and error bars at each frequency band. The error bars and points are color coded by cortical area. A representative curve is shown above for each frequency band to give an idea of the curve that is constructed with the average B value. (B) The exponential equation (see Methods, equation 1) is the equation of best fit to represent falloff of correlation with distance for theta and alpha frequency bands, while the Lorentzian fit best describes falloff of correlation with frequency for beta, gamma, and high gamma bands. The B value is representative of the steepness of the curve. The mean and standard error of the B value across patients for each cortical area is represented with a center point and error bars at each frequency band. The error bars and points are color coded by cortical area. A representative curve is shown above for each frequency band to give an idea of the curve that is constructed with the average B value.
Our estimations to this point were mostly constrained to a single gyrus and by nature assume a continuous surface. We next wanted to determine how anatomical factors such as cerebral convolutions and lobar divisions affect spatial correlations. We therefore analyzed the spatial correlations between electrodes that were within a single gyrus, across a sulcus (the superior temporal sulcus between the STG and MTG), and across brain lobes (the Sylvian Fissure, between the frontal and temporal lobe). We hypothesized that spatial correlations within the STG would be significantly greater than across the superior temporal sulcus, and even more so than across the Sylvian Fissure. To test this prediction, we shifted our focus from the interquartile range to the upper quartile range of values so that high correlation values were preserved. We observed that correlations were higher between electrodes within a gyrus and that patterns of correlation seemed to cluster with anatomical boundaries such as sulci. This relationship was quantified for electrodes in the STG to electrodes in the MTG and for electrodes in the STG to electrodes across the Sylvian fissure. An ANOVA was performed between groups for each distance, followed by post-hoc pairwise t-tests where applicable. The most convincing differences were in the low neural frequencies. The theta band observations are shown in Figure 8. For the theta frequency band at near distances, the STG-STG electrodes were more highly correlated than the STG-MTG electrodes and the STG-IFG (suprasylvian) electrodes. At distances of 5.65mm (for diagonally adjacent electrodes) and 4 mm, the STG-STG electrode correlations differ from STG-IFG correlations but do not differ significantly from the STG-MTG electrodes. This pattern is also seen for the alpha band. The pattern of significance suggests that within-gyrus correlations are highest, followed by within-lobe correlations, and finally across-lobe correlations on gyri. The pattern was not statistically significant for the beta to high gamma band. We surmise that this is due to the already-low correlations that are observed at the shortest observable distance of 4mm in these bands. We postulate that if the density of the grid were high enough, the same pattern would be observed in higher frequency bands as in the theta band; within-gyrus correlations are highest, followed by within-lobe correlations, and finally across-sulcus correlations.
Figure 8.

Within gyrus, across sulcus, and across fissure correlation patterns for the theta band. Correlations within a gyrus trend higher than correlations across a sulcus or the Sylvian fissure. Mean and standard error of correlations over patients are plotted for electrodes within the STG (blue solid line), STG to MTG (dotted line), and STG to IFG (dashed line). This effect is more pronounced for amplitude correlations than phase correlations. Statistical significance, determined with an ANOVA followed by paired t-tests at each distance, is denoted by markers above each distance. An asterisk denotes a significance of p<0.05 between groups ‘Within STG’ and ‘STG to suprasylvian.’ A circle denotes significance of p<0.05 between groups ‘Within STG’ and ‘STG to MTG.’
4. Discussion
This study was done to empirically define the spatial spread function of ECoG signals towards understanding the relationship of neural frequency with spatial spread of activity across electrodes. We quantitatively defined the relationship of neural signal correlation and spatial distance. We further quantified how frequency band components affect this relationship, as higher frequencies have higher spatial resolution than low frequencies. We compared the spatial spread function across patients and across functional gyri, and noted consistency in the spatial fall off across patients and across functionally distinct areas. We then examined the effect of gyral and sulcal structural anatomy on spatial correlations.
There are three major contributions to the observed positive spatial correlations, not including artifact or a common reference. First, there are correlations that are due simply to the physical properties of the measured electric field; this is referred to as volume conduction. The magnitude of electric fields decrease as a function of one over distance squared(Cybulski et al., 2014). Second, there are functional correlations in neural networks due to synaptic connectivity. These functional correlations could appear in regions far away from each other because networks are not constrained to neighboring areas. Third, there are correlations due to the properties of the underlying neurophysiological generators of electric signals. While the neural origins of the various canonical frequency bands are still a topic of debate, one theory is that low frequency signals are due to the spatial summation of synchronous dendritic inputs and that high frequency signals are the fields produced by spiking sub-populations and fast ionic and synaptic currents(Edwards et al., 2009, 2010; Lempka et al., 2011; Pesaran, 2009). If this is the case, low frequency correlations are more widespread than high frequency correlations because their generators act as a synchronous unit over a larger area than a high frequency spiking subpopulation. All three major categories of correlation are presumably represented in the dataset that we have analyzed in this paper.
To date, the closest study to the one presented here was a spatial correlation analysis of ECoG signals across different electrode types in various places on the human cortex(Kellis et al., 2015). This was done using small microwire arrays in addition to large clinical arrays with 1cm spacing. The findings in this paper suggest similar patterns in spatial correlation fall off with distance for both tested arrays, for raw data. However, the reported spatial correlation fall offs are shallower than we observe. This is probably due to recording while the patient was not engaged in a task to specifically elicit activity in the recorded area. In our own analysis of correlations during rest versus activity, we observed a similar shallow fall off curve during rest. Interestingly, high-frequency modulation, which is believed to represent the activity of spatially localized neural processes, shows a greater change in correlation for rest versus task conditions than low frequency data. This is consistent with the idea that spatially discrete high frequency generators are recruited for a task, while low frequency generators maintain a brain state or modulate attention(Donner & Siegel, 2011; Engel & Fries, 2010). Importantly, our finding of stronger falloff of correlations during activity suggests that higher electrode densities may add specificity to observed task-related signals. Since distinct patterns of evoked activity may be observed even at small distances, increased spatial resolution may improve decoding of task-related output. Determining the optimal spacing between electrodes would allow us to determine at what spatial scale neural signals are redundant for a given task.
It would seem that the optimal spacing of electrodes would simply be to use the smallest inter-electrode distance possible that avoids shunting. However, there are other factors to consider. First, as density increases, electrode size necessarily decreases to make space and indeed to avoid electrical shunting. Smaller electrodes may not be ideal for electrocorticography recordings because they measure integrated activity of a smaller body of neural generators, and they potentially lose sensitivity to deeper cortical sources(Wodlinger, Degenhart, Collinger, Tyler-Kabara, & Wang, 2011). Furthermore, as electrodes become smaller their impedance increases, making the signal-to-noise ratio lower than similar electrodes of a larger scale. Second, higher channel counts mean more wires, connectors, amplifiers, and data storage units. This is not trivial as channel counts increase into the thousands, though it may not be necessary if a more efficient use of materials can give a similar picture of the neural activity.
Considering the above as motivation, it is clear that determining the falloff of signal correlations over cortical distance has implications for the design of ECoG grids. Freeman et al. performed a study on the optimal spacing of electrodes in ECoG for signals recorded from the human STG and motor cortex(Freeman, Rogers, Holmes, & Silbergeld, 2000). The study was done with a linear microwire array, and it examined the spatial frequency of neural oscillations up to 50 Hz. The conclusion was that for these frequency bands, the smallest spatial frequency observed above the noise floor was one that corresponds to 2.5mm per cyclic spatial change. This correlates well with our shared variability observation for low frequency neural signals. Another more recent study(Slutzky et al., 2010), used modeling of neural dipoles to estimate the optimal spacing of surface electrodes for human cortex. The resulting recommendation for electrode spacing was 1.4mm correcting for Nyquist sampling, a measurement that again corresponds roughly to our observed and extrapolated correlations for low frequency neural data in the theta and alpha bands.
We have demonstrated the relationship between neural frequency and the spatial spread of signals at the cortical surface. Whether the application is during rest or active behavior will change the expected signal correlation over distance. The phase and amplitude observations have similar dependencies; however, phase correlations decrease more quickly with distance. This is of particular importance in the theta and alpha bands where phase is a common signal of interest.
Although this study included areas that were both sensorimotor and higher-order processing, correlations were computed for speech-related tasks in speech-related areas. Cortical encoding and tuning might be at different scales in other brain regions or even for other types of stimuli. A potential limitation of the fitting approach is that it leans toward the average of many data points, and therefore the resulting fit can over- or underestimate the activity spread from any one specific point. The results are an estimated fit averaged over several patients; as such, the cortical resolution suggested by these results should be interpreted as an average, not an absolute minimum. By the same token, taking the interquartile range leaves out the most highly correlated electrodes at each distance and can therefore be considered a conservative measure of shared signal.
Furthermore, our results provide novel information about the spatial spread of local field potential signals at the cortical surface. With ECoG grids of sufficient density and area, analysis of cortical activity can better describe the dynamics and functional connectivity of the cortex. Future studies can reveal if there are truly separable functional areas that respond to similar stimuli. The identification of functional areas corresponding to frequency of neural signal can shed light onto the origin of neural oscillations of various frequencies, most of which are not currently well understood.
5. Conclusions
The optimal spacing of ECoG electrodes depends heavily on the neural frequency band. The shape of the curve that defines this relationship is consistent across patients, but differs depending on which frequency band is represented and on which feature, amplitude or phase, is being represented. The dependence of this correlation falloff function on anatomical region is minimal, but falloff is stronger during speech-related tasks compared to rest. Correlations within functionally defined gyri are higher than those across sulci for low frequency oscillations.
Acknowledgments
The authors would like to thank M. Leonard, D. Moses, C. Tang, M. Sjerps, M. Baud, B. Dichter, D. Conant, G. Anumanchipalli, L. Frank, C. Schreiner, D. Lowenstein, and M. Maharbiz for helpful discussion on this work. This work was supported by grants from the NIH and the National Institute on Deafness and Other Communication Disorders (R01 DC012379 04, to EFC, and a Ruth L. Kirschstein Postdoctoral NRSA F32DC014192-01, to LSH), DARPA SUBNETS W911NF-14-2-0043, the William K. Bowes, Jr. Foundation, the Shurl and Kay Curci Foundation, and the McKnight Foundation.
References
- Bouchard KE, Mesgarani N, Johnson K, Chang EF. Functional organization of human sensorimotor cortex for speech articulation. Nature. 2013;495:327–32. doi: 10.1038/nature11911. doi:10.1038/nature11911. [DOI] [PMC free article] [PubMed] [Google Scholar]
- Breshears JD, Gaona CM, Roland JL, Sharma M, Anderson NR, Bundy DT, Leuthardt EC. Decoding motor signals from the pediatric cortex: implications for brain-computer interfaces in children. Pediatrics. 2011;128(1):e160–e168. doi: 10.1542/peds.2010-1519. doi:10.1542/peds.2010-1519. [DOI] [PubMed] [Google Scholar]
- Bruns A, Eckhorn R, Jokeit H, Ebner A. Amplitude envelope correlation detects coupling among incoherent brain signals. Neuroreport. 2000;11(7):1509–1514. doi:10.1097/00001756-200005150-00028. [PubMed] [Google Scholar]
- Buckner RL, Vincent JL. Unrest at rest: Default activity and spontaneous network correlations. NeuroImage. 2007;37(4):1091–1096. doi: 10.1016/j.neuroimage.2007.01.010. doi:10.1016/j.neuroimage.2007.01.010. [DOI] [PubMed] [Google Scholar]
- Buzsaki G, Draguhn A. Neuronal oscillations in cortical networks. Science. 2004;304:1926–1929. doi: 10.1126/science.1099745. Retrieved from PM:15218136. [DOI] [PubMed] [Google Scholar]
- Cohen MR, Kohn A. Measuring and interpreting neuronal correlations. Nature Neuroscience. 2011;14(7):811–819. doi: 10.1038/nn.2842. doi:10.1038/nn.2842. [DOI] [PMC free article] [PubMed] [Google Scholar]
- Crone N, Boatman D, Gordon B, Hao L. Induced electrocorticographic gamma activity during auditory perception. Clinical Neurophysiology. 2001 doi: 10.1016/s1388-2457(00)00545-9. Retrieved from http://www.ncbi.nlm.nih.gov/entrez/query.fcgi?db=pubmed&cmd=Retrieve&dopt=AbstractPlus&list_uids=15166876286328992102related:ZnHv9p-Re9IJ/nhttp://linkinghub.elsevier.com/retrieve/pii/S1388245700005459. [DOI] [PubMed]
- Crone NE, Korzeniewska A, Franaszczuk PJ. Cortical gamma responses: Searching high and low. International Journal of Psychophysiology. 2011 doi: 10.1016/j.ijpsycho.2010.10.013. doi:10.1016/j.ijpsycho.2010.10.013. [DOI] [PMC free article] [PubMed] [Google Scholar]
- Cybulski TR, Glaser JI, Marblestone AH, Zamft BM, Boyden ES, Church GM, Kording KP. Spatial Information in Large-Scale Neural Recordings. bioRxiv. 2014 doi: 10.3389/fncom.2014.00172. doi:10.1101/002923. [DOI] [PMC free article] [PubMed] [Google Scholar]
- Donner TH, Siegel M. A framework for local cortical oscillation patterns. Trends in Cognitive Sciences. 2011 doi: 10.1016/j.tics.2011.03.007. doi:10.1016/j.tics.2011.03.007. [DOI] [PubMed] [Google Scholar]
- Edwards E, Nagarajan SS, Dalal SS, Canolty RT, Kirsch HE, Barbaro NM, Knight RT. Spatiotemporal imaging of cortical activation during verb generation and picture naming. NeuroImage. 2010;50(1):291–301. doi: 10.1016/j.neuroimage.2009.12.035. doi:10.1016/j.neuroimage.2009.12.035. [DOI] [PMC free article] [PubMed] [Google Scholar]
- Edwards E, Soltani M, Kim W, Dalal SS, Nagarajan SS, Berger MS, Knight RT. Comparison of time-frequency responses and the event-related potential to auditory speech stimuli in human cortex. Journal of Neurophysiology. 2009;102(1):377–386. doi: 10.1152/jn.90954.2008. doi:10.1152/jn.90954.2008. [DOI] [PMC free article] [PubMed] [Google Scholar]
- Elston GN. Cortex, Cognition and the Cell: New Insights into the Pyramidal Neuron and Prefrontal Function. Cerebral Cortex. 2003 doi: 10.1093/cercor/bhg093. doi:10.1093/cercor/bhg093. [DOI] [PubMed] [Google Scholar]
- Engel AK, Fries P. Beta-band oscillations-signalling the status quo? Current Opinion in Neurobiology. 2010 doi: 10.1016/j.conb.2010.02.015. doi:10.1016/j.conb.2010.02.015. [DOI] [PubMed] [Google Scholar]
- Flinker A, Chang EF, Barbaro NM, Berger MS, Knight RT. Sub-centimeter language organization in the human temporal lobe. Brain and Language. 2011;117:103–109. doi: 10.1016/j.bandl.2010.09.009. doi:10.1016/j.bandl.2010.09.009. [DOI] [PMC free article] [PubMed] [Google Scholar]
- Freeman WJ, Rogers LJ, Holmes MD, Silbergeld DL. Spatial spectral analysis of human electrocorticograms including the alpha and gamma bands. Journal of Neuroscience Methods. 2000;95:111–121. doi: 10.1016/s0165-0270(99)00160-0. doi:10.1016/S0165-0270(99)00160-0. [DOI] [PubMed] [Google Scholar]
- Fries P, Nikolić D, Singer W. The gamma cycle. Trends in Neurosciences. 2007 doi: 10.1016/j.tins.2007.05.005. doi:10.1016/j.tins.2007.05.005. [DOI] [PubMed] [Google Scholar]
- Fukushima M, Saunders RC, Leopold DA, Mishkin M, Averbeck BB. Spontaneous High-Gamma Band Activity Reflects Functional Organization of Auditory Cortex in the Awake Macaque. Neuron. 2012;74(5):899–910. doi: 10.1016/j.neuron.2012.04.014. doi:10.1016/j.neuron.2012.04.014. [DOI] [PMC free article] [PubMed] [Google Scholar]
- Garofolo J. TIMIT Acoustic-Phonetic Continuous Speech Corpus LDC93S1. 1993 [Google Scholar]
- Kajikawa Y, Schroeder CE. How local is the local field potential? Neuron. 2011;72:847–858. doi: 10.1016/j.neuron.2011.09.029. doi:10.1016/j.neuron.2011.09.029. [DOI] [PMC free article] [PubMed] [Google Scholar]
- Katzner S, Nauhaus I, Benucci A, Bonin V, Ringach DL, Carandini M. Local Origin of Field Potentials in Visual Cortex. Neuron. 2009;61:35–41. doi: 10.1016/j.neuron.2008.11.016. doi:10.1016/j.neuron.2008.11.016. [DOI] [PMC free article] [PubMed] [Google Scholar]
- Kellis S, Miller K, Thomson K, Brown R, House P, Greger B. Decoding spoken words using local field potentials recorded from the cortical surface. Journal of Neural Engineering. 2010;7:056007. doi: 10.1088/1741-2560/7/5/056007. doi:10.1088/1741-2560/7/5/056007. [DOI] [PMC free article] [PubMed] [Google Scholar]
- Kellis S, Sorensen L, Darvas F, Sayres C, O’Neill K, Brown R, Greger B. Multi-scale analysis of neural activity in humans: implications for micro-scale electrocorticography. Clinical Neurophysiology. 2015:1–11. doi: 10.1016/j.clinph.2015.06.002. doi:10.1016/j.clinph.2015.06.002. [DOI] [PubMed] [Google Scholar]
- Kent AR, Grill WM. Analysis of deep brain stimulation electrode characteristics for neural recording. Journal of Neural Engineering. 2014;11:046010. doi: 10.1088/1741-2560/11/4/046010. doi:10.1088/1741-2560/11/4/046010. [DOI] [PMC free article] [PubMed] [Google Scholar]
- Khodagholy D, Gelinas JN, Thesen T, Doyle W, Devinsky O, Malliaras GG, Buzsaki G. NeuroGrid: recording action potentials from the surface of the brain. Nat Neurosci. 2015;18(2):310–315. doi: 10.1038/nn.3905. Retrieved from http://dx.doi.org/10.1038/nn.3905. [DOI] [PMC free article] [PubMed] [Google Scholar]
- Lachaux J-P, Axmacher N, Mormann F, Halgren E, Crone NE. High-frequency neural activity and human cognition: Past, present and possible future of intracranial EEG research. Progress in Neurobiology. 2012 doi: 10.1016/j.pneurobio.2012.06.008. doi:10.1016/j.pneurobio.2012.06.008. [DOI] [PMC free article] [PubMed] [Google Scholar]
- Lempka SF, Johnson MD, Moffitt MA, Otto KJ, Kipke DR, McIntyre CC. Theoretical analysis of intracortical microelectrode recordings. Journal of Neural Engineering. 2011;8:045006. doi: 10.1088/1741-2560/8/4/045006. doi:10.1088/1741-2560/8/4/045006. [DOI] [PMC free article] [PubMed] [Google Scholar]
- Leski S, Lindén H, Tetzlaff T, Pettersen KH, Einevoll GT. Frequency Dependence of Signal Power and Spatial Reach of the Local Field Potential. PLoS Computational Biology. 2013;9(7) doi: 10.1371/journal.pcbi.1003137. doi:10.1371/journal.pcbi.1003137. [DOI] [PMC free article] [PubMed] [Google Scholar]
- Leuthardt EC, Freudenberg Z, Bundy D, Roland J. Microscale recording from human motor cortex: implications for minimally invasive electrocorticographic brain-computer interfaces. Neurosurgical focus E10. 2009 doi: 10.3171/2009.4.FOCUS0980. 27. doi:10.3171/2009.4.FOCUS0980. [DOI] [PMC free article] [PubMed] [Google Scholar]
- Miller KJ, Leuthardt EC, Schalk G, Rao RPN, Anderson NR, Moran DW, Ojemann JG. Spectral changes in cortical surface potentials during motor movement. The Journal of Neuroscience : The Official Journal of the Society for Neuroscience. 2007;27(9):2424–2432. doi: 10.1523/JNEUROSCI.3886-06.2007. doi:10.1523/JNEUROSCI.3886-06.2007. [DOI] [PMC free article] [PubMed] [Google Scholar]
- Pesaran B. Uncovering the Mysterious Origins of Local Field Potentials. Neuron. 2009 doi: 10.1016/j.neuron.2008.12.019. doi:10.1016/j.neuron.2008.12.019. [DOI] [PubMed] [Google Scholar]
- Pesaran B. Neural correlations, decisions, and actions. Current Opinion in Neurobiology. 2010 doi: 10.1016/j.conb.2010.03.003. doi:10.1016/j.conb.2010.03.003. [DOI] [PMC free article] [PubMed] [Google Scholar]
- Ray S, Crone NE, Niebur E, Franaszczuk PJ, Hsiao SS. Neural correlates of high-gamma oscillations (60-200 Hz) in macaque local field potentials and their potential implications in electrocorticography. The Journal of Neuroscience : The Official Journal of the Society for Neuroscience. 2008;28:11526–11536. doi: 10.1523/JNEUROSCI.2848-08.2008. doi:10.1523/JNEUROSCI.2848-08.2008. [DOI] [PMC free article] [PubMed] [Google Scholar]
- Slutzky MW, Jordan LR, Krieg T, Chen M, Mogul DJ, Miller LE. Optimal spacing of surface electrode arrays for brain-machine interface applications. Journal of Neural Engineering. 2010;7:26004. doi: 10.1088/1741-2560/7/2/026004. doi:10.1088/1741-2560/7/2/026004. [DOI] [PMC free article] [PubMed] [Google Scholar]
- Viventi J, Kim D-H, Vigeland L, Frechette ES, Blanco JA, Kim Y-S, Litt B. Flexible, foldable, actively multiplexed, high-density electrode array for mapping brain activity in vivo. Nature Neuroscience. 2011 doi: 10.1038/nn.2973. doi:10.1038/nn.2973. [DOI] [PMC free article] [PubMed] [Google Scholar]
- Wang W, Degenhart AD, Collinger JL, Vinjamuri R, Sudre GP, Adelson PD, Weber DJ. Human motor cortical activity recorded with Micro-ECoG electrodes, during individual finger movements; Conference Proceedings : … Annual International Conference of the IEEE Engineering in Medicine and Biology Society. IEEE Engineering in Medicine and Biology Society. Annual Conference; 2009. pp. 586–9. doi:10.1109/IEMBS.2009.5333704. [DOI] [PMC free article] [PubMed] [Google Scholar]
- Wodlinger B, Degenhart AD, Collinger JL, Tyler-Kabara EC, Wang W. The impact of electrode characteristics on electrocorticography (ECoG); Proceedings of the Annual International Conference of the IEEE Engineering in Medicine and Biology Society, EMBS; 2011. pp. 3083–3086. doi:10.1109/IEMBS.2011.6090842. [DOI] [PubMed] [Google Scholar]
- Womelsdorf T, Fries P. The role of neuronal synchronization in selective attention. Current Opinion in Neurobiology. 2007 doi: 10.1016/j.conb.2007.02.002. doi:10.1016/j.conb.2007.02.002. [DOI] [PubMed] [Google Scholar]
- Wrench A. The MOCHA-TIMIT articulatory database. 1999 [Google Scholar]
- Xing D, Yeh C-I, Shapley RM. Spatial spread of the local field potential and its laminar variation in visual cortex. The Journal of Neuroscience : The Official Journal of the Society for Neuroscience. 2009;29:11540–11549. doi: 10.1523/JNEUROSCI.2573-09.2009. doi:10.1523/JNEUROSCI.2573-09.2009. [DOI] [PMC free article] [PubMed] [Google Scholar]