Abstract
Cigarette smoke exposure (CSE) during gestation and early development suppresses the growth trajectory in offspring. In prior studies utilizing a mouse model of ‘active’ developmental CSE (GD1-PD21), low birth weight induced by CSE persisted throughout the neonatal period and was present at the cessation of exposure at weaning with proportionally smaller kidney mass that was accompanied by impairment of carbohydrate metabolism. In the present study, littermates of those characterized in the prior study were maintained until 6 months of age at which time the impact of developmental CSE on the abundance of proteins associated with cellular metabolism in the kidney was examined. Kidney protein abundances were examined by 2D-SDS-PAGE based proteome profiling with statistical analysis by Partial Least Squares-Discriminant Analysis. Key findings of this study include a persistence of impact of developmental CSE past the original exposure period on the nucleic acid and carbohydrate metabolism networks and oxidant scavenging pathways.
Keywords: developmental cigarette smoke exposure, CSE, proteome, kidney, mouse, inhalation, tobacco
1. INTRODUCTION
Cigarette smoke is a complex mixture composed of the addictive stimulant nicotine as well as toxic gases such as carbon monoxide, pesticides, metals, and highly reactive small molecules such as acrolein [1–10]. 'Active' cigarette smoke consumption in adults impairs kidney function with an impact on hypertension, diabetes, and cardiovascular disease [11–15]. Despite extensive public health campaigns including product warning labels, nearly one-fifth of US women continue to smoke cigarettes during pregnancy [16–22]. Exposure of the fetus to toxic cigarette smoke results in an attendant increase in the risk of miscarriage, stillbirth, fetal intrauterine growth retardation, and low birth weight with an increased risk of ear infections, respiratory diseases, allergy/atopy, deficit/hyperactivity disorders, aggressiveness, neurocognitive delays and decreased cardiovascular health during early childhood [23–25]. At maturity, adults exposed to developmental cigarette smoke are at an increased risk of metabolic syndrome, cardiovascular disease and obesity [4, 26–29].
Similarly, in animal models, developmental cigarette smoke exposure (CSE) induces cardiovascular disease, hypertension, and a predisposition to obesity with a high fat diet challenge [30–33]. The putative link between developmental CSE and adult onset hypertension and cardiovascular disease may be attributed in part to a mild structural dysmorphology and proportionally smaller kidney size, which when coupled to obesity results in nephron hyperfiltration [34–37]. Obesity related glomerulopathy is exacerbated by reductions in nephron mass which together with obesity-induced changes in renal hemodynamics synergistically contributes to the development of glomerulopathy [38, 39]
It has been proposed that underlying metabolic dysfunction contributes to the propensity for adult onset disease in offspring developmentally exposed to cigarette smoke [30, 33, 40–43]. In our prior study of the impact of developmental CSE on kidney proteome profiles at weaning in a murine model of 'active' exposure that spanned gestation day 1 through postnatal day 21, we identified several metabolic pathways including glucose metabolism that were altered at a time point immediately after the cessation of exposure [41]. Parallel reports on the impact of this exposure paradigm on the liver and hippocampus proteomes, in the same offspring also at weaning, again identified impairment of glucose and small molecule metabolic pathways [44, 45] The study of the long term impact of developmental cigarette smoke exposure is herein presented as three manuscripts each detailing tissue-specific toxicity (liver, kidney, hippocampus [46–48]) of systemic exposure while a fourth manuscript detailing behavioral abnormalities in these identical offspring was previously presented [49]. The present manuscript examines whether the impact of developmental CSE on the kidney proteome, specifically on the expression of metabolic proteins, persists past the withdrawal of exposure and into maturity. In future studies, we will examine the impact of dietary challenge following developmental cigarette smoke exposure on tissue-specific metabolic function.
2. MATERIALS AND METHODS
2.1. Animal Exposure
Detailed descriptions of the experimental methodology can be found within the lead manuscript (liver proteome profiles [47]) for the present series of reports of sustained toxicity of developmental exposure to cigarette smoke. An abbreviated methodology section follows.
Adult C57B/6J mice were purchased from Jackson Labs (Bar Harbor, ME). Animals were housed and maintained (12 hour light/dark cycle; Purina LabDiet 5015) at the University of Louisville Research Resources Center. Female mice were age-matched at the outset of the study and timed pregnancies were obtained by overnight mating of a single mature male with two nulliparous females. The presence of a vaginal plug was considered evidence of mating and the time designated as gestational day 1 (GD1). Pregnant mice were weighed and randomly assigned to either the Sham-exposure (Sham n=9) or Cigarette Smoke Exposure (CSE; n=9) groups. Animals were exposed from GD1 throughout the entirety of gestation, and following parturition were exposed with offspring until PD21.
Cigarette smoke was generated from Philip Morris Marlboro Red brand cigarettesTM (Philip Morris; Richmond, VA; 15mg of tar/cigarette; 1.1mg nicotine/cigarette; additives), selected since it represents the most popular brand of cigarettes consumed among 18-25 year olds - the age group containing the majority of maternal smokers [50–53]. Cigarettes were smoked using the standard Federal Trade Commission method: a two second, 35 cm3 puff, once a minute for a total of 9 min [54]. For quality control purposes, dual exposure chambers (one receiving cigarette smoke and one receiving ambient air) were characterized twice during each daily exposure session for: total suspended particulates (TSP), temperature, carbon monoxide levels, and humidity.
At cessation of exposure on PD21, offspring were either euthanized for tissue collections or maintained into maturity for behavioral phenotyping at the Cincinnati Children’s Research Foundation Animal Behavioral Core [49]. At approximately 6 months of age, male offspring were euthanized by CO2 asphyxiation followed by cervical dislocation [49]. Blood was collected and tissues excised, rinsed in saline, and frozen at −800C until analysis. Individual kidney wet weights collected from randomly selected single male offspring representing individual litters in each group (n=9 for Sham and n=8 for CSE - note one kidney weight from CSE cohort is unavailable) were averaged and reported in Figure 1.
Figure 1. Kidney tissue wet weights were reduced at 6 months of age following developmental exposure to cigarette smoke (GD1-PD21).
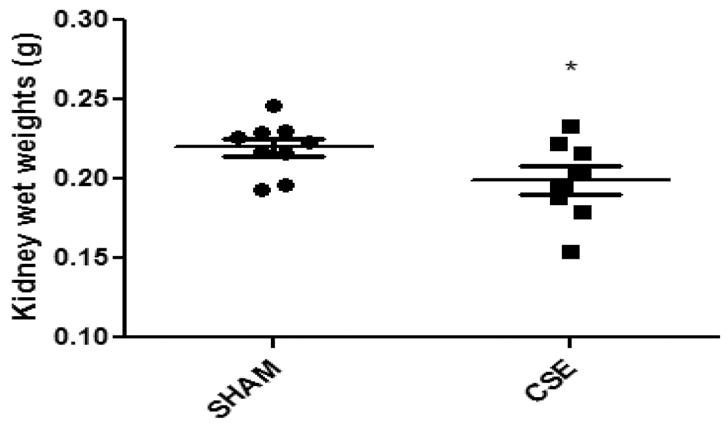
Kidneys from offspring exposed to either filtered air (SHAM, n=9) or a protocol of "active" cigarette smoking (CSE, n=8) during development were weighed following animal euthanization at 6 months of age (*p<0.05). Long horizontal lines indicate mean weight, with the standard deviation represented by the shorter horizontal bars.
2.2. 2D-SDS-PAGE
The upper section of a single right kidney (~0.15 g) from 9 offspring per group, each offspring representing an individual litter, was homogenized in 7M urea, 2M thiourea, and 40mM dithiothreitol (DTT). 400 μg of protein (Bradford assay; Bradford 1976) was separated by isoelectric focusing followed by SDS-PAGE on 12% gels at 65 V for 18 hours with cooling. Gels were stained for 3 days in Colloidal Coomassie Blue G-250 solution followed by water washes until a clear background was attained.
2.3. Image Analysis
Densitometric analysis of gel images (transmission scanning with Epson Expression 10000XL; 16-bit grayscale) was performed with Progenesis SameSpots software (Nonlinear Dynamics; New Castle-on-Tyne, UK). Spot patterns were aligned with manual (~20 per gel representing 4 zones) and automatic seeds (~150 per gel). Protein spots were detected automatically. For each protein spot, intensity was measured, background subtracted, and spot pixel density normalized against total pixel density of all spots on each individual gel. Spots with less than or equal to an average normalized pixel depth of 4000 were designated as noise and not included in the analysis. The averaged normalized spot abundances for each spot on gels from the CSE group were compared to the averaged normalized aligned spot from gels of the Sham group.
2.4. Statistical Analysis
Analysis of Variance (ANOVA, two way, p<0.05 as significant) and a series of Partial Least Squares-Discriminant Analysis (PLS-DA) models were utilized to determine the protein spots which differed in intensity and described the differences between the groups. Multiple PLS-DA models were constructed utilizing Variable Importance in Projection (VIP)-ranked protein spots of interest with recursive feature elimination identifying protein spots with VIP≥1.75 as important in defining the separation between groups. All protein spots included in further analysis were significantly different between groups based on ANOVA (p<0.05).
2.5. Identification of Protein Spots
Protein spots were excised and destained then dehydrated in acetonitrile (ACN), dried, rehydrated with 10 ng/μl trypsin suspended in 40mM NH4HCO3, and digested at room temperature overnight. The mass to charge ratio of peptides was determined by LTQ-MS/MS with collision induced dissociation for structural feature identification. Peptide identification was performed with the Mascot (Matrix Sciences v 2.2.2) search algorithm utilizing the NCBInr (with decoy) database (updated Jan 4, 2011). Search parameters included: mammalian class; minimum of two peptide sequence hits with individual MOWSE (MOlecular Weight SEarch) probability scores greater than 45, up to 2 missed cleavages, variable carbamidomethyl C modification, enzyme trypsin/P, and peptide charge of 1+, 2+, or 3+ permitted. A total MOWSE protein probability score greater than 60 was considered acceptable [55].
2.6. Ingenuity® Pathway Analysis (IPA)
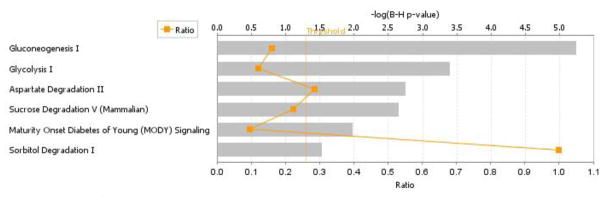
Proteins of interest as determined by PLS-DA modeling and VIP ranking were loaded into the Ingenuity® Pathway Analysis search algorithm to determine metabolic pathways impacted (Ingenuity Systems, 2016). Proteins that represented the predominant contribution to the spot intensity, as determined by a minimum of 200% of the MOWSE score of the next ranked protein identified, were included. Networks of interactions between the proteins and biological pathways were generated with sub-categorization by increased or decreased abundance. For the canonical pathways analysis, the following settings were employed: Benjamin-Hochberg p-value greater than or equal to 1.5, a threshold of 0.5 z-score, and a Benjamin-Hochberg Multiple Testing Correction p-value utilized for scoring. In the associated figure (Figure 5), solid lines indicated a direct interaction while dotted lines indicate an indirect interaction. Geometric shapes identify classes of proteins: phosphatases (triangle), kinases (inverted triangle), enzymes (vertical diamond), transcription regulators (horizontal ellipse), transporters (trapezoid), and other important molecules (circles).
Figure 5. The top six ranked protein interaction networks and pathways impacted within the liver of adult offspring who were previously developmentally exposed to cigarette smoke.
The distance from the threshold value (vertical, orange line) depicts the intensity of change between Sham exposure and CSE groups.
2.7. Western Blot
Twenty-five μg of total kidney protein homogenates were mixed 1:1 with Laemmli buffer (0.25M Tris pH 6.8, glycerol, 10% SDS, bromophenol blue trace) then heated at 70° C for 10 minutes and separated by 10% PAGE for 2 hours at a 100V in Tris-glycine run buffer (0.025 M Tris Base, 0.192 M glycine, 0.1% SDS). Electrophoretic transfer to PVDF membrane was followed by blocking and incubated overnight at 4°C with primary antibody diluted 1:500 in non-fat dry milk (SIRT1, sc-19857; PEPCK, sc-271029; PGC1α, sc-13067; Santa Cruz Biotechnology, Dallas, TX). Blots were incubated with secondary antibody complexed to horseradish peroxidase (1:1000, Santa Cruz Biotechnology, Dallas, TX) diluted in non-fat dry milk at room temperature for 1 hour. The reaction to chemiluminescence substrate was visualized then the blots were stripped and incubated with β-actin primary antibody (1:1000 dilution; sc-81173, Santa Cruz Biotechnology, Dallas TX) followed by secondary antibody incubation and visualization as described above [56].
2.8. Glutathione-S-Transferase (GST) and Glutathione Reductase (GR) Assay
Liver GST activity was measured as an indicator of detoxification activity [57]. The total GST activity of the liver was measured using the enzyme driven conjugation of 1-chloro-2, 4-dinitrobenzene (CDNB) to reduced glutathione (absorbance read at 340 nm each minute for 15 minutes; Cayman Chemical Company). The absorbance per minute was divided by amount of protein (mg) to determine the specific activity for each sample [58]. Glutathione reductase activity was measured spectrophotometrically by mixing an aliquot of tissue homogenate with GSSG and measuring the GST enzyme driven conjugation to 1-chloro-2,4-dinitrobenzene (CDNB) to reduced glutathione (absorbance read at 340 nm each minute for 15 minutes; Cayman Chemical Company) [59].
3. RESULTS
3.1. Exposure Conditions and Offspring Weights
Mean CO and TSP levels in the cigarette smoke exposure chamber were 138 ± 19.8 ppm and 25.4 ± 6.5 mg/m3, respectively with measures in the Sham group found to be less than the limit of detection for each assay [44]. Cotinine, a metabolite of nicotine, was used as a measure of CSE dose. Cotinine levels were greater than 50ng/mL in the CSE group indicating an 'active' exposure model with Sham exposure cotinine levels below the detection limit of 4 ng/mL. Low birth weight was evident in the CSE offspring (~15% decrease relative to) [44] with persistence of decrements in weight throughout weaning and into maturity (maintenance on Purina 5015 diet) [49]. As shown in Figure 1, decreased individual averaged kidney wet weights in the CSE offspring (~10% reduction, p=0.04) were evident at maturity. This reduction in kidney tissue weight in the CSE group was proportional to the reduction in animal weight measured at the time of cognitive and behavioral assessment and therefore likely reflects a generalized proportional decrease in organism weight rather than kidney specific reductions in mass [49].
3.2. Kidney Proteome Profiles
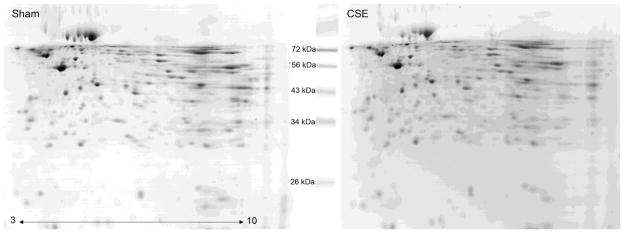
As shown in Figure 2, 2D-SDS-PAGE gels of kidney proteins from Sham and CSE mice were similar in total pixel density (Sham, 683905790 ± 29812764; CSE, 647331403 ± 34439370; p>0.05) at 6 months of age (~5 months since cessation of exposure to cigarette smoke) indicating that the variances in individual protein spot abundance were the relevant outcome rather than an over- or under-expression of total protein within the kidney of CSE offspring. The proteins on the gels spanned an isoelectric focusing range of pH 3 to 10, with the acidic proteins on the left and the basic proteins on the right of the gel image and descending molecular weights ranging from ~80 kDa to ~11 kDa. Varying protein spot abundances were the predominant difference between groups. Variations in individual gel images included minor deviations in pI and MW coordinates for assigned spots that were then aligned with 5 seed spots within the image analysis program.
Figure 2. Side-by-side comparison of protein spot patterns of kidney from the Sham and developmental CSE groups.
A side-by-side comparison of kidney protein spot separation based on isoelectric focusing point (horizontal) and molecular weight (vertical) in the two experimental groups (Sham-left; CSE-right). The gels are similar with regard to the number of spots without the appearance or loss of spots between groups.
3.3. Partial Least Squares - Discriminant Analysis
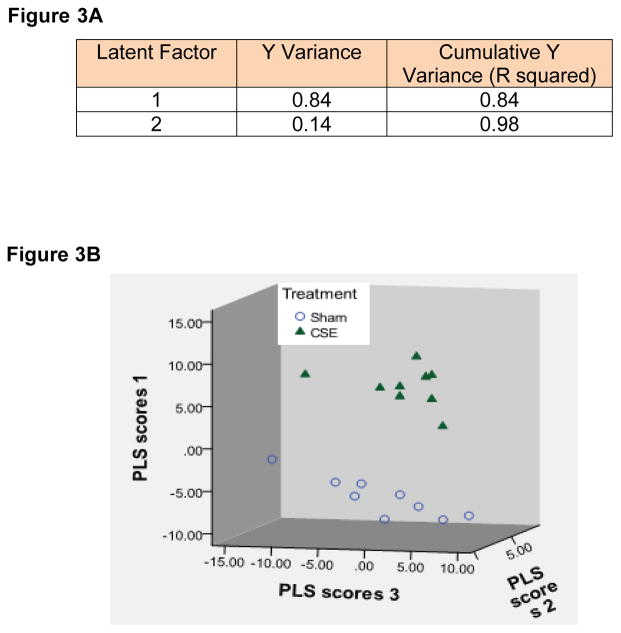
Iterative PLS-DA models were generated encompassing spot abundances of all proteins not determined to be noise with sequential removal of VIP-ranked protein spots contributing to the separation of groups and re-plotting of group separation until the loss of separation of groups was evident. Sixty-two protein spots (VIP≥1.5) were found to contribute to the separation in proteome profiles between the Sham and CSE groups. As shown in Figure 3A, when the abundances of all protein spots was included (noise excluded) the first latent factor accounted for 84% of the variance between the Sham and CSE groups and the second latent factor accounted for an additional 14% of the variance. As shown in Figure 3B, the combined descriptor representing individual protein spot abundances that comprise the proteome profiles of the Sham and CSE groups are distinct. The separation between the groups is depicted by graphing latent factors 1, 2 and 3.
Figure 3.
Figure 3A: Variable importance in projection. Protein spots present on gels from the Sham and developmental CSE groups were analyzed by PLS-DA (n=9 per group, biological replicates). Description of the separation of groups by latent factors found that 99% of the variance between groups could be described by two latent factors.
Figure 3B: Plotting latent factors from the PLS-DA model shows differences in the kidney protein spot patterns of the Sham and developmental CSE groups at 6 months of age. All protein spots (excluding noise) were included in the calculation of VIP rankings and the graphing of the separation of groups by latent factors.
3.4. Proteins Impacted by CSE
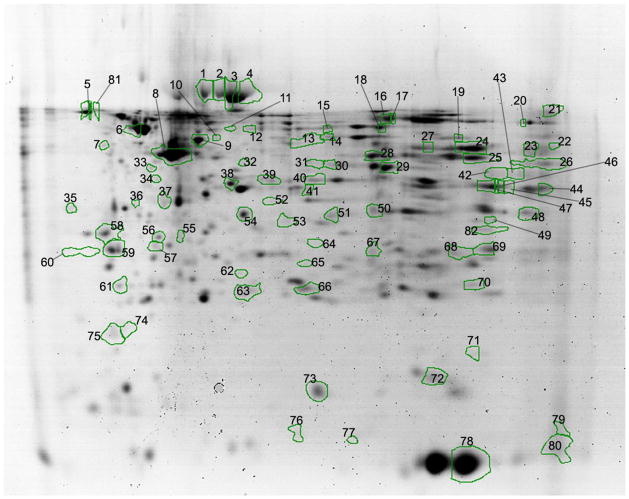
In Figure 4, a 2D-SDS-PAGE protein spot map is shown with numbers labeling the 62 protein spots identified as describing the separation between the Sham and CSE groups based on VIP>1.75 rankings as determined by Partial Least Squares-Discriminant Analysis. All proteins with p≤0.10 are also labeled in the figure as well as several protein spots used as markers that were not designated as altered in the kidney several months after withdrawal of CSE. For several spots (n=15), more than one protein was identified indicating that a mixture of proteins with similar isoelectric focusing point and molecular weight were present within the spot. Proteins that represent the predominant contribution to the spot intensity (as determined by a minimum of 200% of the MOWSE score of the next ranked protein identified) were included in the putative identification of nodes of interest within the networks impacted by developmental CSE see Tables 1 and 2). Of the 15 spots composed of multiple proteins (the intensity of 6 spots decreased, and that of 9 spots increased), a dominant protein attributed to the spot could be identified and was included in the Ingenuity® Pathway Analysis. The spots with multiple proteins present, but in which a dominant protein could be identified include: Spots 18, 23, 28, 38, 48, 66. The analysis did not include proteins from Spot 30 (and similar spots) since the relative MOWSE scores for identification of the multiple proteins within the spot were similar and therefore a single likely candidate for alteration in abundance could not be identified. In Spot 18, both proteins identified were aldehyde dehydrogenase family members and thus it was included in the analysis.
Figure 4. Kidney proteome profiles of 6 month old offspring previously developmentally exposed to cigarette smoke.
The proteins with altered abundance that contributed to the separation of the groups within the PLS-DA model and possessed the highest VIP values (≥1.75) are numbered (as well as a limited selection of unaltered proteins) Refer to Tables 1–3, for a listing of proteins identified in each spot.
Table 1. Identification of proteins from spots with decreased abundance that contributed to the separation of kidney proteome profiles of mature offspring previously exposed to cigarette smoke throughout development (GD1-PD21) [PLS-DA model, VIP values (≥1.75)].
VIP (Variable Importance in Projection); GI Number (NCBI protein sequence GenInfo Identifier ).
| Spot | GI Number | Abbreviation1 | Name | VIP | Percent Change |
|---|---|---|---|---|---|
| 1 | 435838 | mortalin mot-1=hsp70 homolog cytosolic form | 1.78 | 21 | |
| 2 | 163310765 | albumin | 1.80 | 27 | |
| 3 | 163310765 | albumin | 1.48 | 19 | |
| 13 | No ID | 1.45 | 38 | ||
| 15 | No ID | 1.42 | 15 | ||
| 30 | 9789985 13195624 |
isovaleryl coenzyme A dehydrogenase NADH dehydrogenase (ubiquinone) 1 alpha subcomplex 10 |
1.99 | 25 | |
| 40 | No ID | 1.67 | 20 | ||
| 42 | 15723268 | ALDOB | fructose-bisphosphate aldolase B | 1.99 | 46 |
| 43 | 21450291 22267442 |
ALDOB | aldolase B, fructose-bisphosphate ubiquinol cytochrome c reductase core protein 2 |
2.11 | 45 |
| 45 | 62653546 | PREDICTED: similar to glyceraldehyde-3- phosphate dehydrogenase | 1.73 | 25 | |
| 46 | 6679937 | GAPDH | glyceraldehyde-3-phosphate dehydrogenase | 2.09 | 40 |
| 47 | 6679937 | GAPDH | glyceraldehyde-3-phosphate dehydrogenase | 2.31 | 40 |
| 49 | No ID | 1.60 | 47 | ||
| 51 | 7949037 63100260 6755965 17921976 |
enoyl coenzyme A hydratase 1, peroxisomal mercaptopyruvate sulfurtransferase voltage-dependent anion channel 2 3-hydroxyanthranilate 3,4-dioxygenase |
1.58 | 16 | |
| 53 | No ID | 1.56 | 19 | ||
| 58 | 13928824 5902663 |
YWHAE | tyrosine 3-monooxygenase/tryptophan 5- monooxygenase activation protein elongation factor 1-beta homolog | 1.46 | 30 |
| 59 | 6756041 | YWHAZ | tyrosine 3-monooxygenase/tryptophan 5- monooxygenase activation protein, zeta polypeptide | 2.22 | 29 |
| 64 | No ID | 1.98 | 20 | ||
| 65 | No ID | 1.59 | 19 | ||
| 66 | 84871986 55741460 |
glutathione peroxidase 1 parkinson disease protein 7 |
1.78 | 11 | |
| 69 | 38142460 | ETFB | electron transferring flavoprotein, beta polypeptide | 2.00 | 25 |
| 71 | 6680924 | Cofilin/CFL1 | cofilin 1, non-muscle | 2.00 | 44 |
| 73 | 226471 | Cu/Zn superoxide dismutase | 1.96 | 10 | |
| 74 | 11935049 154937382 127527 |
cytokeratin 2 myosin, light chain 9, regulatory major urinary protein 2 |
1.54 | 22 | |
| 77 | 33468857 | HINT1 | histidine triad nucleotide binding protein 1 | 1.77 | 22 |
| 79 | 229301 | hemoglobin beta | 1.82 | 37 | |
| 81 | 6680836 | CALR | calreticulin | 1.72 | 32 |
Denotes abbreviation used in Figure 6.
Table 2. Identification of proteins from spots with increased abundance that contributed to the separation of kidney proteome profiles of mature offspring previously exposed to cigarette smoke throughout development (GD1-PD21) [PLS-DA model, VIP values (≥1.75)].
VIP (Variable Importance in Projection); GI Number (NCBI protein sequence GenInfo Identifier ). Corresponds to Figure 1.
| Spot | GI Number | Abbreviation 1 | Name | VIP | Percent Change |
|---|---|---|---|---|---|
| 4 | 163310765 | ALB* | albumin | 1.96 | 64 |
| 5 | No ID | 2.14 | 101 | ||
| 6 | No ID | 1.65 | 13 | ||
| 8 | 6425087 | ACTG1 | gamma actin-like protein | 1.89 | 12 |
| 9 | 14548301 | cytochrome b-c1 complex subunit 1, mitochondrial | 1.43 | 9 | |
| 10 | No ID | 1.72 | 19 | ||
| 16 | No ID | 1.46 | 31 | ||
| 17 | 19527258 | aldehyde dehydrogenase family 6, subfamily A1 | 1.8 | 36 | |
| 18 | 78099319 6753036 |
aldehyde dehydrogenase family 9 member A1 mitochondrial aldehyde dehydrogenase 2 |
1.33 | 31 | |
| 20 | 148677501 | ATP5A1 | ATP synthase, H+ transporting, mitochondrial F1 complex, alpha subunit, isoform 1, isoform CRA_e | 1.58 | 126 |
| 21 | No ID | 1.78 | 65 | ||
| 22 | No ID | 1.66 | 173 | ||
| 23 | 12003362 22267442 6996911 |
IDH2 | NADP+-specific isocitrate dehydrogenase ubiquinol cytochrome c reductase core protein 2 argininosuccinate synthetase 1 |
1.66 | 105 |
| 25 | 21450129 | ACAT1 | acetyl-Coenzyme A acetyltransferase 1 precursor | 1.51 | 19 |
| 26 | 6754036 | GOT2 | glutamate oxaloacetate transaminase 2, mitochondrial | 1.48 | 37 |
| 28 | 9789985 21450129 |
isovaleryl coenzyme A dehydrogenase acetyl-Coenzyme A acetyltransferase 1 precursor |
1.87 | 18 | |
| 29 | 22128627 | sorbitol dehydrogenase | 2.11 | 28 | |
| 31 | No ID | 1.60 | 16 | ||
| 32 | No ID | 1.79 | 42 | ||
| 33 | 11132435 | galactose kinase | 1.41 | 20 | |
| 34 | No ID | 1.57 | 20 | ||
| 35 | 31982300 | hemoglobin, beta adult major chain | 1.27 | 110 | |
| 36 | 6753060 155369696 |
ANXA5 | annexin A5 hypothetical protein LOC683313 | 1.51 | 19 |
| 37 | 31982632 | ATP5B | aspartoacylase 3 | 1.75 | 24 |
| 1374715 | ATP synthase beta subunit | ||||
| 38 | 19525729 11560131 |
crystallin, lambda 1 dimethylarginine dimethylaminohydrolase 1 |
1.51 | 10 | |
| 39 | 9506589 | FBP1 | fructose-1,6-bisphosphatase 1 | 1.47 | 12 |
| 44 | 31982186 6679937 |
MDH2 | malate dehydrogenase 2, NAD (mitochondrial) glyceraldehyde-3-phosphate dehydrogenase |
1.61 | 73 |
| 48 | 6755963 13385680 |
VDAC1 | voltage-dependent anion channel 1 2,4-dienoyl CoA reductase 1 | 2.14 | 80 |
| 54 | 31982229 | ketohexokinase | 1.44 | 12 | |
| 55 | 6680019 | GCLM | glutamate-cysteine ligase, modifier subunit | 2.06 | 20 |
| 56 | 15617203 | chloride intracellular channel 1 | 2.07 | 22 | |
| 57 | 1374715 | ATP5B | ATP synthase beta subunit | 1.51 | 21 |
| 60 | No ID | 1.31 | 33 | ||
| 62 | No ID | 1.62 | 23 | ||
| 63 | 2673845 17389257 6754976 |
GPX1 | glutathione peroxidase cytidine monophosphate (UMP-CMP) kinase 1 peroxiredoxin 1 |
1.68 | 17 |
Denotes abbreviation used in Figure 6.
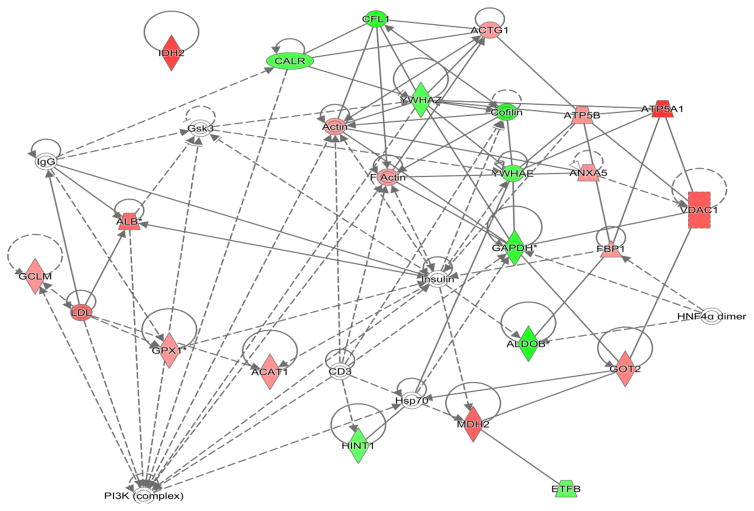
Dominant or single proteins with altered abundance in kidneys of CSE mice were grouped by membership in metabolic networks via IPA analysis. As shown in Figure 5, a majority of proteins with altered abundance in the kidney of 6 month old mice that underwent prior developmental CSE belonged to the nucleic acid metabolism, small molecular biochemistry, and carbohydrate metabolism pathways. Key nodes which may be affected in the adult kidney by developmental CSE include: HNF4α (Hepatocyte nuclear factor 4α) and Insulin. Each of these nodes plays a critical role in regulating glucose utilization.
The kidney proteins listed in Table 1 are decreased in abundance in 6 month old offspring that underwent prior developmental CSE (GD1-PD21). Proteins that are part of the small molecule biochemistry network remain decreased in abundance approximately 5 months after the discontinuation of the smoke exposure. Calreticulin, aldolase B, glyceraldehyde-3-phosphate dehydrogenase, and enoyl coenzyme A hydratase 1 were found to be decreased in abundance in our prior study of the kidney proteome at the time of cessation of developmental CSE and also were found, in the present study, to be decreased in abundance in the previously developmentally exposed kidney at maturity. Two enzymes linked to the nucleic acid metabolism network that were identified in our prior study of the kidney proteome (at the cessation of exposure) also remained decreased in abundance at maturity: aldolase B and glyceraldehyde-3-phosphate dehydrogenase. These proteins, however, retain redundant membership in multiple metabolic networks.
As listed in Table 2, several proteins that are members of the lipid metabolism, small molecule and carbohydrate metabolism pathways were increased in abundance in kidneys of 6 month old offspring (~5 months after cessation of CSE). Lambda crystallin, ATP synthase, H+ transporting, mitochondrial F1 complex, alpha subunit, aldehyde dehydrogenase family, subfamily A1, acetyl-Coenzyme A acetyltransferase 1, glutamate oxaloacetate transaminase 2, sorbitol dehydrogenase, ketohexokinase (also called fructokinase) were found in protein spots with increased abundance. Unaltered proteins that were identified in reference spots (checks of molecular weight and prior study comparison) are listed in Table 3.
Table 3. Identified proteins with no change in abundance and which did not contribute to the separation of kidney proteome profiles of mature offspring previously exposed to cigarette smoke during development (GD1-PD21).
VIP (Variable Importance in Projection); GI Number (NCBI protein sequence GenInfo Identifier).
| Spot | GI Number | Name | VIP |
|---|---|---|---|
| 7 | No ID | 0.08 | |
| 27 | 6647554 | isocitrate dehydrogenase [NADP] cytoplasmic | 0.05 |
| 11 | No ID | 1.36 | |
| 12 | No ID | 1.40 | |
| 14 | 70794816 | hypothetical protein LOC433182 | 1.33 |
| 19 | 21431774 | fumarate hydratase, mitochondrial | 1.44 |
| 24 | 6996911 202423 |
argininosuccinate synthetase 1 phosphoglycerate kinase |
1.38 |
| 41 | No ID | 1.27 | |
| 50 | 13097375 | electron transferring flavoprotein, alpha polypeptide | 1.40 |
| 52 | 387129 | cytosolic malate dehydrogenase | 1.35 |
| 61 | No ID | 1.78 | |
| 67 | No ID | 1.20 | |
| 68 | 29789289 | mitochondrial short-chain enoyl-coenzyme A hydratase 1 | 1.47 |
| 70 | 10092608 | glutathione S-transferase, pi 1 | 1.37 |
| 72 | No ID | 1.27 | |
| 75 | 31542438 | cytochrome b5 type B precursor | 1.27 |
| 76 | 7305599 | transthyretin | 0.09 |
| 78 | 122441 | hemoglobin subunit alpha | 1.42 |
| 80 | 229301 | hemoglobin beta | 1.37 |
| 82 | 6680748 | ATP synthase, H+ transporting, mitochondrial F1 complex, alpha subunit, isoform 1 | 1.31 |
3.5. Carbohydrate Metabolism Impacted by CSE
The top six canonical pathways impacted at 6 months of age in offspring exposed throughout development (GD1-PD21) to cigarette smoke are carbohydrate metabolic pathways which share common members (Figure 6). The abundance of four proteins belonging to the Gluconeogenesis pathway included aldolase B (Spot 43, decreased 45%), fructose-bisphosphate aldolase B (Spot 42, decreased 46%), glyceraldehyde-3-phosphate dehydrogenase (Spots 46 and 47, each decreased 40%), and malate dehydrogenase (Spot 44, increased 73%) were altered in abundance at 6 months of age following developmental cigarette smoke exposure. The Glycolysis pathway shared a decrease in abundance of three of these proteins: aldolase B, fructose-bis-phosphatase, and glyceraldehyde-3-phosphate dehydrogenase. The Sucrose Degradation V pathway included both aldolase B (Spot 42, decreased 46%) as well as ketohexokinase (Spot 54, increased 12%). The Maturity Onset Diabetes of Young signaling pathway included aldolase B and glyceraldehydre-3-phosphate dehydrogenase with the gluconeogenesis/glycolysis pathways. The Sorbitol Degradation I pathway consisted of a single member, sorbitol dehydrogenase (Spot 29, increased 28%). A lack of clear information on directionality of suppression of glucose synthesis/catabolism created challenges in determining whether both pathways were equally suppressed.
Figure 6. Nucleic acid metabolism, small molecule biochemistry, and carbohydrate metabolism pathways in the adult kidney affected by developmental CSE.
Kidney proteins identified as contributing to the separation of groups (Sham exposed and CSE) are shadowed and connected to the network by arrows denoting directionality of interaction. Solid lines indicated a direct interaction while dotted lines indicate an indirect interaction. Geometric shapes identify classes of proteins: phosphatases (triangle), kinases (inverted triangle), enzymes (vertical diamond), transcription regulators (horizontal ellipse), transporters (trapezoid), and other important molecules (circles). Red indicates increased abundance while green indicates decreased abundance in the CSE group. Abbreviations are defined in Tables 1 and 2.
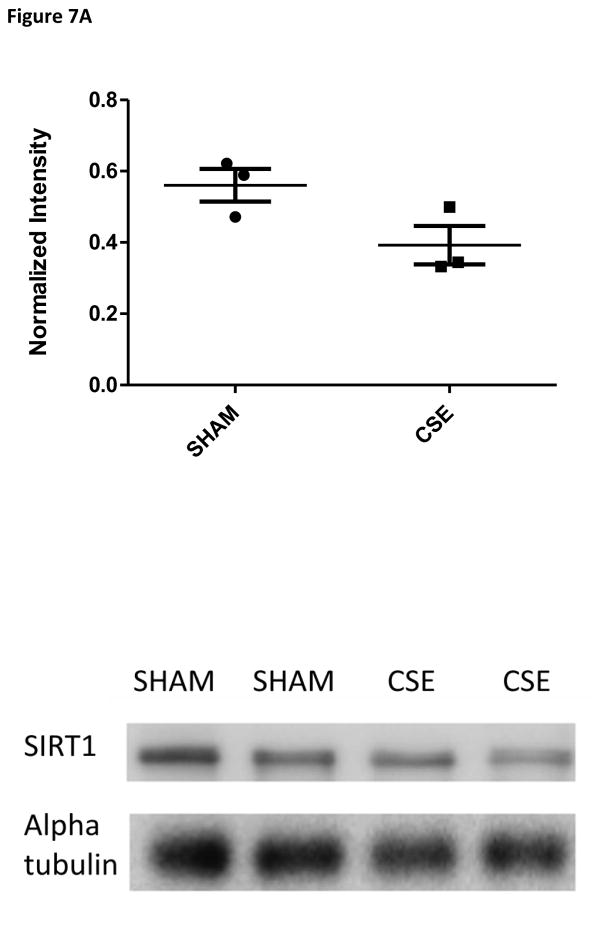
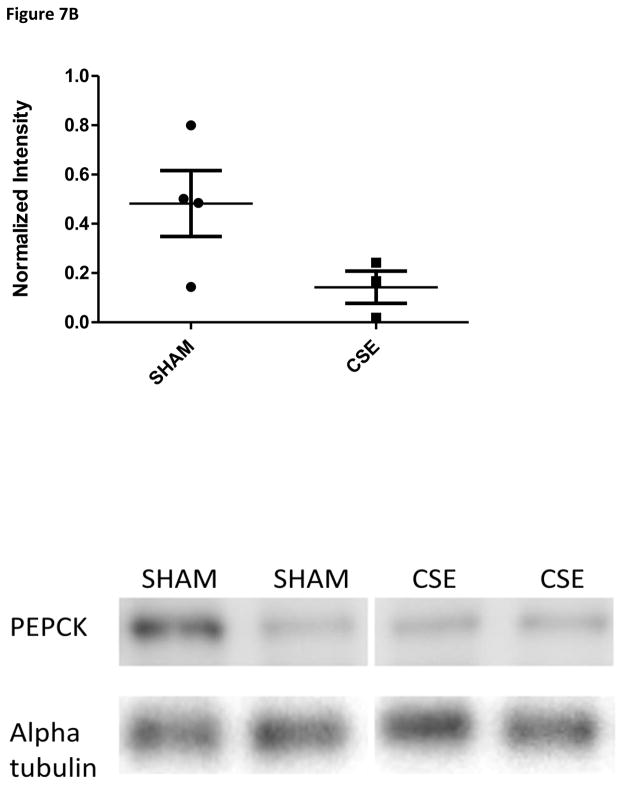
Follow-up studies of the expression level of SIRT1, a metabolic activity regulator, and the key regulatory enzyme in gluconeogenesis, phosphoenolpyruvate carboxykinase, revealed a trend toward decreased expression of basal gluconeogenesis within the fed state (Figure 7A and 7B). When paired to the finding of reduced serum glucose levels in the parallel study on liver tissue-specific toxicity in these same animals [47], these findings likely indicate systemic aberrant responses to insulin signaling or possible hyperinsulinemia. Insulin expression and signaling were not assessed within the current study.
Figure 7.
Figure 7A: Western blot analysis of SIRT1 expression in whole kidney homogenates from 6 month old offspring previously exposed on GD1-PD21 to cigarette smoke. Kidney homogenates from CSE offspring at age 6 months exhibited a decrease of approximately 30% in expression of the metabolic regulatory protein SIRT1 when compared to Sham exposed (*p<0.05; n=3 per group). Long horizontal lines indicate mean signal intensity, with the standard deviation represented by the shorter horizontal bars.
Figure 7B: Western blot analysis of PEPCK expression in whole kidney homogenates from 6 month old offspring previously exposed GD1-PD21 to cigarette smoke. Kidney homogenates from CSE offspring at age 6 months exhibited an increase of approximately 70% in PEPCK expression in the fed state when compared to Sham exposed (*p<0.05; n=4 per group). Long horizontal lines indicate mean signal intensity, with the standard deviation represented by the shorter horizontal bars.
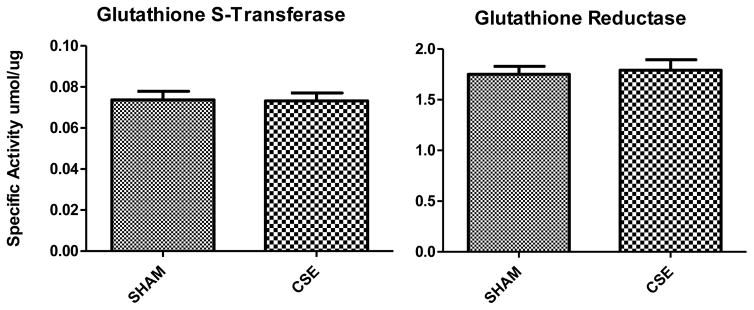
Amino acid degradation was increased in kidneys at age 6 months of offspring within the CSE group, Glutamate oxaloacetate transaminase 1 (Spot 26, increased 37%) and malate dehydrogenase 2 (Spot 44, increased 73%) were members of the Aspartate Degradation II pathway and are both mitochondrial proteins. Several other mitochondrial proteins were increased in abundance including ATP synthase 5A1 (Spot 20, increased 126%), ATP synthase, H+ transporting, beta unit (Spot 37, increased 24%), and the voltage dependent anion channel 1 (Spot 48, increased 80%) indicating that mitochondrial activity or number is likely increased in the CSE offspring at 6 months of age. This added respiratory function would necessitate increased capacity for oxidant scavenging and indeed this is evidenced by the increased abundance of glutamate-cysteine ligase (Spot 55, increased 20%, glutathione synthesis) paired with increased glutathione peroxidase (Spot 63, increased 17%) and peroxiredoxin (Spot 63) in the CSE offspring. The specific activity of glutathione-S-transferase and glutathione reductase was not impacted in the CSE offspring.
4. DISCUSSION
In utero cigarette smoke exposure results in low birth weight with proportionally smaller organ size [60-63]. In the kidney, developmental CSE alters the shape of the proximal and distal convoluted tubules, reduces the proximal tubule cuboidal epithelium thickness, and yields immature glomeruli in neonates [64, 65]. As previously demonstrated, 'active' CSE during pre- and post-natal development, including the entirety of kidney organogenesis, results in low birth weight that is coupled to decreased offspring weights throughout postnatal development, although the rate of growth is unaffected [44]. Proportional decreases in offspring weight, crown-rump length, brain wet weight, and kidney weight in CSE offspring were observed [41, 61, 66].
In the current study, developmental exposure to an 'active' cigarette smoking paradigm results in persistently smaller offspring at maturity without evidence of catch up growth or obesity when offspring were maintained on a standard diet containing 12% of fat [49]. The persistently smaller phenotype of exposed mice includes proportionally smaller kidney mass coupled to sustained alterations in kidney proteome profiles. Decrements in kidney weight, a pseudomarker for decreased nephron count, were coupled to persistently decreased abundance of calreticulin. Decreased levels of calreticulin may also impact nephron count as calcium signaling is essential for the conversion of the metanephric mesenchyme into the functional nephron epithelium. The impact of developmental CSE on nephron count and morphology may contribute to the development of high blood pressure [67] or high-fat diet induced obesity [32]. We suggest that renal hyperfiltration and glomerular disease associated with a high-fat diet induced obesity paradigm may be exacerbated by the present model system of 'active' cigarette smoke exposure throughout early development since increased nephron count and kidney mass do not accompany visceral fat accumulation [68]. Rather, reduced nephron number and kidney mass prior to obesity may increase the susceptibility to obesity-induced renal disease [69]. We plan to test this hypothesis in future studies.
As in our prior report at the time of animal weaning, the impact of developmental CSE on the kidney proteome at the cessation of exposure, the abundance of antioxidant enzymes Cu/Zn superoxide dismutase and glutathione peroxidase remained decreased in the CSE kidneys at maturity. Coupled with the finding of increased abundance of glutathione peroxidase and glutamate-cysteine ligase modifier subunit, and a lack of impact on the glutathione dependent antioxidant enzymes activities (GST and GR; Figure 8), we interpret this outcome as indicative of alterations in post-translational modification of these enzymes that do not inhibit function but may act as predisposing effectors with a subsequent challenge such as high dietary fat intake.
Figure 8. Antioxidant enzymatic activity in kidney of Sham and developmental CSE offspring at age 6 months.
Antioxidant enzyme specific activity was not compromised in the kidney of CSE offspring (n=4 per group).
Of particular note in this study are the decreased abundance of three metabolic enzymes (Glyceraldehyde-3-phosphate dehydrogenase, Aldolase B, Fructose-1, 6-bisphosphatase) from the gluconeogenesis pathway. Aldolase B and Glyceraldehyde-3-dehydrogenase are also part of the glycolytic pathway. The decrease in abundance of these enzymes in the kidney of mature offspring who were developmentally exposed to cigarette smoke, coupled to the approximate 20% reduction in serum glucose levels in these animals [47] and the trend toward a reduction in tissue-specific PEPCK expression, indicates a deficit in glucose availability that may contribute to the decrements in growth and weight that are evident from birth and continue to maturity. It also appears that galactose utilization to produce glucose may be stimulated in the kidney of mature offspring developmentally exposed to cigarette smoke since galactose kinase abundance was increased. In contrast, within the liver of CSE offspring at 6 months of age, inappropriately timed gluconeogenesis appears to be occurring. This disparate, inverse relationship between hepatic and renal gluconeogenesis in the fed state may indicate an increased attempt to elevate basal gluconeogenesis by the liver which is not matched within the kidney. Indeed both tissues exhibited suppressed SIRT1 activation in the fed state but a disparate response by the gluconeogenesis pathway that may indicate tissue-specific involvement of the AMPK signaling network.
In contrast, increased abundance of sorbitol dehydrogenase and ketohexokinase in the kidney of mature offspring who were exposed throughout development (GD1-PD21) to cigarette smoke indicate a possible increase in conversion of glucose to fructose via the sorbitol pathway (sorbitol dehydrogenase protein spot abundance increased) and subsequent metabolism to produce the gluconeogenic precursor glyceraldehyde 3-phosphate or alternatively to proceed on to production of the lipogenic substrate pyruvate. We found that the abundance of malate dehydrogenase 2 (mitochondrial form) was increased substantiating the likely increased activity of the lipogenic pathway. Triglyceride levels in serum were unaltered in the mature exposed offspring (data not shown).
In summary, the current study examined the proteome profiles of the intact kidney from mature offspring (aged 6 months) who were previously developmentally exposed to CSE from GD1-PD21. At the time of cessation of exposure to cigarette smoke (PD21), proteins involved in calcium signaling, lipid metabolism, and small molecule metabolism were decreased in abundance in the kidney, and oxidant scavenging enzymes, small heat shock proteins and lambda crystallin were increased in abundance [46]. As described in the current study of offspring five months past the cessation of exposure to cigarette smoke carbohydrate and small molecule metabolism as well as calcium regulation are again altered. The impact of developmental CSE on epigenetic programming of kidney metabolic function is the subject of future studies.
Highlights.
Developmental CSE induces impairment of carbohydrate metabolic pathway protein expression.
Oxidant scavenging pathways are impaired in adults by developmental CSE.
Decreased protein abundances within the nucleic acid metabolic pathways evident in mature CSE offspring
Acknowledgments
Research described in this article was supported in part by PHS grants NIH P20 RR/DE-17702, NIH R21 DA027466, NIH P30 ES014443 and by the University of Louisville CREAM Center from NSF EPSCoR grant EPS-0447479 (MS).
Footnotes
Publisher's Disclaimer: This is a PDF file of an unedited manuscript that has been accepted for publication. As a service to our customers we are providing this early version of the manuscript. The manuscript will undergo copyediting, typesetting, and review of the resulting proof before it is published in its final citable form. Please note that during the production process errors may be discovered which could affect the content, and all legal disclaimers that apply to the journal pertain.
References
- 1.Li XY, Rahman I, Donaldson K, MacNee W. Mechanisms of cigarette smoke induced increased airspace permeability. Thorax. 1996;51:465–71. doi: 10.1136/thx.51.5.465. [DOI] [PMC free article] [PubMed] [Google Scholar]
- 2.Sisman AR, Bulbul M, Coker C, Onvural B. Cadmium exposure in tobacco workers: possible renal effects. J Trace Elem Med Biol. 2003;17:51–5. doi: 10.1016/S0946-672X(03)80046-9. [DOI] [PubMed] [Google Scholar]
- 3.Kyerematen GA, Vesell ES. Metabolism of nicotine. Drug Metab Rev. 1991;23:3–41. doi: 10.3109/03602539109029754. [DOI] [PubMed] [Google Scholar]
- 4.Shah PK, Helfant RH. Smoking and coronary artery disease. Chest. 1988;94:449–52. doi: 10.1378/chest.94.3.449. [DOI] [PubMed] [Google Scholar]
- 5.Marcilla A, Martinez I, Berenguer D, Gomez-Siurana A, Beltran MI. Comparative study of the main characteristics and composition of the mainstream smoke of ten cigarette brands sold in Spain. Food Chem Toxicol. 2012;50:1317–33. doi: 10.1016/j.fct.2012.01.046. [DOI] [PubMed] [Google Scholar]
- 6.Shin HJ, Sohn HO, Han JH, Park CH, Lee HS, Lee DW, et al. Effect of cigarette filters on the chemical composition and in vitro biological activity of cigarette mainstream smoke. Food Chem Toxicol. 2009;47:192–7. doi: 10.1016/j.fct.2008.10.028. [DOI] [PubMed] [Google Scholar]
- 7.Rodgman A, Smith CJ, Perfetti TA. The composition of cigarette smoke: a retrospective, with emphasis on polycyclic components. Hum Exp Toxicol. 2000;19:573–95. doi: 10.1191/096032700701546514. [DOI] [PubMed] [Google Scholar]
- 8.Bock FG, Swain AP, Stedman RL. Composition studies on tobacco. XLIV. Tumor-promoting activity of subfractions of the weak acid fraction of cigarette smoke condensate. J Natl Cancer Inst. 1971;47:429–36. [PubMed] [Google Scholar]
- 9.Bock FG, Swain AP, Stedman RL. Composition studies on tobacco. XLI. Carcinogenesis assay of subfractions of the neutral fraction of cigarette smoke condensate. J Natl Cancer Inst. 1970;44:1305–10. [PubMed] [Google Scholar]
- 10.Lindsey AJ. The composition of cigarette smoke: studies on stubs and tips. Br J Cancer. 1959;13:195–9. doi: 10.1038/bjc.1959.26. [DOI] [PMC free article] [PubMed] [Google Scholar]
- 11.Righetti M, Sessa A. Cigarette smoking and kidney involvement. J Nephrol. 2001;14:3–6. [PubMed] [Google Scholar]
- 12.Teshima K, Imamura H, Uchida K, Miyamoto N, Masuda Y, Kobata D. Cigarette smoking, blood pressure and serum lipids in Japanese men aged 20–39 years. J Physiol Anthropol Appl Human Sci. 2001;20:43–5. doi: 10.2114/jpa.20.43. [DOI] [PubMed] [Google Scholar]
- 13.Will JC, Galuska DA, Ford ES, Mokdad A, Calle EE. Cigarette smoking and diabetes mellitus: evidence of a positive association from a large prospective cohort study. Int J Epidemiol. 2001;30:540–6. doi: 10.1093/ije/30.3.540. [DOI] [PubMed] [Google Scholar]
- 14.Winkelmann BR, Boehm BO, Nauck M, Kleist P, Marz W, Verho NK, et al. Cigarette smoking is independently associated with markers of endothelial dysfunction and hyperinsulinaemia in nondiabetic individuals with coronary artery disease. Curr Med Res Opin. 2001;17:132–41. [PubMed] [Google Scholar]
- 15.Zevin S, Saunders S, Gourlay SG, Jacob P, Benowitz NL. Cardiovascular effects of carbon monoxide and cigarette smoking. J Am Coll Cardiol. 2001;38:1633–8. doi: 10.1016/s0735-1097(01)01616-3. [DOI] [PubMed] [Google Scholar]
- 16.Charlton A. Changing patterns of cigarette smoking among teenagers and young adults. Paediatr Respir Rev. 2001;2:214–21. doi: 10.1053/prrv.2001.0143. [DOI] [PubMed] [Google Scholar]
- 17.Christiansen AL, Malmstadt J, Rumm P, Eisenberg T, Ahrens D, Remington P. Trends in self-reported cigarette smoking, Wisconsin, 1984–1999. WMJ. 2001;100:24–8. [PubMed] [Google Scholar]
- 18.Moffat BM, Johnson JL. Through the haze of cigarettes: teenage girls' stories about cigarette addiction. Qual Health Res. 2001;11:668–81. doi: 10.1177/104973201129119361. [DOI] [PubMed] [Google Scholar]
- 19.Molarius A, Parsons RW, Dobson AJ, Evans A, Fortmann SP, Jamrozik K, et al. Trends in cigarette smoking in 36 populations from the early 1980s to the mid-1990s: findings from the WHO MONICA Project. Am J Public Health. 2001;91:206–12. doi: 10.2105/ajph.91.2.206. [DOI] [PMC free article] [PubMed] [Google Scholar]
- 20.Watson R. MEPs back tougher health warnings on cigarette packets. BMJ. 2001;322:7. [PMC free article] [PubMed] [Google Scholar]
- 21.CDC. Cigarette smoking in 99 metropolitan areas--United States, 2000. MMWR Morb Mortal Wkly Rep. 2001;50:1107–13. [PubMed] [Google Scholar]
- 22.CDC. Cigarette smoking among adults--United States, 1999. MMWR Morb Mortal Wkly Rep. 2001;50:869–73. [PubMed] [Google Scholar]
- 23.Lewis PC, Harrell JS, Bradley C, Deng S. Cigarette use in adolescents: the Cardiovascular Health in Children and Youth Study. Res Nurs Health. 2001;24:27–37. doi: 10.1002/1098-240x(200102)24:1<27::aid-nur1004>3.0.co;2-0. [DOI] [PubMed] [Google Scholar]
- 24.Boutwell BB, Beaver KM, Gibson CL, Ward JT. Prenatal exposure to cigarette smoke and childhood externalizing behavioral problems: a propensity score matching approach. Int J Environ Health Res. 2011;21:248–59. doi: 10.1080/09603123.2010.544032. [DOI] [PubMed] [Google Scholar]
- 25.Koshy G, Delpisheh A, Brabin BJ. Dose response association of pregnancy cigarette smoke exposure, childhood stature, overweight and obesity. Eur J Public Health. 2011;21:286–91. doi: 10.1093/eurpub/ckq173. [DOI] [PubMed] [Google Scholar]
- 26.Stack AG, Murthy BV. Cigarette use and cardiovascular risk in chronic kidney disease: an unappreciated modifiable lifestyle risk factor. Semin Dial. 2010;23:298–305. doi: 10.1111/j.1525-139X.2010.00728.x. [DOI] [PubMed] [Google Scholar]
- 27.Gambaro G, Bax G, Fusaro M, Normanno M, Manani SM, Zanella M, et al. Cigarette smoking is a risk factor for nephropathy and its progression in type 2 diabetes mellitus. Diabetes Nutr Metab. 2001;14:337–42. [PubMed] [Google Scholar]
- 28.Gulliford MC. Low rates of detection and treatment of hypertension among current cigarette smokers. J Hum Hypertens. 2001;15:771–3. doi: 10.1038/sj.jhh.1001275. [DOI] [PubMed] [Google Scholar]
- 29.Imamura H, Miyamoto N, Uchida K, Teshima K, Masuda Y, Kobata D. Cigarette smoking, blood pressure and serum lipids and lipoproteins in middle-aged women. J Physiol Anthropol Appl Human Sci. 2001;20:1–6. doi: 10.2114/jpa.20.1. [DOI] [PubMed] [Google Scholar]
- 30.von Holt K, Lebrun S, Stinn W, Conroy L, Wallerath T, Schleef R. Progression of atherosclerosis in the Apo E-/- model: 12-month exposure to cigarette mainstream smoke combined with high-cholesterol/fat diet. Atherosclerosis. 2009;205:135–43. doi: 10.1016/j.atherosclerosis.2008.11.031. [DOI] [PubMed] [Google Scholar]
- 31.Chen H, Hansen MJ, Jones JE, Vlahos R, Anderson GP, Morris MJ. Detrimental metabolic effects of combining long-term cigarette smoke exposure and high-fat diet in mice. Am J Physiol Endocrinol Metab. 2007;293:E1564–71. doi: 10.1152/ajpendo.00442.2007. [DOI] [PubMed] [Google Scholar]
- 32.Ng SP, Conklin DJ, Bhatnagar A, Bolanowski DD, Lyon J, Zelikoff JT. Prenatal exposure to cigarette smoke induces diet- and sex-dependent dyslipidemia and weight gain in adult murine offspring. Environ Health Perspect. 2009;117:1042–8. doi: 10.1289/ehp.0800193. [DOI] [PMC free article] [PubMed] [Google Scholar]
- 33.Chen H, Iglesias MA, Caruso V, Morris MJ. Maternal cigarette smoke exposure contributes to glucose intolerance and decreased brain insulin action in mice offspring independent of maternal diet. PLoS One. 2011;6:e27260. doi: 10.1371/journal.pone.0027260. [DOI] [PMC free article] [PubMed] [Google Scholar]
- 34.Zarzecki M, Adamczak M, Wystrychowski A, Gross ML, Ritz E, Wiecek A. Exposure of Pregnant Rats to Cigarette-Smoke Condensate Causes Glomerular Abnormalities in Offspring. Kidney Blood Press Res. 2012;36:162–71. doi: 10.1159/000341489. [DOI] [PubMed] [Google Scholar]
- 35.Younoszai MK, Peloso J, Haworth JC. Fetal growth retardation in rats exposed to cigarette smoke during pregnancy. Am J Obstet Gynecol. 1969;104:1207–13. doi: 10.1016/s0002-9378(16)34295-8. [DOI] [PubMed] [Google Scholar]
- 36.Abitbol CL, Ingelfinger JR. Nephron mass and cardiovascular and renal disease risks. Semin Nephrol. 2009;29:445–54. doi: 10.1016/j.semnephrol.2009.03.019. [DOI] [PubMed] [Google Scholar]
- 37.Dotsch J, Plank C, Amann K, Ingelfinger J. The implications of fetal programming of glomerular number and renal function. J Mol Med (Berl) 2009;87:841–8. doi: 10.1007/s00109-009-0507-7. [DOI] [PubMed] [Google Scholar]
- 38.Tsuboi N, Utsunomiya Y, Hosoya T. Obesity-related glomerulopathy and the nephron complement. Nephrol Dial Transplant. 2013;28(Suppl 4):iv108–13. doi: 10.1093/ndt/gft258. [DOI] [PubMed] [Google Scholar]
- 39.Tsuboi N, Koike K, Hirano K, Utsunomiya Y, Kawamura T, Hosoya T. Clinical features and long-term renal outcomes of Japanese patients with obesity-related glomerulopathy. Clin Exp Nephrol. 2013;17:379–85. doi: 10.1007/s10157-012-0719-y. [DOI] [PubMed] [Google Scholar]
- 40.Toledo-Rodriguez M, Loyse N, Bourdon C, Arab S, Pausova Z. Effect of prenatal exposure to nicotine on kidney glomerular mass and AT1R expression in genetically diverse strains of rats. Toxicol Lett. 2012;213:228–34. doi: 10.1016/j.toxlet.2012.06.009. [DOI] [PubMed] [Google Scholar]
- 41.Jagadapillai R, Chen J, Canales L, Birtles T, Pisano MM, Neal RE. Developmental cigarette smoke exposure: kidney proteome profile alterations in low birth weight pups. Toxicology. 2012;299:80–9. doi: 10.1016/j.tox.2012.04.015. [DOI] [PMC free article] [PubMed] [Google Scholar]
- 42.Rueff-Barroso CR, Trajano ET, Alves JN, Paiva RO, Lanzetti M, Pires KM, et al. Organ-related cigarette smoke-induced oxidative stress is strain-dependent. Med Sci Monit. 2010;16:BR218–26. [PubMed] [Google Scholar]
- 43.Mao C, Wu J, Xiao D, Lv J, Ding Y, Xu Z, et al. The effect of fetal and neonatal nicotine exposure on renal development of AT(1) and AT(2) receptors. Reprod Toxicol. 2009;27:149–54. doi: 10.1016/j.reprotox.2009.01.012. [DOI] [PMC free article] [PubMed] [Google Scholar]
- 44.Canales L, Chen J, Kelty E, Musah S, Webb C, Pisano MM, et al. Developmental cigarette smoke exposure: liver proteome profile alterations in low birth weight pups. Toxicology. 2012;300:1–11. doi: 10.1016/j.tox.2012.04.016. [DOI] [PMC free article] [PubMed] [Google Scholar]
- 45.Neal RE, Chen J, Jagadapillai R, Jang H, Abomoelak B, Brock G, et al. Developmental cigarette smoke exposure: hippocampus proteome and metabolome profiles in low birth weight pups. Toxicology. 2014;317:40–9. doi: 10.1016/j.tox.2014.01.006. [DOI] [PMC free article] [PubMed] [Google Scholar]
- 46.Neal R, Jagadapillai R, Chen J, Stocke K, Gambrell C, Greene RM, Pisano MM. Developmental Cigarette Smoke Exposure II: Kidney Proteome Profile Alterations in Adult Offspring. Reprod Toxicol. 2016 doi: 10.1016/j.reprotox.2016.05.008. X:X. [DOI] [PMC free article] [PubMed] [Google Scholar]
- 47.Neal RE, Chen J, Stocke K, Webb C, Gambrell C, Greene RM, Pisano MM. Developmental Cigarette Smoke Exposure II: Hepatic Proteome Profiles in Adult Offspring. Reprod Toxicol. 2016 doi: 10.1016/j.reprotox.2016.06.009. x:x. [DOI] [PMC free article] [PubMed] [Google Scholar]
- 48.Neal RE, Jagadapillai R, Chen J, Stocke K, Webb C, Greene RM, Pisano MM. Developmental cigarette smoke exposure II: Hippocampus proteome and metabolome profiles in adult offspring. Reprod Toxicol. 2016 doi: 10.1016/j.reprotox.2016.05.007. x:x. [DOI] [PMC free article] [PubMed] [Google Scholar]
- 49.Amos-Kroohs RM, Williams MT, Braun AA, Graham DL, Webb CL, Birtles TS, et al. Neurobehavioral phenotype of C57BL/6J mice prenatally and neonatally exposed to cigarette smoke. Neurotoxicol Teratol. 2013;35:34–45. doi: 10.1016/j.ntt.2013.01.001. [DOI] [PMC free article] [PubMed] [Google Scholar]
- 50.CDC. Incidence of initiation of cigarette smoking--United States, 1965-1996. MMWR Morb Mortal Wkly Rep. 1998;47:837–40. [PubMed] [Google Scholar]
- 51.Husten CG, Chrismon JH, Reddy MN. Trends and effects of cigarette smoking among girls and women in the United States, 1965-1993. J Am Med Womens Assoc. 1996;51:11–8. [PubMed] [Google Scholar]
- 52.Nelson DE, Giovino GA, Shopland DR, Mowery PD, Mills SL, Eriksen MP. Trends in cigarette smoking among US adolescents, 1974 through 1991. Am J Public Health. 1995;85:34–40. doi: 10.2105/ajph.85.1.34. [DOI] [PMC free article] [PubMed] [Google Scholar]
- 53.CDC. Comparison of the cigarette brand preferences of adult and teenaged smokers--United States, 1989, and 10 U.S. communities, 1988 and 1990. MMWR Morb Mortal Wkly Rep. 1992;41:169–73. 79–81. [PubMed] [Google Scholar]
- 54.Teague SV, Pinkerton KE, Goldsmith M, Gebremichael A, Chang S, Jenkins RA, Moneyhun JH. Sidestream cigarette smoke generation and exposure system for environmental tobacco smoke studies. Inhalation Toxicology. 1994;6:79–93. [Google Scholar]
- 55.Pappin DJ, Hojrup P, Bleasby AJ. Rapid identification of proteins by peptide-mass fingerprinting. Curr Biol. 1993;3:327–32. doi: 10.1016/0960-9822(93)90195-t. [DOI] [PubMed] [Google Scholar]
- 56.Gershoni JM. Protein blotting: a manual. Methods Biochem Anal. 1988;33:1–58. doi: 10.1002/9780470110546.ch1. [DOI] [PubMed] [Google Scholar]
- 57.Boyland E, Chasseaud LF. Glutathione S-aralkyltransferase. Biochem J. 1969;115:985–91. doi: 10.1042/bj1150985. [DOI] [PMC free article] [PubMed] [Google Scholar]
- 58.Jakoby WB. The glutathione S-transferases: a group of multifunctional detoxification proteins. Adv Enzymol Relat Areas Mol Biol. 1978;46:383–414. doi: 10.1002/9780470122914.ch6. [DOI] [PubMed] [Google Scholar]
- 59.Staal GE, Visser J, Veeger C. Purification and properties of glutathione reductase of human erythrocytes. Biochim Biophys Acta. 1969;185:39–48. doi: 10.1016/0005-2744(69)90280-0. [DOI] [PubMed] [Google Scholar]
- 60.Horn KH, Esposito ER, Greene RM, Pisano MM. The effect of cigarette smoke exposure on developing folate binding protein-2 null mice. Reprod Toxicol. 2008;26:203–9. doi: 10.1016/j.reprotox.2008.09.013. [DOI] [PMC free article] [PubMed] [Google Scholar]
- 61.Esposito ER, Horn KH, Greene RM, Pisano MM. An animal model of cigarette smoke-induced in utero growth retardation. Toxicology. 2008;246:193–202. doi: 10.1016/j.tox.2008.01.014. [DOI] [PMC free article] [PubMed] [Google Scholar]
- 62.Prabhu N, Smith N, Campbell D, Craig LC, Seaton A, Helms PJ, et al. First trimester maternal tobacco smoking habits and fetal growth. Thorax. 2010;65:235–40. doi: 10.1136/thx.2009.123232. [DOI] [PubMed] [Google Scholar]
- 63.Cliver SP, Goldenberg RL, Cutter GR, Hoffman HJ, Davis RO, Nelson KG. The effect of cigarette smoking on neonatal anthropometric measurements. Obstet Gynecol. 1995;85:625–30. doi: 10.1016/0029-7844(94)00437-I. [DOI] [PubMed] [Google Scholar]
- 64.Czekaj P, Palasz A, Lebda-Wyborny T, Nowaczyk-Dura G, Karczewska W, Florek E, et al. Morphological changes in lungs, placenta, liver and kidneys of pregnant rats exposed to cigarette smoke. Int Arch Occup Environ Health. 2002;75(Suppl):S27–35. doi: 10.1007/s00420-002-0343-3. [DOI] [PubMed] [Google Scholar]
- 65.Nelson E, Goubet-Wiemers C, Guo Y, Jodscheit K. Maternal passive smoking during pregnancy and foetal developmental toxicity. Part 2: histological changes. Hum Exp Toxicol. 1999;18:257–64. doi: 10.1191/096032799678840011. [DOI] [PubMed] [Google Scholar]
- 66.Neal RE, Chen J, Jagadapillai R, Jang HJ, Abomoelak B, Brock G, et al. Developmental Cigarette Smoke Exposure: Hippocampus Proteome and Metabolome Profiles in Low Birth Weight Pups. Toxicology. 2014 doi: 10.1016/j.tox.2014.01.006. In Press. [DOI] [PMC free article] [PubMed] [Google Scholar]
- 67.Zarzecki M, Adamczak M, Wystrychowski A, Gross ML, Ritz E, Wiecek A. Exposure of pregnant rats to cigarette-smoke condensate causes glomerular abnormalities in offspring. Kidney Blood Press Res. 2012;36:162–71. doi: 10.1159/000341489. [DOI] [PubMed] [Google Scholar]
- 68.Praga M. Synergy of low nephron number and obesity: a new focus on hyperfiltration nephropathy. Nephrol Dial Transplant. 2005;20:2594–7. doi: 10.1093/ndt/gfi201. [DOI] [PubMed] [Google Scholar]
- 69.Gurusinghe S, Brown RD, Cai X, Samuel CS, Ricardo SD, Thomas MC, et al. Does a nephron deficit exacerbate the renal and cardiovascular effects of obesity? PLoS One. 2013;8:e73095. doi: 10.1371/journal.pone.0073095. [DOI] [PMC free article] [PubMed] [Google Scholar]


