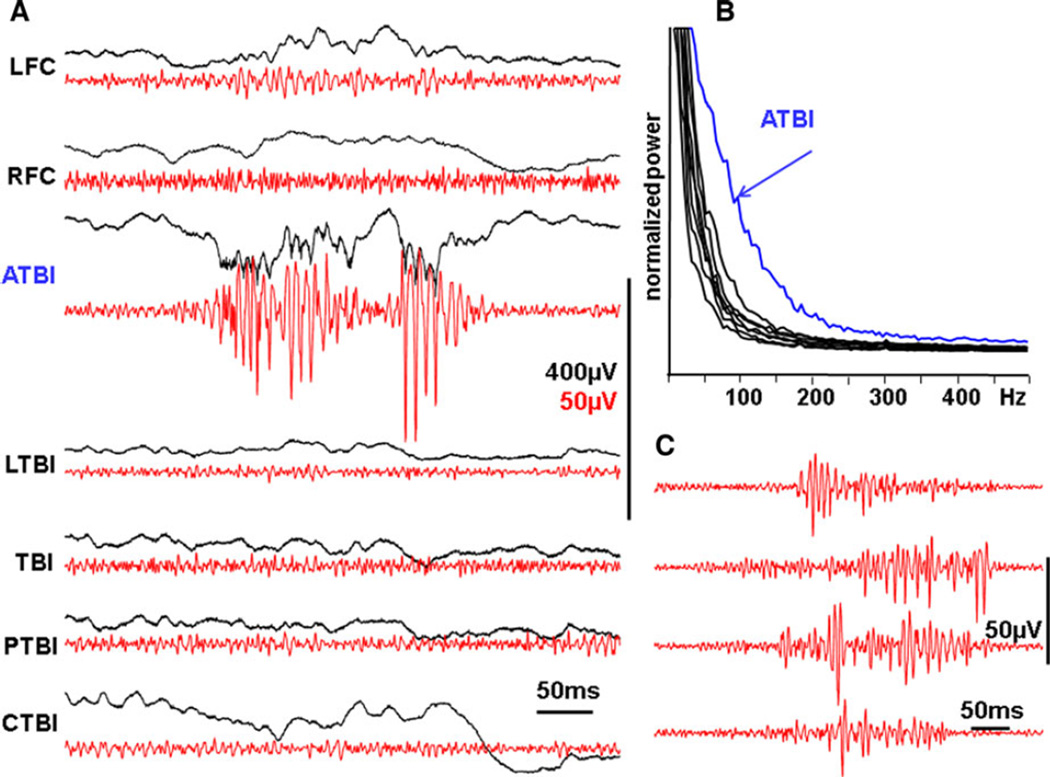
Figure 2.
(A) Local generation of pHFOs in the area adjacent to the traumatic brain injury on the 10th day after the injury. pHFOs appeared in the perilesional area anterior to the TBI core, but not in other areas of neocortex. Black lines are raw data recorded within a frequency band of 0.1 Hz–10 kHz, and red band pass (100–600 Hz). (B) Power spectrum density graph illustrating that the area generating pHFOs has higher power of electrical activity in the frequency band 60–300 Hz. (C) Examples of pHFOs, which have different patterns of evolution: descending, ascending, and mixed. LFC and RFC, left and right frontal cortex; ATBI, LTBI, and PTBI, areas adjacent to the TBI core from anterior and lateral and posterior sites sites; TBI, center of traumatic brain injury; CTBI, area homotopical to the TBI in the contralateral hemisphere.
Epilepsia © ILAE

