

Abstract
Background&Aims
Recent clinical trials of direct-acting-antiviral agents (DAAs) against hepatitis C virus (HCV) achieved >90% sustained-virological response (SVR) rates, suggesting that cure often took place before the end of treatment (EOT). We sought to evaluate retrospectively whether early response kinetics can provide the basis to individualize therapy to achieve optimal results while reducing duration and cost.
Methods
58 chronic-HCV patients were treated with 12-week sofosbuvir+simeprevir(n=19), sofosbuvir+daclatasvir(n=19), or sofosbuvir+ledipasvir in three French referral centers. HCV was measured at baseline, day 2, every other week, EOT and 12 weeks post EOT. Mathematical modeling was used to predict the time to cure,i.e,<1 virus copy in the entire extracellular-body fluid.
Results
All but one patient who relapsed achieved SVR. Mean age was 60±11 years, 53% were male, 86% HCV genotype-1, 9% HIV coinfected, 43% advanced fibrosis (F3), and 57% had cirrhosis. At weeks 2, 4 and 6, 48%, 88% and 100% of patients had HCV<15 IU/ml, with 27%, 74% and 91% of observations having target-not-detected, respectively. Modeling results predicted that 32(43%), 16(23%), 7(13%), 5(9%) and 3(5%) subjects were predicted to reach cure within 6, 8, 10, 12 and 13 weeks of therapy, respectively. The modeling suggested that the patient who relapsed would have benefitted from an additional week of sofosbuvir+ledipasvir. Adjusting duration of treatment according to the modeling predicts reduced medication costs of 43%-45% and 17%-30% in subjects who had HCV<15 IU/ml at weeks 2 and 4, respectively.
Conclusions
The use of early viral-kinetic analysis has the potential to individualize duration of DAA therapy with a projected average cost-saving of 16%-20% per 100-treated persons.
Keywords: HCV, viral kinetics, mathematical modeling, SVR, duration of therapy
Introduction
Hepatitis C virus (HCV) is a major cause of chronic liver disease, with an estimated 170 million people infected worldwide[1]. The development and recent approval of DAAs (direct-acting antiviral agents) has led to a revolution in the treatment of HCV with high sustained virological response (SVR) rates and virtual elimination of serious side effects [2]. Sofosbuvir-based regimens, including ledipasvir, simeprevir or daclatasvir achieve SVR rates of over 90% in all patient populations, including difficult to treat patients with cirrhosis, HIV co-infection, and previous non-responders [3-6]. However, high medication costs have limited access to treatment and have placed a substantial financial burden on insurers and national healthcare systems [7, 8].
Historically, on-treatment HCV RNA levels served as an indicator of treatment outcome [9]. In particular, during interferon-alpha therapy, on-treatment virus levels were a better predictor of treatment failure than of treatment success and thus provided the basis for treatment stopping rules [10]. With the advent of DAAs, the exceptionally high SVR rates achieved have made it far less important to predict response versus non-response and early viral kinetics (i.e. time to viral negativity) do not predict treatment failure [11, 12]. However, it would be extremely useful if early HCV kinetics could be used to determine duration of treatment needed to achieve cure, i.e. SVR.
In a previous study, we reported for the first time the use of real-time mathematical modeling of on-treatment HCV kinetics to individualize duration of IFN-free therapy with intravenous silibinin including the empowerment of the patient to participate in treatment decisions [13]. The application of similar modeling approaches to treatment with DAAs could provide the basis for using early on-treatment HCV RNA levels to predict duration of treatment needed to achieve cure and thus shorten treatment and reduce costs for some patients. Additionally, shorter regimens with low pill burdens, and few adverse effects could improve patient adherence in difficult to treat populations [6].
The objective of this study was to use kinetic analysis and modeling of early on-treatment HCV RNA levels to predict the duration of DAA therapy needed to achieve SVR. The analysis was performed retrospectively on data collected from patients treated with sofosbuvir in combination with simeprevir (SIM), daclatasvir (DAC), or ledipasvir (LEDI).
Patients & Methods
Patients
Data were obtained from 60 consecutive patients who received treatment for chronic HCV at three French HCV referral centers (Hôpital Européen - Marseille, Hôpital Saint Joseph-Marseille and Centre Hospitalier – Hyères) between December 2014 to January 2015. Patients were treated with sofosbuvir in conjunction with ribavirin (n=2), SIM (n=19), DAC (n=19), or LEDI (n=20). Due to the small n of the ribavirin treatment arm, these 2 patients were excluded from analysis and modeling in the current study. Patients were treated according to the recommendations of the French association for the study of the liver (AFEF), taking into consideration previous treatment, HCV genotype, fibrosis stage ≥F3 (performed less than six months before the start of therapy), and/or experts consensus recommendations [14].
All patients agreed to have their samples used for research purposes and the study was performed in compliance with Article L1121-1 of the French Public Health law. The study was approved by the steering committee of each participating hospital.
Fibrosis stage was evaluated by Fibrotest [15] or Fibroscan [16, 17] and classified according to the Metavir scoring system following French Guidelines [18]. Values of FibroTest≥0.59 or Fibroscan≥9.5 kPa were defined as advanced fibrosis (≥F3) and values of FibroTest≥0.79 or fibroscan≥12.1 kPa were defined as cirrhosis (F4)[19-21].
HCV RNA Measurements
HCV viral loads were assessed using Cobas Taqman HCV Test v2.0 (Roche Diagnostics France; limit of quantification 15 IU/ml)[22]. HCV RNA levels were measured at baseline, day 2, and weeks 2, 4, 6, 8 and 12 during therapy and then 4 weeks and 12 weeks after completion of therapy. In the SOF+LEDI group, HCV RNA levels also were measured at week 1.
Mathematical Modeling
HCV viral kinetics under therapy was assumed to follow the standard biphasic model [23]:
| (Eq. 1) |
where T0 represents the number of target cells (i.e., hepatocytes), I, the number of infected cells and V, is the viral load in blood. Virus, V, infects target cells with rate constant β, generating productively-infected cells, I, which produce new virions at rate p per infected cell. Infected cells are lost at a rate δ per infected cell and virions are assumed to be cleared from blood at rate c per virion. Similar to previous modeling efforts [13, 23], we assume the target cell level remained constant during therapy at pre-treatment level T0=cδ/βp. DAA effect ɛ is defined as the therapy effectiveness 0≤ɛ≤1 in preventing viral production/secretion. Parameter estimates and their inter-individual variability (IIV) estimates were obtained using a maximum-likelihood method by the stochastic approximation expectation-maximization (SAEM) algorithm [24] implemented in MONOLIX version 4.3.2 (Lixoft, Orsay, France). Further details are given in the Supplementary Information.
Cure Boundaries
The time to cure, or SVR, was defined as the time to reach less than one hepatitis C virion in the entire extracellular body fluid (blood, interstitial and transcellular) volume approximately 13.5L [13, 25-27]. A value of 7×10⁻⁵ for V (IU/ml) was used as the threshold for cure as the concentration of one virion/13,500 ml = 7×10⁻⁵ IU/ml. A secondary, more speculative analysis was performed in which time to cure was defined as less than one virus and infected hepatocyte in the body [13, 25-27] (Supplementary Information).
Statistical Analysis
Associations between either treatment type and patients characteristics were performed using either χ2 test or Fisher test for categorical variables or non-parametric Wilcoxon test for continuous variables. For all analyses, a P-value, P≤0.05 was considered as statistically significant. Data analyses were performed using SAS V9.1 software system (SAS Institute Inc., Cary, NC)
Results
Baseline Characteristics, viral kinetics and SVR rates
Mean age was 60±11 years, 30 (53%) were male, 50 (86%) HCV genotype 1, 8 (14%) non-genotype 1 (genotype 3 (n=1), genotype 4 (n=6) and genotype 5 (n=1), 5 (9%) HIV coinfected, 25 (43%) had severe fibrosis (F3), and 33 (57%) had cirrhosis (Table 1).
Table 1.
Patients’ characteristics
| Patients Characteristics | Cohort (n=58) | SOF+SIM (n=19) | SOF+DAC (n=19) | SOF+LEDI (n=20) | P |
|---|---|---|---|---|---|
| Mean Age ± SD (yr) | 60±11 | 60±11 | 60±13 | 61±10 | 0.8685 |
| Mean Weight ± SD (kg) | 71±16 | 72±17 | 67±14 | 74±13 | 0.4787 |
| Male – N (%) | 30 (52%) | 10 (53%) | 8 (42%) | 12 (60%) | 0.5329 |
| HCV Load – Mean ± SD (Log10 IU/ml) | 6.05±0.85 | 5.70±1.05 | 6.45±0.45 | 5.99±0.46 | 0.0065 |
| HCV Genotype – N (%) | 0.2736 | ||||
| 1 | 50 (86%) | 15 (79%) | 16 (85%) | 19 (95%) | |
| 3 | 1 (2%) | 0 | 1 (5%) | 0 | |
| 4 | 6 (10%) | 4 (21%) | 1 (5%) | 1 (5%) | |
| 5 | 1 (2%) | 0 | 1 (5%) | 0 | |
| HIV Coinfected – N (%) | 5 (9%) | 3 (16%) | 1 (5%) | 1 (5%) | 0.3977 |
| Severe Fibrosis (F3) – N(%) | 25 (43%) | 12 (63%) | 6 (32%) | 7 (35%) | 0.0963 |
| Cirrhosis (F4) – N (%) | 33 (57%) | 7 (37%) | 13 (68%) | 13 (65%) | 0.0963 |
| Treatment History | 0.6720 | ||||
| Treatment naive | 14(24%) | 5 (26%) | 5 (26%) | 4 (20%) | |
| Previously Treated – N(%) | 44 (76%) | 14 (74%) | 14 (74%) | 16 (80%) | |
| Previous Regimen – N | 0.0182 | ||||
| PegIFN-RBV | 29 (66%) of 44 | 13 (93%) of 14 | 8 (57%) of 14 | 8 (50%) of 16 | |
| PegIFN-RBV + Telaprevir | 8 (19%) of 44 | 0 | 1 (7%) of 14 | 7 (44%) of 16 | |
| PegIFN-RBV + Boceprevir | 1 (2%) of 44 | 0 | 0 | 1 (6%) of 16 | |
| Protease Inhibitor | 4 (9%) of 44 | 1 (7%) of 14 | 3 (21%) of 14 | 0 | |
| PegIFN alone | 1 (2%) of 44 | 0 | 1 (7%) of 14 | 0 | |
| Sofosbuvir + RBV | 1 (2%) of 44 | 0 | 1 (7%) of 14 | 0 | |
| Previous Response** - N | 0.0138 | ||||
| Non-Responders | 33 (75%) of 44 | 12 (86%) of 14 | 13 (93%) of 14 | 8 (50%) of 16 | |
| Relapsers | 11 (25%) of 44 | 2 (14%) of 14 | 1 (7%) of 14 | 8 (50%) of 16 |
Kruskal-Wallis test for continuous data, and χ2 test for categorical data; SOF, sofosbuvir; DAC, daclatasvir; SIM, simeprevir; LEDI, ledipasvir; SD, one standard deviation; Fibrosis, F, stage (see Methods); Non-responders, detected HCV RNA throughout treatment; Relapsers, HCV RNA not detected at the end of therapy but detectable during follow-up;
more information in Table S2.
Pretreatment HCV RNA levels were significantly (P=0.007) different among treatment groups with SOF+SIM (5.70±1.05 log IU/ml), SOF+LEDI (5.99±0.46 log IU/ml) and SOF+DAC (6.45±0.45 log IU/ml). The SOF+SIM group had a trend toward a lower proportion of patients with cirrhosis (P=0.093). In addition, there were significantly less non responders (NR) to previous treatment in the SOF+LEDI group (50%) compared to SOF+SIM (96%) and SOF+DAC groups (93%; P=0.014).
Fifty seven (98%) patients achieved SVR12 with one relapse in the SOF+LEDI group. During therapy, 3 patients (5%) had viral loads <15 IU/ml (detected or target not detected, TND) at day 2, 25 (43%) had <15 IU/ml at week 2, 23 (40%) at week 4, and 7 (12%) at week 6 (Fig. 1A). Three patients (15%) in the SOF+LEDI group had <15 IU/ml (detected) at week 1. In addition, the mean time to reach, TND, was similar among treatment groups, with 2 patients (3%) achieving TND at day 2, 14 (24%) at week 2, 27 (47%) at week 4, 10 (17%) at week 6, and 5 (9%) at week 8 (Fig. 1B). There was no association (P>0.24) between viral response type (i.e., time to viral load <15 IU/ml or TND) and fibrosis stage (cirrhotic vs non-cirrhotic), or previous viral response (NR, Relapse, naïve) during IFN-based regimens (not shown).
Fig. 1. Viral kinetics.
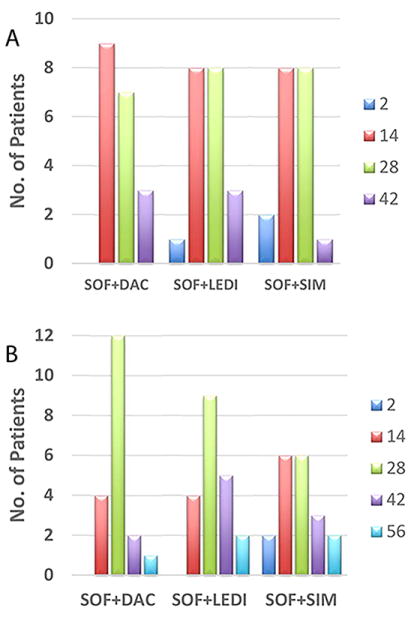
(A) Time (days) to reach HCV <15 IU/ml (target detected or not). (B) Time to reach target not detected, TND. No difference (P=0.7, Fisher Exact Test) was found between treatment groups. SOF, sofosbuvir; DAC, daclatasvir; SIM, simeprevir; LEDI, ledipasvir.
Viral kinetic parameter estimation
Model fitting was not performed in 4 patients whose viral load was already <15 IU/ml or TND at day 2 (n=3) or day 7 (n=1). The standard biphasic model (Eq. 1) that includes inter-individual variability (IIV, see Supplementary Information) in HCV-infected cell loss rate, δ, and pretreatment HCV RNA, V0, best described the data measured in 54 subjects. The model fit the measured data well (Fig. 2 and Fig. S2), the parameters were accurately estimated (Tables S1 and 2) and the goodness-of-fit plots were satisfactory (Fig. S3). The initial HCV viral load was estimated at 6.07 (standard error, s.e=0.15) log10 IU/mL, with an IIV of 8% (s.e=1%). Infected cells loss rate, δ, was estimated at 0.406 (s.e=0.033) d-1, leading to an HCV-infected cell half-life of 1.71 (s.e=0.14) days. Parameter δ exhibited an IIV of 46% (s.e=6%) among patients. Therapy effectiveness was similar among treatment groups and among patients being estimated as 0.997 (s.e=0.0008) (Table 2).
Fig. 2. Observed viral kinetics and model predicted curves in 30 representative subjects.
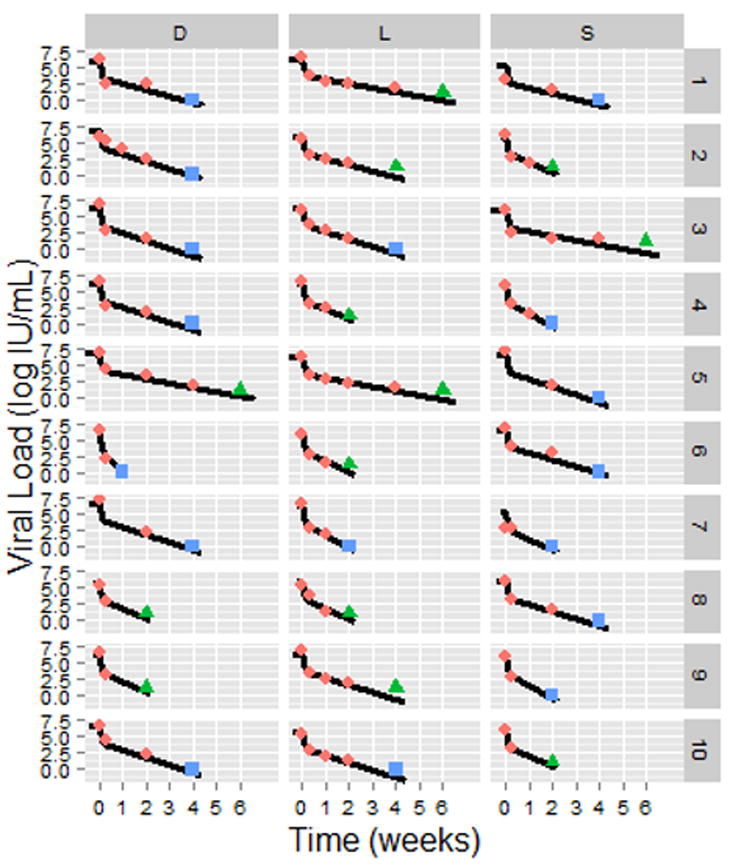
Pink diamonds: observed HCV viral load above the limit of quantification, LOQ (>15 IU/mL); green triangles, observed HCV < LOQ but still detected; blue squares, observed HCV viral load below the limit of detection; solid lines, biphasic model (Eq. 1) best fit curves (see Table 2 for individual parameters). Sofosbuvir in combination with daclatasvir (D), simeprevir (S), or ledipasvir (L). HCV viral load and fit curves of the remaining 24 subjects are shown in Fig. S2.
Table 2.
Best individual model parameter estimates
| Patients ID | δ (d-1) [CI95] | V0 (log IU/mL) [CI95] | Fraction of HCV-infected hepatocytes* (%) | Time to <1 virus (weeks) | Time to <1 virus and <1 infected cell (weeks) | ||
|---|---|---|---|---|---|---|---|
| H1 | 1 | D1 | 0.33 [0.26 - 0.40] | 6.08 [5.81 - 6.44] | 5 | 7.8 | 9.9 |
| H2 | 2 | S1 | 0.29 [0.22 - 0.36] | 5.31 [5.00 - 5.71] | 0.01 | 7.9 | 8.9 |
| H3 | 3 | D2 | 0.37 [0.31 - 0.43] | 6.77 [6.54 - 7.09] | 3 | 7.5 | 8.5 |
| H4 | 4 | D3 | 0.40 [0.32 - 0.49] | 6.21 [5.94 - 6.58] | 20 | 6.4 | 8.6 |
| H5 | 5 | D4 | 0.39 [0.31 - 0.48] | 6.16 [5.88 - 6.55] | 8 | 6.6 | 8.5 |
| H6 | 6 | S2 | 0.54 [0.40 - 0.69] | 5.98 [5.72 - 6.33] | 5 | 4.7 | 5.8 |
| H7 | 7 | S3 | 0.21 [0.18 - 0.26] | 5.91 [5.69 - 6.21] | 3 | 11.5 | 14.9 |
| H8 | 8 | D5 | 0.22 [0.18 - 0.25] | 6.77 [6.54 - 7.12] | 20 | 12.6 | 15.7 |
| H10 | 9 | S4 | 0.65 [0.51 - 0.80] | 5.88 [5.62 - 6.24] | 0.02 | 3.8 | 4.2 |
| H11 | 10 | S7 | 0.56 [0.38 - 0.78] | 5.18 [4.90 - 5.54] | 0.01 | 4.0 | 4.8 |
| H12 | 11 | S8 | 0.37 [0.29 - 0.45] | 6.14 [5.86 - 6.52] | 4 | 7.0 | 8.8 |
| H13 | 12 | D10 | 0.38 [0.31 - 0.45] | 6.63 [6.35 - 7.02] | 14 | 7.3 | 9.0 |
| H14 | 13 | D11 | 0.25 [0.22 - 0.29] | 6.90 [6.66 - 7.24] | 11 | 11.2 | 13.4 |
| H15 | 14 | D12 | 0.75 [0.51 - 1.03] | 6.00 [5.69 - 6.42] | 5 | 3.4 | 4.4 |
| H16 | 15 | S9 | 0.72 [0.49 - 0.99] | 5.94 [5.60 - 6.38] | 2 | 3.5 | 4.3 |
| H17 | 16 | S10 | 0.57 [0.35 - 0.83] | 6.11 [5.80 - 6.40] | 6 | 4.5 | 5.8 |
| H18 | 17 | D13 | 0.36 [0.29 - 0.44] | 5.76 [5.50 - 6.11] | 2 | 6.7 | 8.5 |
| H19 | 18 | S11 | 0.32 [0.24 - 0.41] | 6.05 [5.79 - 6.40] | 1 | 7.9 | 9.6 |
| H20 | 19 | D14 | 0.23 [0.20 - 0.027] | 6.07 [5.85 - 6.38] | 10 | 10.9 | 14.9 |
| R3 | 20 | D7 | 0.38 [0.29 - 0.48] | 6.58 [6.21 - 7.08] | 22 | 7.1 | 9.2 |
| R5 | 21 | S5 | 0.41 [0.32 - 0.50] | 6.56 [6.19 - 7.07] | 44 | 6.7 | 8.8 |
| R6 | 22 | S6 | 0.35 [0.28 - 0.41] | 6.54 [6.25 - 6.93] | 15 | 7.8 | 9.9 |
| R7 | 23 | D8 | 0.55 [0.34 - 0.80] | 5.83 [5.52 - 6.25] | 1 | 4.5 | 5.6 |
| R9 | 24 | D9 | 0.57 [0.35 - 0.85] | 6.12 [5.79 - 6.56] | 8 | 4.5 | 5.8 |
| R10 | 25 | S12 | 0.32 [0.24 - 0.40] | 6.12 [5.85 - 6.47] | 6 | 8.1 | 10.2 |
| R11 | 26 | S13 | 0.71 [0.44 - 1.04] | 5.54 [5.23 - 5.94] | 1 | 3.4 | 4.4 |
| R13 | 27 | S14 | 0.71 [0. 49 - 0.97] | 6.01 [5.69 - 6.43] | 7 | 3.5 | 4.7 |
| R14 | 28 | S15 | 0.58 [0.36 - 0.83] | 6.20 [5.86 - 6.64] | 6 | 4.5 | 5.7 |
| R15 | 29 | S16 | 0.29 [0.22 - 0.36] | 6.03 [5.76 - 6.39] | 5 | 8.9 | 11.3 |
| R17 | 30 | D15 | 0.61 [0.37 - 0.91] | 6.25 [5.92 - 6.70] | 10 | 4.3 | 5.5 |
| R18 | 31 | D16 | 0.57 [0.36 - 0.82] | 6.01 [5.70 - 6.42] | 5 | 4.4 | 5.8 |
| R2 | 32 | D6 | 1.18 [0.83- 1.63] | 5.86 [5.51 - 6.31] | 7 | 2.1 | 2.8 |
| R20 | 33 | D17 | 0.55 [0.37 - 0.77] | 6.44 [6.10 - 6.89] | 9 | 4.8 | 6.1 |
| R21 | 34 | D18 | 0.41 [0.33 - 0.49] | 6.33 [6.06 - 6.69] | 12 | 6.4 | 8.3 |
| R22 | 35 | D19 | 0.70 [0.48 - 0.96] | 6.22 [5.87 - 6.69] | 5 | 3.7 | 4.7 |
| MB3 | 36 | L1@ | 0.21 [0.18 - 0.24] | 6.37 [6.17 - 6.65] | 8 | 12.6 | 15.7 |
| MBH10 | 37 | L2 | 0.31 [0.25 - 0.39] | 5.92 [5.71 - 6.21] | 1 | 8.0 | 9.8 |
| MBH11 | 38 | L3 | 0.38 [0.31 - 0.45] | 6.26 [6.03 - 6.59] | 4 | 6.9 | 8.6 |
| MBH12 | 39 | L4 | 0.49 [0.37 - 0.63] | 6.13 [5.87 - 6.49] | 8 | 5.2 | 6.8 |
| MBH13 | 40 | L5 | 0.21 [0.18 - 0.25] | 6.22 [6.02 - 6.50] | 5 | 12.2 | 15.4 |
| MBH14 | 41 | L6 | 0.56 [0.41 - 0.74] | 5.81 [5.54 - 6.19] | 2 | 4.4 | 5.6 |
| MBH15 | 42 | L7 | 0.65 [0.51 - 0.80] | 6.14 [5.86 - 6.51] | 8 | 4.0 | 5.2 |
| MBH16 | 43 | L8 | 0.52 [0.38 - 0.68] | 5.92 [5.66 - 6.27] | 2 | 4.8 | 6.0 |
| MBH17 | 44 | L9 | 0.36 [0.29 - 0.45] | 6.28 [6.05 - 6.61] | 18 | 7.2 | 9.5 |
| MBH19 | 45 | L10 | 0.37 [0.31 - 0.44] | 5.80 [5.57 - 6.11] | 1 | 6.6 | 8.3 |
| MBH2 | 46 | L11 | 0.68 [0.42 - 1.01] | 5.82 [5.50 - 6.25] | 2 | 3.6 | 4.6 |
| MBH20 | 47 | L12 | 0.60 [0.46 - 0.78] | 5.66 [5.40 - 6.00] | 1 | 4.0 | 5.0 |
| MBH21 | 48 | L13 | 0.22 [0.20 - 0.25] | 6.37 [6.18 - 6.63] | 4 | 11.7 | 14.4 |
| MBH24 | 49 | L14 | 0.39 [0.32 - 0.47] | 5.92 [5.70 - 6.22] | 1 | 6.4 | 7.8 |
| MBH25 | 50 | L15 | 0.35 [0/27 - 0.43] | 5.92 [5.69 - 6.23] | 2 | 7.2 | 9.1 |
| MBH26 | 51 | L16 | 0.53 [0.39 - 0.68] | 6.12 [5.86 - 6.47] | 18 | 4.9 | 6.6 |
| MBH4 | 52 | L17 | 0.31 [0.24 - 0.38] | 6.18 [5.96 - 6.49] | 3 | 8.3 | 10.4 |
| MBH5 | 53 | L18 | 0.22 [0.19 - 0.25] | 5.32 [5.15 - 5.58] | 1 | 10.5 | 13.8 |
| MBH7 | 54 | L19 | 0.37 [0.31 - 0.45] | 6.06 [5.84 - 6.38] | 6 | 6.8 | 8.8 |
V0, baseline HCV RNA; δ, infected-cell loss rate; Due to lack of empirical data points during the first phase c was set to 6/day and ε was estimated 0.997 (Table S1);
relapser;
Minimum pretreatment estimates using Eq. S3; 95CI: 95% confidence interval; V0 was significantly different among treatment arms P=0.048 (Kruskal-Wallis test).
Predicting time to cure
Using the estimated individual parameters (Table 2) we calculated the time to reach less than one virus copy in the entire extracellular fluid of each patient. The mean time to virus clearance from the extracellular fluid was 6.9 weeks [95% confidence interval, CI: 6.1 to 7.7 weeks] with no significant (P>0.23) difference between treatment groups or cirrhosis versus no cirrhosis. To be conservative, we stratified the duration of therapy needed to achieve virus eradication based on model predictions as follows: (i) subjects with predicted viral eradication in less than 6 weeks could be assigned to 6 weeks therapy, (ii) subjects with predicted viral eradication between 6 to 8 weeks could be assigned to 8 weeks therapy, (iii) subjects with predicted viral eradication between 8 to 10 weeks could be assigned to 10 weeks therapy and (iv) subjects with predicted viral eradication between 10 to 12 weeks could be assigned to 12 weeks therapy. As such, 32 (43%) subjects were predicted to reach <1 virus copy in the extracellular fluid within 6 weeks of therapy,16 (23%) subjects by 8 weeks of therapy, 7 (13%) subjects by 10 weeks of therapy, and 5 (9%) subjects were projected to need the full 12 weeks of therapy (Fig. 3). Restricting the analysis to patients with HCV genotype-1 (n=50) did not change the pattern of results. Three (6%) subjects (one in the SOF+DAC group and 2 in the SOF+LEDI group, of whom one was a relapser; Table 2) were predicted to reach <1 virus copy after a total of 13 weeks of treatment, one week more than the standard 12 week treatment course (Table 3). This result suggests that modeling may have benefitted the patient who relapsed by extending treatment, while unnecessarily predicting the need for an additional week of treatment in 2 cases (3%) who achieved SVR with 12 weeks of therapy. Further theoretical analysis assuming an even more conservative definition of cure defined as not only <1 virus copy in the entire extracellular fluid but also <1 infected hepatocyte predicted that >12 weeks of treatment (an additional 1.7 weeks of treatment on average, Table 2) would be required in 5 more individuals, which would have been unnecessary (Fig. S4) as discussed in the Supplementary Information.
Fig. 3.
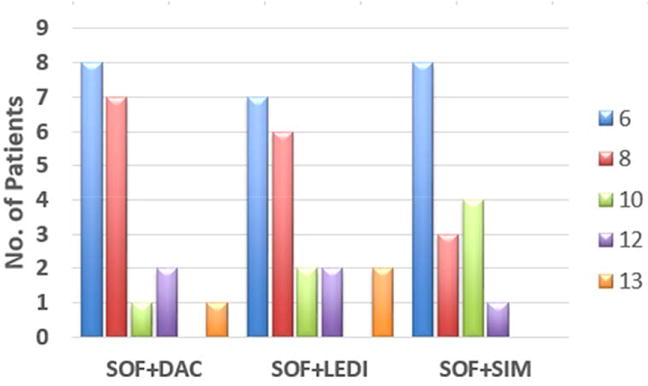
Projected treatment duration (weeks) to reach cure based on a viral cure boundary defined as <1 virus copy in entire patient extracellular fluid (~13.5L). SOF, sofosbuvir; DAC, daclatasvir; SIM, simeprevir; LEDI, ledipasvir.
Table 3.
Cost-impact analysis using modeling on therapy with sofosbuvir in combination of simeprevir, daclatasvir or ledipasvir.
| Observed time to HCV RNA <15 IU/ml [days] |
n (%) | Predicted number of patients and treatment duration to reach virus cure* n [weeks] |
Estimated treatment cost saving (in France) to reach virus cure* compared to standard 12 weeks of therapy [x1000€] |
Estimated treatment cost saving to reach virus cure* compared to standard 12 weeks of therapy in 100 subjects |
|---|---|---|---|---|
| 2 | 3(5%) | 3[N/A] | 1% | |
| 14 | 25(43%) | 22 [6]+ 1[10]+1[12]+1[N/A] | 650 | 45% |
| 28 | 23(40%) | 1[6]+16 [8]+6[10] | 397 | 30% |
| 42 | 7(12%) | 4 [12] + 3 [13] | 44** | 11% |
| Total | 23[6]+16[8]+7[10]+9[12]+3[13] | 1091 | 20% |
Virus cure is defined as <1 virus copy in the entire extracellular body fluid;
additional 3 weeks of therapy (extra cost of 14,542€) but assuming that additional week would have achieved SVR in the subject who relapsed, i.e., saving of average cost (58,167€) of DAA therapy in France; N/A, not available due to insufficient viral load measurements.
We further investigated whether pretreatment viral load and/or time to HCV<15 IU/ml can be used as response-guided therapy (RGT) markers of the time to cure projected by modeling. Pre-treatment viral loads were not associated (P=0.115) with modeling predicting time to cure as shown in Table 3. In contrast, the time to HCV<15 IU/ml was highly associated with the projected time to cure. The modeling indicated that 22 (92%) patients who had HCV <15 IU/ml at day 14 would have reached the cure boundary with 6 weeks of therapy. HCV<15 IU/ml at day 28 was less predictive since seventeen (74%) and 6 (26%) of patients who had HCV<15 IU/ml at day 28 might have been cured with 8 and 10 weeks of therapy, respectively. However, the modeling indicated a 100% cure rate if all patients with HCV<15 IU/ml at day 28 would be have been treated for 10 weeks (Table 4).
Table 4.
Cost-impact analysis using response-guided therapy with sofosbuvir in combination of simeprevir, daclatasvir or ledipasvir.
| HCV RNA <15 IU/ml [days] |
n (%) | Therapy duration [weeks] |
Projected outcome using response-guided therapy (RGT) n [outcome] |
Estimated treatment cost saving (in France#) using RGT compared to standard 12 weeks of therapy [x1000€] |
Estimated treatment cost saving using RGT compared to standard 12 weeks of therapy in 100 subjects |
|---|---|---|---|---|---|
| 14 | 28(48%) | 6 | 26* [SVR] + 2** [non-SVR] | 698@ | 43% |
| 28 | 23(40%) | 10 | 23 [SVR] | 223 | 17% |
| 42 | 7(12%) | 12 | 6 [SVR] + 1*** [non-SVR] | 0& | 0% |
| Total | 921 | 16% |
Assuming that the 3 and 1 patients who had HCV<15 at days 2 and 7, respectively, in which modeling could not be performed (Table 3), would have achieved cure with 6 weeks of therapy;
projected relapsers since modeling projected more than 6 weeks to reach cure (Table 3);
observed relapser in the current study;
Assuming extra cost to re-treat the 2 non-SVR with a 12 week course of dual therapy;
no difference since one patient was a relpaser;
Average cost (58,167€) of DAA therapy as in Table 3.
Cost-Impact analysis
While prices vary from country to country, in France, where the study population was treated, the cost of 12 weeks of therapy currently is 41,000€ for SOF and 21,000€ for SIM and 25,500€ for DAC, yielding a total cost of 62,000€ or 66,500€ per patient for SOF+SIM or SOF+DAC, respectively. The cost of SOF+LEDI (harvoni) in France is 46,000€. For simplicity, we calculated the cost as the average of the three regimens, i.e., 58,167€ per patient. The use of modeling to reduce duration of therapy in the 25 subjects who had HCV<15 IU/ml at day 14 would have led to a total savings of 45% (i.e., 649,528€) in drug costs. In the 23 subjects who had HCV RNA<15 IU/ml at day 28, adjusting the duration of therapy based on modeling would have produced a total saving of 30% (i.e., 397,472€) in drug cost (Table 3). Three (of 7) subjects who had HCV RNA<15 IU/ml at day 42 were projected, based on modeling, an additional week of therapy, i.e., an extra cost of 4% (i.e., 14,542€), however assuming an additional week of therapy would have avoided the observed viral relapse in one patient could produce a total saving of 11% (43,625€) in drug cost (Table 3).
We further explored whether the time to HCV<15 IU/ml can theoretically replace on treatment modeling of early HCV kinetics with a simple RGT approach as described in Table 4. The use of RGT to reduce duration to 6 weeks of therapy in the 28 subjects who had HCV<15 IU/ml by day 14 would have led to a total savings of 43% (i.e., 698,000€) in drug costs. In the 23 subjects who had HCV RNA<15 IU/ml at day 28, a 10 week duration of therapy would have produced a total saving of 17% (i.e., 222,972€) in drug cost. The remaining 7 patients who had HCV<15 at day 42 would have required the standard 12 week treatment course.
Data from the present cohort were used to scale up the projected cost saving per 100 patients receiving individualized duration of therapy based on modeling viral kinetics or RGT approach based on the time to HCV negativity (<15 IU/ml). For this analysis, it was predicted that immediate responders (HCV<15 IU/ml at day 2), in whom viral load is not available for accurate math modeling, would achieve cure with 6 weeks of treatment. The average cost savings for 100 persons treated with SOF+SIM, DAC or LEDI would be of 16% and 20% using modeling and RGT approaches, respectively (Tables 3 and 4).
Discussion
The current treatment duration recommendations for the new HCV DAAs are based on pre-treatment factors including HCV genotype, serum HCV RNA level, presence of cirrhosis and previous treatment response. There are a lack of data evaluating whether length of therapy can be individualized using on-treatment viral kinetics. In the current study, HCV RNA measurements made at weeks 2 and 4, which are recommended for routine monitoring by the EASL 2015 Clinical Practice Guidelines, were analyzed using established kinetic models to estimate the time to cure with DAA therapy. Difficult to treat patients were represented in the study population including 57% with cirrhosis and 76% who were treatment experienced. The results were striking in that modeling predicted that therapy could have been shortened in more than 80% of cases without affecting SVR rates. Specifically, modeling suggested that 42% of subjects likely reached cure after 6 weeks of therapy and 42% likely achieved cure by 8 to 10 weeks of treatment. This reduction in length of treatment translates into a projected cost savings of about 1 million euro per 100 treated patients, based on current DAA pricing in France. The modeling also suggested that the one patient who relapsed might have benefited from a longer duration of therapy.
Given the high cost of the DAAs and the risk of adverse events in older (>65 yr) patients there is substantial interest in minimizing length of therapy [6]. A number of small recent and ongoing studies show efficacy for fixed regimens consisting of less than 12 weeks of therapy. As an example, the ALLY-2 trial with 8 weeks of SOF+DAC for treatment-naïve patients HIV coinfected patients (genotypes 1- 4) yielded an SVR 12 rate of 76% (n=38/50)[28]. In the OPTIMIST 1 multicenter randomized study in G1 non cirrhotic patients, 8 weeks duration of SOF+SIM treatment yielded 83% SVR12 compared to 87% SVR12 after 12 weeks of treatment, with a negative impact of the Q80K polymorphism on the shorter duration arm of therapy[29]. A phase 2 pilot study evaluating 8 weeks of treatment with ACH-3102 (uridine-analog Nucleotide HCV NS5B polymerase inhibitor) in combination with SOF for genotype 1 treatment-naïve HCV yielded 100% (n=12/12) SVR12[30]. The C-SWIFT trial, which included a 6 weeks treatment arm with SOF+MK-5172+MK-8742 reported interim SVR4/8 rates of 87% (n=36/30) in non-cirrhotic and 80% (n=16/20) in cirrhotic treatment-naïve patients with HCV genotype-1 infection[31]. Interestingly, the C-SWIFT 4 week treatment duration arm in non-cirrhotic patients with the same DAAs yielded about 39% (n=12/31) SVR4/8 rate. The ION-3 trial suggests that treatment-naïve HCV genotype-1 subjects without cirrhosis who had baseline HCV RNA <6 million IU/ml can achieve high SVR rates with an 8-week course of therapy with SOF+LEDI [32]. (In the current study only 3 patients fall in this category. Interestingly, two subjects were treated with SOF+SIM and 1 with SOF+DAC with projected durations of 6 and 8 weeks of dual DAA to reach cure, respectively). These studies provide proof of concept that HCV can be eradicated in as short as 4 to 6 weeks. However, HCV regimens continue to be fixed in duration and the proliferation of studies with varying drug combinations and durations of treatment makes for a chaotic treatment landscape. Individualizing therapy based on viral kinetic analysis of routine HCV RNA measurements at weeks 2 and 4 (EASL 2015 guidelines) provides a practical approach to minimize duration of treatment, while maximizing SVR rates. As evidenced by the current study, this strategy should transcend treatment regimen.
The percentage of patients with HCV<15 IU/ml by week 4 of SOF+SIM or SOF+DAC treatment in the current study (88%) was higher compared to a larger French cohort (n=200) in which 53% were HCV <12 IU/ml[33]. This may partly explain why in our small cohort, 98% of patients achieved SVR12 compared to 95% SVR4 (n=189/200) in the larger French cohort. In agreement with other studies of DAA regimens, viral kinetics (at weeks 4, 8 and 12) performed in the study by Hezode et al. did not predict SVR4 in patients receiving SOF in combination with DAC or SIM for 12 weeks [11, 12, 33, 34] . However in the era of DAA high SVR rates, it is far less important to predict treatment outcome. Instead, we suggest in the current study to use HCV kinetics to determine duration of treatment needed to achieve cure. Our results indicate that pretreatment viral load level per se should not be used as a predictor of the duration of therapy to achieve cure. Instead, the current study indicates that reaching HCV <15 IU/ml within 4 weeks might be used to guide duration of therapy. Modeling results project that 92% and 100% of patients who had <15 IU/ml HCV RNA at week 2 and 4, respectively, might have achieved cure with 6 and 10 weeks of dual DAA therapy (Tables 3 and 4). A recent proof of concept study (ClinicalTrials.gov number NCT02470858), suggests that non-cirrhotic Chinese patients, in whom viral load was <500 IU/ml at day 2 of therapy, achieved SVR after 3 weeks of all-oral-triple DAA therapy [35]. Interestingly, 3 patients in the current study with dual DAA therapy had HCV RNA <15 IU/ml at day 2, suggesting that cure would have achieved after ~4 weeks after initiation of therapy assuming these patients had an average δ~0.4/day (as estimated for the entire treated population, Table S1).
Two subjects (treated with SOF+LEDi or SOF+DAC) were unnecessarily predicted to require an additional week of therapy, despite achieving an SVR with 12 weeks of treatment (Table 3). This finding suggests that the 2 subjects may have (i) had a higher cure boundary, (ii) experienced an immune-mediated effect when viral load was below detection that led to a higher HCV-infected cell loss rate (compared to the observed 2nd phase decline or parameter δ), (iii) experienced stochastic viral eradication when viral load was small, e.g., close to the cure boundary, and/or (iv) that DAAs may effect the ratio between non-infectious and infectious viral particles [36]. Interestingly, (ii) and (iv) were suggested as possible explanations for recent reports documenting that some patients treated with DAAs achieved SVR despite having detectable viremia at end of treatment [37-40]. The role of interferon lambda-3 polymorphism (formerly called IL28B [41]) in (ii) is not known since testing is not recommended in France and is not available in the current study. While the biphasic model is not designed to predict (ii) - (iv), the individualized treatment approach proposed in the current study may be found useful in most cases [42]. Overall, extending treatment for a short duration in a small number of cases based on modeling may add an additional margin of safety and prevent viral relapse.
The prediction of the time to the last virion in circulation can be considered robust due to available measurements of the viral load in blood. In the Supplementary Information, we explored a second cure boundary, the time to eradication of the last infected cell, which is more speculative due to lack of experimental data on the infected cell level. To partly address this limitation, we estimated for each patient the fraction of HCV-infected hepatocytes before treatment initiation based on his/her body weight and pretreatment HCV RNA level (Supplementary Information). Since all but one subject achieved SVR, the prediction of more than 12 weeks of treatment to achieve <1 infected cell in 8 individuals (Fig. S4) was clearly an overestimate. Therefore, the last virion in the entire extracellular body fluid provides the preferred cure boundary. Infrequent viral sampling during the first two days of treatment limited application of multi-scale modeling [43, 44]. However, an exploratory analysis indicated that the standard biphasic model used here approximated a multi-scale approach and did not bias the findings toward predicting shorter time to cure (not shown).
In summary, established viral kinetic models can be applied to on-treatment HCV RNA measurements to predict duration of DAA therapy needed to achieve cure [13, 45]. Real-time application of viral kinetic analysis has the potential to individualize treatment duration. Importantly, kinetic modeling suggested that DAA treatment could have been shortened in more than 80% of the French patients analyzed in this study, with an average projected cost savings of 16%-20% per 100 treated patients. Further studies are needed to confirm these findings. If validated by larger prospective studies, kinetic modeling of routinely obtained on-treatment HCV RNA measurements to estimate optimal length of treatment could transform the DAA treatment paradigm.
Supplementary Material
Acknowledgments
Financial support: Portion of this work were supported by NIH grants R01-AI078881 (SLU and HD) and P20-GM103452 (HD), the U.S. Department of Energy contract DE-AC52-06NA25396 (HD), the UK Biotechnology and Biological Sciences Research Council - grant reference 1698:BB/L001330/1 (LC), and the Center for Modeling and Simulation in the Biosciences (FG).
Role of the Sponsor: None of the sponsors had any role in the design and conduct of the study; collection, management, analysis and interpretation of the data; preparation, review, or approval of the manuscript; and decision to submit the manuscript for publication.
Abbreviations
- HCV
hepatitis C virus
- DAAs
direct-acting antiviral agents
- SVR
sustained virological response
Footnotes
Conflict of Interest Disclosures: None of the authors has any financial interest or conflict of interest related to this research.
Writing Assistance: None.
References
- 1.Webster DP, Klenerman P, Dusheiko GM. Lancet. 2015;385:1124–35. doi: 10.1016/S0140-6736(14)62401-6. [DOI] [PMC free article] [PubMed] [Google Scholar]
- 2.Schinazi R, Halfon P, Marcellin P, Asselah T. Liver Int. 2014;34(Suppl 1):69–78. doi: 10.1111/liv.12423. [DOI] [PMC free article] [PubMed] [Google Scholar]
- 3.Bourliere M, Bronowicki JP, de Ledinghen V, Hezode C, Zoulim F, Mathurin P, et al. Lancet Infect Dis. 2015;15:397–404. doi: 10.1016/S1473-3099(15)70050-2. [DOI] [PubMed] [Google Scholar]
- 4.Reddy KR, Bourliere M, Sulkowski M, Omata M, Zeuzem S, Feld JJ, et al. Hepatology. 2015 [Google Scholar]
- 5.Sulkowski MS, Naggie S, Lalezari J, Fessel WJ, Mounzer K, Shuhart M, et al. JAMA. 2014;312:353–61. doi: 10.1001/jama.2014.7734. [DOI] [PMC free article] [PubMed] [Google Scholar]
- 6.Mizokami M, Yokosuka O, Takehara T, Sakamoto N, Korenaga M, Mochizuki H, et al. Lancet Infect Dis. 2015 doi: 10.1016/S1473-3099(15)70099-X. [DOI] [PubMed] [Google Scholar]
- 7.Pawlotsky JM, Feld JJ, Zeuzem S, Hoofnagle JH. J Hepatol. 2015;62:S87–S99. doi: 10.1016/j.jhep.2015.02.006. [DOI] [PubMed] [Google Scholar]
- 8.Rein DB, Wittenborn JS, Smith BD, Liffmann DK, Ward JW. Clin Infect Dis. 2015 doi: 10.1093/cid/civ220. [DOI] [PMC free article] [PubMed] [Google Scholar]
- 9.Ferenci P, Laferl H, Scherzer TM, Gschwantler M, Maieron A, Brunner H, et al. Gastroenterology. 2008;135:451–8. doi: 10.1053/j.gastro.2008.04.015. [DOI] [PubMed] [Google Scholar]
- 10.Hoofnagle JH, Wahed AS, Brown RS, Jr, Howell CD, Belle SH, Virahep CSG. J Infect Dis. 2009;199:1112–20. doi: 10.1086/597384. [DOI] [PubMed] [Google Scholar]
- 11.Sulkowski MS, Fried MW, Ozaras R, Isakov V, Wyles DL, Ferenci P, et al. Hepatology. 2014;60:1144A–1145A. [Google Scholar]
- 12.Zeuzem S, Dusheiko GM, Colombo M, Flisiak R, Hyland RH, Illeperuma A, et al. J Hepatol. 2014;60:S452. [Google Scholar]
- 13.Dahari H, Shteingart S, Gafanovich I, Cotler SJ, D’Amato M, Pohl RT, et al. Liver Int. 2015;35:289–94. doi: 10.1111/liv.12692. [DOI] [PMC free article] [PubMed] [Google Scholar]
- 14.Bourlière M, Bronowicki JP, Hezode C, Larrey D, de Ledinghen V, Leroy V, et al. Hepatitis C Treatment - Experts recommendations 5 - January 2015. AFEFoie. 2015 [Google Scholar]
- 15.Biopredictive. [April 2015];Non-invasive liver biomarkets. [Google Scholar]
- 16.Castera L, Vergniol J, Foucher J, Le Bail B, Chanteloup E, Haaser M, et al. Gastroenterology. 2005;128:343–50. doi: 10.1053/j.gastro.2004.11.018. [DOI] [PubMed] [Google Scholar]
- 17.Shaheen AA, Wan AF, Myers RP. Am J Gastroenterol. 2007;102:2589–600. doi: 10.1111/j.1572-0241.2007.01466.x. [DOI] [PubMed] [Google Scholar]
- 18.Dhumeaux D. In: Prise en charge des personnes infectées par les virus de l’hépatite B ou de l’hépatite C. ANRS A, editor. Chapitre 7. EDK / Groupe EDP Sciences ed; 2014. [Google Scholar]
- 19.Bonder A, Afdhal N. Curr Gastroenterol Rep. 2014;16:372. doi: 10.1007/s11894-014-0372-6. [DOI] [PubMed] [Google Scholar]
- 20.Poynard T, Imbert-Bismut F, Munteanu M, Messous D, Myers RP, Thabut D, et al. Comp Hepatol. 2004;3:8. doi: 10.1186/1476-5926-3-8. [DOI] [PMC free article] [PubMed] [Google Scholar]
- 21.Zarski JP, Sturm N, Guechot J, Paris A, Zafrani ES, Asselah T, et al. J Hepatol. 2012;56:55–62. doi: 10.1016/j.jhep.2011.05.024. [DOI] [PubMed] [Google Scholar]
- 22.Kessler HH, Cobb BR, Wedemeyer H, Maasoumy B, Michel-Treil V, Ceccherini-Nelli L. J Clin Virol. 2015;67:67–72. doi: 10.1016/j.jcv.2015.03.023. [DOI] [PubMed] [Google Scholar]
- 23.Neumann AU, Lam NP, Dahari H, Gretch DR, Wiley TE, Layden TJ, et al. Science. 1998;282:103–7. doi: 10.1126/science.282.5386.103. [DOI] [PubMed] [Google Scholar]
- 24.Kuhn E, Lavielle M. Comput Stat Data Anal. 2005;49:1020–1-38. [Google Scholar]
- 25.Snoeck E, Chanu P, Lavielle M, Jacqmin P, Jonsson EN, Jorga K, et al. Clin Pharmacol Ther. 2010;87:706–13. doi: 10.1038/clpt.2010.35. [DOI] [PubMed] [Google Scholar]
- 26.Dixit NM, Layden-Almer JE, Layden TJ, Perelson AS. Nature. 2004;432:922–4. doi: 10.1038/nature03153. [DOI] [PubMed] [Google Scholar]
- 27.Guedj J, Perelson AS. Hepatology. 2011;53:1801–8. doi: 10.1002/hep.24272. [DOI] [PMC free article] [PubMed] [Google Scholar]
- 28.Wyles D, Ruane PJ, Sulkowski MS, Dieterich D, Luetkemeyer A, Morgan TR, et al. CROI. 2015 [Google Scholar]
- 29.Kwo P, Gitlin N, Nahass R, Bernstein D, Rojter E, Schiff E, et al. Journal of Hepatology. 2015;62:S270. [Google Scholar]
- 30.Gane E, Kocinsky H, Schwabe C, Mader M, Suri V, Donohue M, et al. Hepatology. 2014;60 LB-23. [Google Scholar]
- 31.Lawitz E, Poordad F, Gutierrez JA, Evans B, Hwang P, Robertson M, et al. Hepatology. 2014;60 LB-33. [Google Scholar]
- 32.Kowdley KV, Gordon SC, Reddy KR, Rossaro L, Bernstein DE, Lawitz E, et al. N Engl J Med. 2014;370:1879–88. doi: 10.1056/NEJMoa1402355. [DOI] [PubMed] [Google Scholar]
- 33.Hezode C, Chevaliez S, Scoazec G, Bouvier-Alias M, Ruiz I, Francois M, et al. Journal of Hepatology. 2015;62:S654–S655. [Google Scholar]
- 34.Welzel TW, Reddy KR, Flamm SL, Denning J, Arterburn S, Brandt-Sarif T, et al. Journal of Hepatology. 2015;62:S667–S668. [Google Scholar]
- 35.Lau KG, Benhamou Y, Chen G, Li J, Shao Q, Ji D, et al. Hepatology. 2015;62(1(Suppl)):1394A. [Google Scholar]
- 36.Sansone ND, Dahari H, Subramanian GM, Perelson AS, Uprichard SL. Hepatology. 2014;60(Suppl):1165A. [Google Scholar]
- 37.Kohli A, Osinusi A, Sims Z, Nelson A, Meissner EG, Barrett LL, et al. Lancet. 2015;385:1107–13. doi: 10.1016/S0140-6736(14)61228-9. [DOI] [PMC free article] [PubMed] [Google Scholar]
- 38.Sidharthan S, Kohli A, Sims Z, Nelson A, Osinusi A, Masur H, et al. Clin Infect Dis. 2015 doi: 10.1093/cid/civ170. [DOI] [PMC free article] [PubMed] [Google Scholar]
- 39.Sarrazin C, Wedemeyer H, Cloherty G, Cohen DE, Chevaliez S, Herman C, et al. J Virol Methods. 2015;214:29–32. doi: 10.1016/j.jviromet.2014.11.027. [DOI] [PubMed] [Google Scholar]
- 40.Harrington PR, Deming DJ, Komatsu TE, Naeger LK. Clin Infect Dis. 2015;61:666–7. doi: 10.1093/cid/civ402. [DOI] [PubMed] [Google Scholar]
- 41.Stattermayer AF, Ferenci P. Curr Opin Virol. 2015;14:50–5. doi: 10.1016/j.coviro.2015.07.011. [DOI] [PubMed] [Google Scholar]
- 42.Gambato M, Canini L, Lens S, Graw F, Londoño CM, Uprichard SL, et al. Hepatology. 2015;62(1(Suppl)):691A. [Google Scholar]
- 43.Rong L, Guedj J, Dahari H, Coffield DJ, Jr, Levi M, Smith P, et al. PLoS Comput Biol. 2013;9:e1002959. doi: 10.1371/journal.pcbi.1002959. [DOI] [PMC free article] [PubMed] [Google Scholar]
- 44.Guedj J, Dahari H, Rong L, Sansone ND, Nettles RE, Cotler SJ, et al. Proc Natl Acad Sci U S A. 2013;110(10):3991–6. doi: 10.1073/pnas.1203110110. [DOI] [PMC free article] [PubMed] [Google Scholar]
- 45.Dahari H, Cotler SJ. Hepatology. 2014;59(6):2422–3. doi: 10.1002/hep.26772. [DOI] [PMC free article] [PubMed] [Google Scholar]
Associated Data
This section collects any data citations, data availability statements, or supplementary materials included in this article.