

Abstract
Objective
Non-alcoholic fatty liver disease is a world-wide health concern and risk factor for cardio-metabolic diseases. Citrate uptake modifies intracellular hepatic energy metabolism and is controlled by the conserved sodium-dicarboxylate cotransporter solute carrier family 13 member 5 (SLC13A5, mammalian homolog of INDY: mINDY). In Drosophila melanogaster and Caenorhabditis elegans INDY reduction decreased whole-body lipid accumulation. Genetic deletion of Slc13a5 in mice protected from diet-induced adiposity and insulin resistance. We hypothesized that inducible hepatic mINDY inhibition should prevent the development of fatty liver and hepatic insulin resistance.
Methods
Adult C57BL/6J mice were fed a Western diet (60% kcal from fat, 21% kcal from carbohydrate) ad libitum. Knockdown of mINDY was induced by weekly injection of a chemically modified, liver-selective siRNA for 8 weeks. Mice were metabolically characterized and the effect of mINDY suppression on glucose tolerance as well as insulin sensitivity was assessed with an ipGTT and a hyperinsulinemic-euglycemic clamp. Hepatic lipid accumulation was determined by biochemical measurements and histochemistry.
Results
Within the 8 week intervention, hepatic mINDY expression was suppressed by a liver-selective siRNA by over 60%. mINDY knockdown improved hepatic insulin sensitivity (i.e. insulin-induced suppression of endogenous glucose production) of C57BL/6J mice in the hyperinsulinemic-euglycemic clamp. Moreover, the siRNA-mediated mINDY inhibition prevented neutral lipid storage and triglyceride accumulation in the liver, while we found no effect on body weight.
Conclusions
We show that inducible mINDY inhibition improved hepatic insulin sensitivity and prevented diet-induced non-alcoholic fatty liver disease in adult C57BL6/J mice. These effects did not depend on changes of body weight or body composition.
Keywords: INDY/Slc13a5, siRNA, Insulin resistance, Steatosis, Citrate transport, Lipid accumulation
Abbreviations: 2-DG, 2-Deoxy-d-glucose; e, epididymal; p, perirenal; s, subcutaneous; WAT, white adipose tissue; EE, energy expenditure; EGP, endogenous glucose production; FA, fatty acids; FLD, fatty liver disease; GIR, glucose infusion rate; HE clamp, hyperinsulinemic-euglycemic clamp; HFD, high-fat diet; IEX, anion-exchange high-performance liquid chromatography; INDY, ‘I'm not dead Yet’; KO, knockout; mINDY, Slc13a5/SLC13A5; solute carrier family 13, member 5; ORO, oil red O; RER, respiratory exchange ratio; SCR, non-silencing scrambled control siRNA; siINDY, mINDY-specific siRNA; SKM, skeletal muscle; T2D, type-2 diabetes; TCA, tricarboxylic acid; WD, western diet
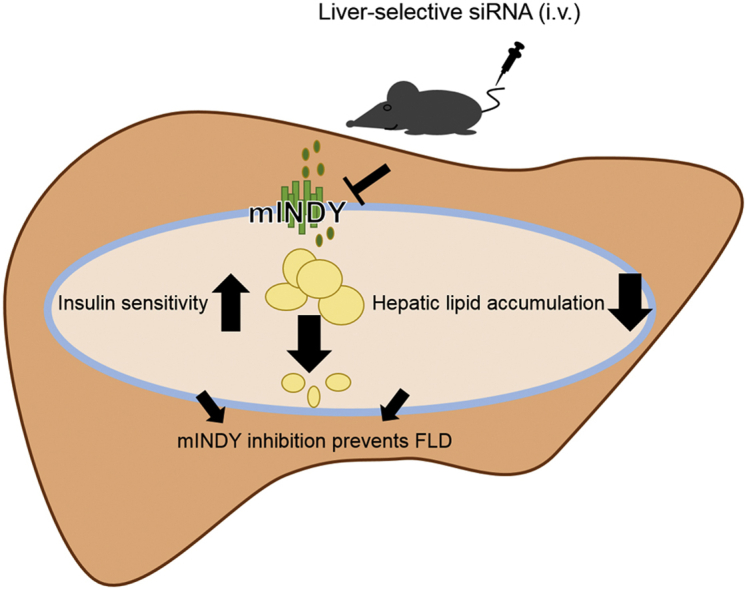
Graphical abstract
Highlights
-
•
mINDY/Slc13a5 knockdown was induced by liver-selective siRNA in mice.
-
•
Liver-selective knockdown of mINDY improved hepatic insulin sensitivity.
-
•
Liver-selective knockdown of mINDY prevented steatosis hepatis.
1. Introduction
Non-alcoholic fatty liver disease (NAFLD) is a global health concern. Estimates suggest approximately 3.4 million deaths/year from obesity-associated diseases such as cardiovascular disease, type-2 diabetes (T2D), and certain types of cancer [1], [2], [3], [4]. NAFLD has been recognized as one of the leading causes of liver cirrhosis today [5], [6]. It is present in up to 30% of Americans and is involved in the development of insulin resistance (IR) and T2D [5]. Available treatment options for NAFLD are sparse.
Pathophysiological accumulation of intracellular hepatic lipids results from increased energy supply and de-novo-lipogenesis together with insufficient fatty acid (FA) oxidation and secretion from liver [7]. Hepatic fat accumulation has been linked to IR via specific lipid species such as diacylglycerols and ceramides [8].
Cytosolic citrate is a precursor for FA synthesis in the liver, and consequently triacylglycerols and cholesterol. Moreover, citrate has signaling properties modifying the activity of FA synthesis pathways by an allosteric activation of acetyl-CoA carboxylase 2 [9]. The resulting malonyl-CoA from this reaction inhibits FA oxidation. Moreover, citrate has been shown to reduce the flux of glucose through glycolysis in human cells [10]. In liver and adipose tissue, the rate of FA synthesis appears to correlate with the cytosolic citrate concentration and this is partially depending on direct transport of citrate into the cell by solute carrier family 13, member 5 (SLC13A5) [10].
The SLC13A5 gene is the mammalian ortholog of the ‘I'm not dead, Yet’ (INDY) gene in Drosophila melanogaster where its mutation is linked to a life-span extension [11]. The human SLC13A5 gene encodes a transmembrane sodium-dependent dicarboxylate cotransporter protein [12]. In vertebrates, it is referred to as mammalian INDY homolog (mINDY), Nact, or NaC2/NaCT. mINDY is highly expressed in liver and moderately in brain, testis, and kidney, where it transports TCA cycle intermediates, including succinate and citrate, but also malate, fumarate and 2-oxo-glutarate [12], [13], [14], [15], [16]. The transport process for cellular uptake of citrate is several times more selective than for other TCA cycle intermediates [17]. The Na+-dicarboxylate cotransport process is electrogenic, coupling three to four Na+ ions to the transport of each divalent anion substrate [12], [17], [18], [19]. In D. melanogaster and Caenorhabditis elegans, down-regulation of INDY facilitated longevity similar to caloric restriction and resulted in reduced fat storage in flies [11], [20], [21]. We have recently shown in C. elegans that longevity induced by INDY knockdown depends on AMPK [22]. Genetic whole-body deletion of mINDY in mice also led to striking similarities to caloric restriction and protected mice from high-fat diet (HFD)-induced obesity, steatosis hepatis, and IR by increasing energy expenditure, improving hepatic mitochondrial biogenesis, enhancing hepatic FA oxidation, and reducing hepatic lipogenesis [16]. In primary rat hepatocytes, mINDY expression and citrate uptake could be induced by physiological concentrations of glucagon via a cAMP-dependent and cAMP-responsive element-binding protein (CREB)-dependent mechanism at a confirmed CREB-binding site within the mINDY promoter [23]. In line with these observations, the siRNA-mediated knockdown of mINDY in human HepG2 cells reduced their lipid content [24].
Based on the predominant expression in liver, its relative selectivity for citrate, and the promising data from existing studies including the whole-body knockout (KO) experiments, mINDY is a potential therapeutic target to treat NAFLD and metabolic disorders in humans [14], [15], [16], [24].
We hypothesized that inducible hepatic mINDY inhibition should prevent the development of fatty liver and hepatic IR. Therefore, we investigated the effects of an inducible liver-specific, siRNA-based mINDY knockdown in adult C57BL/6J mice.
2. Material and methods
2.1. Materials
All chemicals were purchased from Sigma-Aldrich (Munich, Germany), Merck (Darmstadt, Germany), or Roth (Karlsruhe, Germany), reagents for RNA, cDNA, and qPCR were purchased from Thermo Scientific (Schwerte, Germany), and radioactive labeled substances were purchased from Hartman Analytic (Braunschweig, Germany) unless stated otherwise.
2.2. Animal studies
All animal experiments were performed under the terms of the German Animal Protection Law, and according to the EU Directive 2010/63/EU for animal experiments as well as international animal welfare legislation and rules. Additionally, mice studies were conducted according to institutional ethical guidelines of the Charité Berlin, Germany, and were approved by the Landesamt für Gesundheit und Soziales (approval number G 0331/13, LAGeSo Berlin, Germany) and comply with the ARRIVE guidelines [25].
8 week-old male C57BL6/J mice (Forschungseinrichtungen für experimentelle Medizin, Charité Berlin, Germany) were fed ad libitum a Western diet (WD) consisting of a HFD (60% kcal from fat, D12492 (I), Ssniff Spezialdiäten, Soest, Germany; Supplemental Table A1) supplemented with 6% sucrose in the water. All mice were maintained in individually ventilated cages (4/cage) in an environmentally-controlled room with a 12 h light–dark cycle. Body weight was monitored weekly. For siRNA intervention mice were divided into two groups according to equal fat mass. 1 mg/kg liver-selective mINDY-specific (siINDY) or unspecific scrambled control siRNA (SCR) in PBS was weekly injected via tail vein for 8 weeks. Body composition of mice was assessed by 1H-magnetic resonance spectroscopy using a Minispec LF50 Body Composition Analyzer (Bruker BioSpin, Billerica, USA). Isoflurane inhalation (1.5%) was used for anesthesia during operation, and mice were sacrificed by cervical dislocation.
2.2.1. Activity and calorimetry analysis
Basal metabolic parameters were analyzed in a TSE LabMaster System (TSE Systems, Bad Homburg, Germany). Mice were acclimated to the metabolic cages individually housed 16 h before starting and supplied with WD. Data on gas exchanges, activity, and food/liquid intake was collected for 48 h and analyzed as 24 h average. Calorimetry was performed with a computer-controlled open circuit calorimetry system composed of 10 metabolic cages. Each cage was equipped with a special water bottle and a food tray connected to a balance as well as an activity monitor. Parameters were measured for each mouse at 3 min intervals and respiratory quotient (RQ) was calculated as the ratio of CO2 production to O2 consumption. O2 consumption, CO2 production, energy expenditure (EE), and caloric intake were adjusted for lean body mass. Data were analyzed as described [26]. Additionally taken in consideration that fat mass is metabolic active, there were no differences in lean body or fat mass between siINDY and control animals.
2.2.2. Glucose tolerance test (ipGTT)
Mice were fasted overnight and basal blood glucose was measured before injecting an intraperitoneal glucose bolus of 1 g/kg body weight. Blood glucose levels were measured subsequently at 0, 15, 30, 60 and 120 min and the corresponding insulin levels were determined.
2.2.3. Hyperinsulinemic-euglycemic clamp studies
Hyperinsulinemic-euglycemic (HE) clamp studies were performed in conscious, restrained mice with 3 mU/kg/min insulin in a body weight matched fashion and a 2-Deoxy-d-glucose (2-DG) bolus injection to measure tissue-specific glucose uptake as described [16], [27], [28]. Indwelling jugular venous catheters were implanted, and mice recovered for 7 days. Following an overnight fast, whole-body glucose turnover was estimated under basal conditions with a 0.05 μCi/min infusion of [2-3H]-d-glucose (HPLC purified) for 2 h. Afterwards, mice were primed with human insulin (21.43 mU/kg, INSUMAN rapid; Sanofi-Aventis, Frankfurt, Deutschland) and [2-3H]-d-glucose (0.72 μCi) over 3 min, followed by HE conditions for 140 min with a continuous insulin infusion (3 mU/kg/min) along with [2-3H]-d-glucose (0.1 μCi/min), and a variable infusion of 20% glucose to sustain euglycemia around 120 mg/dl. At 85 min, a 10 μCi 2-Deoxy-D-[1-14C]-glucose bolus was injected to assess insulin-stimulated tissue glucose uptake. According to standard operating procedures [27], [29], blood sampling was done via tail. An albumin-containing solution mimicking artificial plasma was infused (4.2 μl/min) during HE conditions to compensate the volume loss [30]. Plasma samples were obtained at −120, 0, 30, 50, 65, 80, 90, 100, 110, 120, 130, and 140 min. At 140 min, mice were anesthetized with Ketamine/Xylazine injection (100 mg/kg and 12 mg/kg, respectively) and tissues were quickly removed, immediately clamp-frozen in liquid nitrogen, and stored at −80 °C for following analysis.
2.3. siRNA preparation
2.3.1. Synthesis, purification and formulation of liver-selective mINDY-specific siRNA
RNA oligonucleotides were synthesized at a scale of 1 μmol (in vitro) or 10 μmol (in vivo) on a ABI 394 DNA/RNA or BioAutomation MerMade 12 synthesizer using commercially available 5′-O-DMT-3′-O-(2-cyanoethyl-N,N-diisopropyl) phosphoramidite monomers (SAFC) of uridine, 4-N-acetylcytidine (CAc), 6-N-benzoyladenosine (ABz) and 2-N-isobutyrylguanosine (GiBu) with 2′-O-TBDMS protection or 2′-OMe modification and 5′-O-DMT-thymidine-3′-O-(2-cyanoethyl-N,N-diisopropyl) phosphoramidite (dT) following standard protocols for solid phase synthesis and deprotection [31], [32]. The crude oligonucleotides were analyzed by anion-exchange high-performance liquid chromatography (IEX) and LC–MS and purified by IEX using a linear gradient of 10–50% buffer B in 30 min. Solutions of 0.02 M Na2HPO4 (pH11) and 0.02 M Na2HPO4/1 M NaBr (pH11) were used as eluents A and B, respectively. To ensure high fidelity of the data, all single strands were HPLC purified to >85% purity. The purity and identity of the oligonucleotides was confirmed by ion-exchange chromatography and LC–MS, respectively. For the cell culture experiments, 100 μM stock solutions were prepared by mixing equimolar amounts of complementary sense and antisense strands in PBS buffer, heating the solution to 90 °C for 10 min, and allowing it to slowly cool to room temperature to complete the annealing process. siRNAs were further characterized by HPLC and were stored frozen until use. Sequences of the modified siRNA (siINDY) directed against murine mINDY mRNA and SCR are depicted in Table 1. Formulation of siRNA for delivery to mouse liver in vivo was done in lipid nanoparticles (LNPs) based on the Axolabs' proprietary cationic lipid XL-10 (Axolabs, Kulmbach, Germany).
Table 1.
Sequences of siRNA molecules used in this study.
| siRNA | Sequence |
|---|---|
| siINDY* (On-Target-Plus siRNA, Dharmacon) | 5′-CCA CAG AGU GCA CAA GUA A dTdT-3′ |
| SCR* | 5′-UUU CGC GUA UAC GCG AAA C dTdT-3′ |
| siINDY sense | 5′-CCA CAG AGU GCA CAA GUA A dTdT-3′ |
| siINDY antisense | 5′-UUA CUU GUG CAC UCU GUG G dTdT-3′ |
| SCR sense | 5′-AUC GUA CGU ACC GUC GUA U dTdT-3′ |
| SCR antisense | 5′-AUA CGA CGG UAC GUA CGA U dTdT-3′ |
Capital letters: RNA; d:DNA.
2.3.2. siRNA stability in mouse serum
Modified siRNAs were tested for nuclease stability in 50% mouse serum. Therefore, 160 μl of 2.5 μM siRNA in 1× DPBS and 160 μl mouse serum (Sigma) was incubated at 37 °C for 0, 0.5, 2, 4, 6, 8, and 24 h. At each time-point, 20 μl of the reaction was taken out and quenched with a stop solution (Lysis Solution, Proteinase K, water) at 65 °C for 30 min. Prior to HPLC analysis on a Waters 2695 Separation Module and a 2487 Dual Absorbance Detector, RNase-free water was added to each sample. The solution was analyzed by HPLC using a DNAPac PA200 analytical column (Thermo Scientific). Serum half-lives were estimated for both strands of the siRNA and are shown in Table 2.
Table 2.
Chemical modification of siINDY improved its pharmacokinetic properties.
| siRNA | siINDY* (unmodified) | siINDY |
|---|---|---|
| IC50KD (nM) | 0.15 | 0.56 |
| ImaxKD (%) | 92 | 92 |
| Serum stability (h): t1/2 in 50% mouse serum | <2 | 4 |
| Cytotoxicity (%): Viability of Hepa1c1c7 cells | 78 | 135 |
| Immune stimulation (pg/ml): IFNα release PBMCs | 2144 | 70 |
ImaxKD: maximal knockdown of mINDY mRNA expression.
2.3.3. Immune stimulation of siRNA
Immuno-stimulative potential of siRNA was measured by secretion of IFNα from freshly isolated and transfected human peripheral blood mononuclear cells (PBMC). PBMCs were isolated from approx. 16 ml blood of three healthy donors that was collected in Vacutainer tubes coated with sodium heparin (BD, Heidelberg, Germany) according to the manufacturer's instructions. Subsequently, 100 nM siRNA was reverse transfected into 100,000 PBMCs with 0.3 μl Lipofectamine 2000 per 96-well (n = 2) in a total volume of 150 μl serum-free RPMI medium for 24 h. Single-stranded RNA (“R-0006”) and DNA (“CpG ODN”) oligonucleotides were applied as positive controls. 25 μl of the supernatant was used for measurement of IFNα concentration using a self-established electrochemiluminescence assay based on MesoScale Discovery's (MSD, Rockville, USA) technology. IFNα values are shown in Table 2.
2.3.4. siRNA transfection
HEK293 cells stably expressing murine mINDY and carrying a FLAG-tag for detection (HEK293-mINDY) were reversely transfected with siRNAs using Lipofectamine RNAiMAX (Thermo Scientific) according to the manufacturer's instructions. To avoid variations in the transfection efficiency when transfecting very low amounts for IC50 curves, 10 nM of non-targeting control (SCR*) were used in each transfection mix. The transfection was performed in 96-well plates adding 12,000 cells/well. 48 h post-transfection, RNA was isolated with the SV96 Total RNA isolation system and gene expression was analyzed as described in Richter et al., using primer for Slc13a5 (Mm01334459_m1, Thermo Scientific) and RPL37a (Mm01546394_s1, Thermo Scientific) [33].
2.3.5. Cytotoxicity assay
Hepa1c1c7 mouse hepatoma cells were reversely transfected with siRNAs using Lipofectamine RNAiMAX according to the manufacturer's instructions in 96-well plates. 72 h post-transfection, cell viability was analyzed with the ViaLight™ Plus Cell Proliferation and Cytotoxicity BioAssay Kit (Lonza, Cologne, Germany). Cytotoxicity was assessed in relation to the non-transfected control cells, which were set 100%.
2.3.6. Citrate uptake assay
25,000 HEK293-mINDY were seeded overnight in 96-well Cytostar-T scintillation plates (Perkin Elmer, Rodgau, Germany) or reversely transfected with siRNAs as described in section “siRNA transfection” and used 48 h post-transfection, washed, and incubated for 15 min in the presence of 50 μl/well PBS containing 100 μM [1,5-14C]-citrate (0.24 μCi/well; Perkin Elmer), 1% DMSO and the indicated concentrations of the compounds. Subsequently, cells were washed with ice-cold PBS and cellular radioactivity was measured by liquid scintillation counting. Four independent experiments carried out in technical triplicates.
2.3.7. In-Cell Western Assay
HEK293-mINDY cells were reversely transfected in a 96-well format with RNAiMAX as described in the section “siRNA transfection”. 48 h post-transfection, cells were fixed with 3.7% formaldehyde and the Odyssey In-Cell Western Assay (LiCor, Bad Homburg, Germany) was performed according to the manufacturer's instructions using an anti-FLAG M2 antibody (Sigma) overnight for detection of FLAG-tagged mINDY. Subsequently, the plate was incubated with a fluorescently labeled secondary goat-anti-mouse antibody (IRDye 800 CW, LiCor) and the CellTag 700 Stain (LiCor) for normalization to cell number. Fluorescence was measured with the Odyssey Scanner (LiCor).
2.4. Biochemical analysis
Plasma glucose levels of mice were determined by measuring at least in duplicates (≤10% discrepancy) using Contour XT glucometer (Bayer Vital, Leverkusen, Germany). Plasma NEFA were quantified by NEFA HR(2) kit (Wako Chemicals, Neuss, Germany). Plasma insulin concentration was analyzed with Rat Insulin ELISA kit and mouse insulin standard (Crystal Chem, Downers Grove, USA). Corticosterone levels were measured in plasma samples using a competitive Corticosterone ELISA kit (IBL International, Hamburg, Germany). Plasma lipid measurements were performed with a Cobas 6000 c501 module (Roche/Hitachi) according to manufacturer's instructions. Liver lipids were analyzed after lipid extraction described elsewhere [34], [35], with an AU680 Analyzer (Beckman Coulter/Olympus, Krefeld, Germany). As an exception, phospholipids in serum and liver tissue were measured with a Phospholipid kit from DiaSys (Holzheim, Germany). Inflammation markers were analyzed in plasma samples of mice fasted for 16 h by a Milliplex Assay with the MCYTOMAG-70k-PMX Mouse Cytokine/Chemokine Magnetic Bead Panel (Merck Millipore) for detection of TNFα, IL-1β and IL-6.
2.5. Histochemistry
Liver slices were snap-frozen, embedded in Tissue-Tek (O.C.T. Compound, Sakura, Staufen, Germany) on dry ice, and 5 μm cryosections were prepared for oil red O (ORO) and H&E staining. ORO staining was carried out with 5 min incubation as described [36]. For H&E sections were stained with Mayer's Hemalaun for 15 min, 5 min blued, dipped 5× in activated Eosin-G-solution, drained in an ascending ethanol series, and mounted with Roti(R)-Histokitt II. 3 sections per liver as technical replicates were analyzed in bright field with 20× magnification on a BZ-9000 microscope (Keyence, Neu-Isenburg, Germany), and images were quantified using ImageJ [37] according to nature protocols [36]. Representative images are depicted, scale (black bar) reflects 50 μm.
2.6. mRNA isolation and quantitative real-time PCR
Total RNA was extracted from snap-frozen tissue samples using TRIzol reagent according to the manufacturer's protocol. 1 μg RNA was digested DNase and transcribed into cDNA via RevertAid Reverse Transcriptase. Quantitative real-time PCR was performed on an ABI 7300 Real-Time PCR System with Maxima SYBR Green/ROX qPCR detection system. Expression data were normalized to GAPDH gene expression. Primer sequences: Gapdh (forward CGTCCCGTAGACAAAATGGT; reverse TGCCGTGAGTGGAGTCATAC) as well as Slc13a5 (mINDY: Mm_Slc13a5_va.1_SG), Slc13a2 (Mm_Slc13a2_1_SG), Slc13a3 (Mm_Slc13a3_1_SG), Slc2a2 (Mm_Slc2a2_1_SG) and Slc25a1 (Mm_Slc25a1_1_SG) as QuantiTect Primer Assay (Qiagen, Hilden, Germany).
2.7. Data and statistical analyses
All data are presented as mean ± SEM. GraphPad Prism 6 (La Jolla, USA) was used to calculate statistics and draw graphs. SCR is depicted as open bar/circle and siINDY as black bar/square. The homeostatic model assessment of IR (HOMA-IR) was calculated using [HOMA-IR = (glucose * insulin)/405] after 16 h fasting [38]. Statistical differences were calculated using one-tailed or two-tailed unpaired Student's t-test with Welch's correction or Mann–Whitney test depending on whether data passed normal distribution tests and two-way (repeated measurement) ANOVA adjusted for multiple testing and Bonferroni's multiple comparisons test for post hoc analysis where appropriate. p < 0.05 was considered significant.
3. Results
3.1. Structure, modification and evaluation of a liver-selective mINDY-specific siRNA
A commercially available siRNA (siINDY*) against murine Slc13a5 (mammalian INDY homolog, mINDY) inhibited the mINDY mRNA and reduced citrate uptake in HEK293 stably transfected with murine mINDY. In order to improve its pharmacokinetics, the siRNA was modified by introducing 2′-O-methylgroups and phosphorothioate. Several different derivatives were analyzed and the siRNA with the best profile was chosen for chronic administration. This modified siRNA (siINDY) showed improved serum stability and a strongly reduced immune stimulatory potential in relation to the unmodified siRNA (Table 2). siINDY also revealed a considerable ability to suppress mINDY expression to background (Figure 1A). The protein levels of mINDY in stably transfected HEK293-mINDY cells and citrate uptake were significantly reduced with 1 and 10 nM of siRNA (Figure 1B,C, respectively). To provide a liver-specific delivery, siRNAs were formulated with lipid nanoparticles targeting the oligonucleotides to hepatocytes.
Figure 1.

In vitro (A–C) and in vivo (D and E) validation of mINDY-specific siRNA (siINDY). (A) Dose–response curves upon transfection of HEK293 cells stably overexpressing mINDY carrying a FLAG-tag (HEK293-mINDY) with siINDY and its unmodified form (siINDY*) (n = 2). (B) Transfection of HEK293-mINDY with siINDY reduced mINDY protein in a concentration-dependent manner, determined by anti-FLAG In-Cell Western Assay (n = 3). The black arrow indicates background fluorescence signal of HEK293 wild-type cells analyzed in parallel. (C) Transfection of HEK293-mINDY cells with siINDY reduced cellular citrate uptake (n = 3). (D) Pilot mouse study to evaluate the siRNA efficacy. mINDY mRNA expression in liver 2 and 6 days after injection normalized to GAPDH and control siRNA at day 2 (n = 3). (E) mINDY mRNA expression in liver, kidney, and muscle tissue after 8 weeks of siRNA treatment normalized to GAPDH and control siRNA in liver (n = 4). Data are represented as mean ± SEM. Two-way ANOVA with Bonferroni's multiple comparisons test. Scrambled control siRNA (SCR): open bars; off-target-specific mINDY-unrelated siRNA (OT): fasciated bars; mINDY-specific unmodified siRNA (siINDY*): grey triangle; mINDY-specific modified siRNA (siINDY): black bars.
3.2. Knockdown of mINDY expression in vivo
In a first pilot test in mice, siINDY showed an effective down-regulation of mINDY mRNA in liver 6 days after injection, whereas a non-silencing scrambled control siRNA (SCR) and another off-target-specific, mINDY-unrelated siRNA revealed no mINDY knockdown at any time-point (Figure 1D). We next treated C57BL/6J mice with siINDY or SCR siRNA to elucidate the metabolic effects of liver-selective mINDY mRNA down-regulation in vivo. The highest expression of mINDY was detectable in liver and kidney, with very low levels of transcripts in skeletal muscle (SKM). After 8 weeks of siRNA treatment siINDY reduced the mINDY expression in liver by more than 60%, whereas mINDY expression in kidney and SKM were unaffected (Figure 1E). Notably, mRNA expression of other solute carrier family members as Slc13a2 (Na+-sulfate/carboxylate cotransporter) and Slc13a3 (sodium-dependent dicarboxylate transporter), both with conserved structural homologies to INDY, Slc2a2 (GLUT-2), and Slc25a1 (mitochondrial citrate transporter) showed no reduction in liver under INDY-specific siRNA treatment compared to SCR endorsing the mINDY specificity of the siRNA (Figure 2B).
Figure 2.

Liver-selective mINDY-specific siRNA approach. (A) Schematic of the mouse experiment. (B) mRNA expression of indicated genes in liver of clamped mice normalized to GAPDH (n = 7, two-tailed Student's t-test with Welch's correction). (C–E) Body composition measurement for fat mass (C), free fluids (D), and lean mass (E) at start (0 wk), after 5 weeks (5 wk) and before catheterization (7 wk) (n = 16). (F) Weight gain during intervention (n = 16). Data represent mean ± SEM. Black arrows: Recording of body weight/siRNA injection, Grey arrows: Procedures: BC: Body composition, MCA: Metabolic cage analysis, OP: Catheterization.
To investigate the effects of mINDY down-regulation on body composition and metabolic parameters, 8 week-old C57BL6/J mice were grouped according to fat mass (Figure 2C). Due to grouping by equal fat mass the body weight was slightly lower in the siINDY group compared to SCR with 24.6 g and 26.0 g, respectively (Supplemental Table A2). In both groups, siRNAs were injected weekly via tail vein in a body weight-matched fashion, and the siRNA intervention was combined with feeding a WD ad libitum. To assess dietary effects, body composition was measured by 1H-nuclear magnetic resonance, before the intervention, in week 5 and in week 7 before catheter implantation for the HE clamp. During intervention, fat content, free fluids, and lean mass showed similar progression (Figure 2C–E). No beneficial effect on whole-body fat accumulation was detected. Mice similarly increased their body weight over the study period (Figure 2F). This gain in body weight was predominantly a consequence of an increasing fat mass. For further characterization a metabolic cage study was performed in week 5. Here, both groups fed similar amounts of HFD during light and dark phase (Figure 3A, left). However, liquid intake in dark phase was reduced in mice treated with siINDY (Figure 3A, right). Hence, the total daily liquid consumption was also significantly reduced in the siINDY group (4.9 ± 0.4 and 3.8 ± 0.3 ml/kg/h for SCR and siINDY, respectively, p = 0.025). However, the total caloric intake combined from HFD and the 6% sucrose in the water was similar in both groups (Supplemental Table A2). The locomotor activity was low during daytime and increased rapidly with onset of the night phase, yet without any statistical differences (Figure 3B). Analysis of O2-consumption, CO2-production, and energy expenditure (EE) adjusted on lean mass also revealed no differences (Figure 3C and Supplemental Table A2). Likewise, no evidence was found for a change of the respiratory exchange ratio (RER) during light and dark phase within treatments (Figure 3D).
Figure 3.

Metabolic characterization of siRNA-treated mice during metabolic cage analysis (A–D, n = 10) and ipGTT (E–F). (A) Food intake (left) and liquid consumption (with 6% sucrose, right) during light- and dark-phase (repeated measurement ANOVA with Bonferroni's multiple comparisons test). (B) Locomotor activity. (C) Energy expenditure. (D) Respiratory exchange ratio (VCO2/VO2). (E) Plasma glucose during ipGTT (n = 16). (H) According insulin levels during ipGTT (n = 15). Data represent mean ± SEM. Grey background indicates dark-phase.
In summary, liver-selective mINDY knockdown did not prevent WD-induced changes of body composition or body weight within the 8 week intervention.
3.3. Metabolic characterization of mINDY knockdown
Changes in metabolic parameters were reported for the whole-body mINDY KO [16]. Basal metabolic parameters were analyzed in plasma of fasted mice. We found no differences of non-esterified free fatty acids (NEFA), blood glucose, and insulin levels between treatment groups (Supplemental Table A2).
To assess the effect of mINDY knockdown on glucose homeostasis in week 5, an ipGTT was conducted in mice fasted for 16 h. Both groups showed similar blood glucose levels during the ipGTT (Figure 3E). No effect of mINDY knockdown on glucose tolerance was observed, neither evaluating the ipGTT by analysis of AUC (data not shown). The corresponding insulin levels revealed no significant differences during the ipGTT (Figure 3F).
Thus, the mINDY-specific siRNA treatment revealed no major changes of basal metabolic parameters.
3.4. mINDY knockdown increased insulin-induced suppression of endogenous glucose production
The whole-body mINDY KO revealed a protective effect from HFD-induced IR [16]. Therefore, the effect of mINDY knockdown on the peripheral and hepatic insulin sensitivity was investigated by HE clamps in restrained, conscious mice with radioactive tracers at 8 weeks of intervention. At the HE clamp day, fasted siINDY-treated mice were slightly lighter than the SCR group but showed similar basal fasting glucose levels and a comparable HOMA-IR (Supplemental Table A3). Mice were clamped at 120 mg/dl blood glucose and held constant in the steady state phase of the HE clamp (Figure 4A and Supplemental Table A3). Although the glucose infusion rate (GIR) for siINDY was elevated during the steady state, that difference was not significant (Figure 4A). Due to the insulin stimulation under hyperinsulinemic conditions plasma NEFA were reduced in both groups (Figure 4B). siINDY mice exhibited a 50% reduction and SCR mice exhibited a 29% reduction, again without a statistical difference. This might indicate a moderately improved insulin sensitivity induced by suppression of lipolysis within siINDY mice. To evaluate the impact of mINDY knockdown on hepatic insulin sensitivity, the endogenous glucose production (EGP) was determined. Under basal conditions the EGP of fasted mice was comparable (Figure 4C, left, 19.0 ± 5.0 vs. 16.7 ± 1.4 mg/kg/min for SCR and siINDY, respectively). However, during the HE clamp the siINDY group showed virtually no EGP, while the insulin suppression within the SCR group was about 50% of the basal EGP (Figure 4C, right, 8.29 ± 2.47 vs. 0.36 ± 1.84 mg/kg/min for SCR and siINDY, respectively) Thus, the EGP was almost completely inhibited in the steady state in siINDY-treated mice reflecting a preserved insulin sensitivity of EGP (Figure 4D, 52.3 vs. 96.1% for SCR and siINDY, respectively). The peripheral insulin action was evaluated by the whole-body glucose uptake and the tissue-specific 2-Deoxy-d-glucose (2-DG) uptake. The whole-body glucose uptake during insulin-stimulation showed no difference between treatment groups (Figure 4E). Rates of glucose clearance at basal level and under clamp conditions, glycolysis, glycogen synthesis and corticosterone levels in the steady state revealed no differences (Supplemental Table A3). Insulin-stimulated 2-DG uptake in peripheral organs revealed no impact of mINDY knockdown in SKM (Gastrocnemius) and epididymal white adipose tissue (WAT) (Figure 4F).
Figure 4.

Improvement of insulin sensitivity with mINDY-specific siRNA during HE clamp. (A) Blood glucose (top) at basal and insulin-stimulated phase and according glucose infusion rate (GIR, bottom) to maintain plasma glucose at 120 mg/dl. (B) Insulin-mediated reduction of plasma NEFA. (C) Endogenous glucose production (EGP). (D). Suppression of EGP. (E) Whole-body glucose uptake during steady state. (F) 2-DG uptake of SKM (Gastrocnemius) and epididymal WAT. Data represent mean ± SEM. n = 7. Two-tailed Student's t-test with Welch's correction.
In summary, siINDY-treated mice showed an improved hepatic insulin sensitivity with an improved insulin-suppression of EGP, while the whole-body insulin sensitivity was not substantially changed.
3.5. mINDY knockdown lowered liver lipids
Recently, Li and colleagues observed that mINDY knockdown was sufficient to repress lipid formation in HepG2 cells [24]. To address whether the siINDY treatment also affected hepatic lipid storage, overnight fasted, non-catheterized mice were sacrificed and organ weights were determined. Livers of the siINDY group showed a 10% reduced weight (Figure 5A, 1133 ± 34 vs. 1035 ± 33 mg SCR and siINDY, respectively, p = 0.04). Other analyzed organs and fat depots (epididymal (e), perirenal (p), subcutaneous (s) WAT) displayed similar weights between groups. To monitor liver morphology, H&E stainings were performed. Liver tissues of both groups showed no obvious pathological morbidities (Figure 5B) although more lipids droplets were visible in liver tissue of the SCR group. To evaluate the lipid content in liver, oil red O (ORO) stainings were conducted. Less and smaller lipids droplets were found in liver sections of siINDY mice (Figure 5C). Densitometric quantification of neutral lipids stained by ORO demonstrated a reduced lipid content in liver sections of siINDY-treated mice (Figure 5D). Metabolic parameters (triglycerides, cholesterol, HDL, LDL, and phospholipids) and different inflammation markers were analyzed in plasma without revealing any difference (Supplemental Table A4). In liver lysates cholesterol content and phospholipids were also unchanged (Supplemental Table A4), while siINDY mice showed reduced triglyceride levels in liver homogenates (Figure 5E).
Figure 5.

mINDY-specific siRNA decreased hepatic lipid content. (A) Weight of indicated organs and epididymal (e), perirenal (p), and subcutaneous (s) WAT after 16 h fasting. (B) Representative H&E staining of liver. (C) Representative ORO staining. (D) Quantification of ORO stainings by densitometric analysis. (E) Triglyceride content in liver lysates. Data represent mean ± SEM. n = 4. One-tailed Student's t-test with Welch's correction. Black scales indicate 50 μm.
Taken together, we demonstrate that the pharmacological knockdown of mINDY by RNAi in vivo improved hepatic insulin sensitivity and effectively prevented lipid accumulation, especially triglycerides in liver. Hence, mINDY inhibition is able to counteract diet-induced fatty liver disease (FLD).
4. Discussion
Our data show that inhibition of mINDY exclusively in the liver is able to reduce hepatic lipid accumulation and improve hepatic insulin sensitivity. We revealed that our modified liver-selective a mINDY-specific siRNA could prevented a diet-induced steatosis in mice. Moreover, we observed an improved insulin sensitivity by mINDY knockdown. FLD is a world-wide healthy concern. Our data provide novel mechanistic insights into the understanding of mINDY action but also describe that mINDY inhibition is a feasible potential therapeutic option to prevent FLD.
Our findings partially support previous results but also add considerable novel aspects to our understanding of mINDY function. Along these lines, mINDY KO mice were protected from HFD-induced obesity, IR and FLD [16]. However, the contribution of single organs and tissues is difficult to discern in constitutive whole-body KO animals. Our data reveal that the effect of mINDY on liver fat and insulin sensitivity can be dissociated from an effect on adiposity. Specifically, our siRNA-based experiments show improved hepatic insulin sensitivity and prevention of FLD, although body weight is unchanged in the treated animals. Thus, a liver-specific phenotype does not require changes of whole-body fat or body weight. Recent data from another study using RNAi in rats to inhibit mINDY showed similar results [39]. However, that study did not demonstrate specificity or liver-selectivity of the investigated siRNA. Therefore, it remained unclear, which effects can be observed by liver-specific knockdown. Additionally, the authors did not provide further data on the inhibition. We evaluated our modified siRNA in vitro (Figure 1A–C) and tested the efficacy, specificity, and liver-selectivity by screening mINDY expression in liver, kidney, and muscle as well as the hepatic expression of other family members (Figure 1, Figure 2B).
Considering the results of the KO and the fact that mINDY is predominantly expressed in liver, we found the lack of any difference in body weight somewhat surprising and speculated that eventually our experiment was too short to induce changes of body weight. We suggest that conditional KO experiments should investigate the role of e.g. neuron-specific mINDY expression in the brain on energy homeostasis. It should also be noted that the knockdown resulted in approximately 35% remaining mINDY activity and that we here investigated an acute inhibition of mINDY while the genetic KO has a complete deletion of mINDY activity over the whole period of life, including prenatal development, which may also explain differences between the genetic KO model and the here observed findings.
For the siRNA-treated mice we assessed the insulin sensitivity using the HE clamp. Comparable to the KO experiments, we observed improved hepatic insulin sensitivity with a strongly reduced EGP even though the knockdown efficiency was not 100% such as with the mINDY KO. We showed that none of the other presumably relevant transporters compensated for mINDY knockdown or was targeted by the liver-selective mINDY-specific siRNA (Figure 1B). The siRNA appeared to affect also whole-body insulin sensitivity, although these effects were not significant. Mice exhibited a higher GIR during the HE clamp and a more substantial reduction of NEFA in reaction to hyperinsulinemia during the HE clamp. Specific 2-DG uptake into peripheral tissues (SKM and WAT) was not affected by mINDY inhibition during the HE clamp (Figure 4F). Notably, the KO showed a significantly increased glucose uptake into SKM during a HE clamp [16]. Theoretically, our study may have been underpowered to detect small differences in peripheral insulin sensitivity. However, it should be noted that the siRNA did not target SKM, which most likely explains the lacking effect on glucose uptake into SKM (Figure 1E). Our experimental setting did not include overt diabetic models. Although effects on glucose metabolism in our study were moderate, those overt diabetic models should be investigated in future experiments to evaluate the potential of mINDY inhibition in terms of diabetes treatment.
In general, our finding of reduced liver fat accumulation under mINDY inhibition is in line with previous results demonstrating that mINDY is relevant for triglyceride metabolism. Decreased activity of mINDY (or its orthologs) in D. melanogaster and C. elegans increased longevity similarly to caloric restriction and was associated with reduced lipid accumulation in those organisms [11], [20], [21], [22], [40], [41]. mINDY deletion in mice decreased HFD-induced adiposity, lipid accumulation into liver and SKM, and improved insulin sensitivity without affecting caloric intake [16]. In addition to those data, we now show that mINDY inhibition has a considerable therapeutic potential and that effects on local lipid accumulation are unlikely to depend on changes in the degree of adiposity.
Some limitations of our study should be mentioned. Our approach has a considerable risk of off-target effects. Although we aimed to establish a rather specific approach, some of those effects are likely to exist. Array data from control and siINDY-treated mice did not show any altered regulation or off-target effects (data not shown). Thus, the findings described here are likely to result from mINDY inhibition rather than non-specific effects.
Although we demonstrated that our siRNA inhibited mINDY predominantly in the liver and did not affect expression in adipose tissue, skeletal muscle, or kidney, we cannot entirely exclude that other organs may have been affected such as central nervous system. Considering our modifications, the siRNA should not have crossed the blood–brain-barrier. However, this has not been analyzed directly and future experiments on the role of mINDY in the brain are desirable. HFD in C57BL/6 mice usually does not induce substantial hepatitis within the given time period [42]. Nevertheless mINDY and HFD may modify infiltration of specific immune cells. Due to the radioactive state of the material after clamp, a detailed immune cell phenotyping of the liver was not performed within our study and would be desirable in future studies.
Our findings suggest that mINDY inhibition is a reasonable therapeutic option to prevent FLD. However, our data are restricted to rodents, and it is unclear whether comparable effects can be observed in humans. Despite this uncertainty, notably comparable findings on lipid accumulation were observed in C. elegans and D. melanogaster [21], [22]. Therefore, the relevance of mINDY appears to be a conserved mechanism, and we believe that further experiments including early human studies are warranted to further investigate the potential of this therapeutic approach.
In conclusion, our data demonstrate that mINDY is involved in regulation of liver fat metabolism. Its inhibition by a liver-specific siRNA is a reasonable approach to prevent FLD in C57BL/6J mice on WD; however, it had no effect on body weight. Our data support that effects on hepatic lipid accumulation occur independent of body weight changes or whole-body fat content. We suggest that non-liver mINDY effects, such as brain activity, may mediate potential effects on body weight. Future experiments addressing the relevance of central-nervous mINDY activity and investigating the therapeutic effects on glucose metabolism in overt diabetic models are desirable.
Funding
This work was supported by a collaboration between Charité and Sanofi and SB, HT, and JS were supported by the DZHK (BMBF). The funders had no role in study design, data collection and analysis, decision to publish, or preparation of the manuscript.
Author contributions
SB, DS, ALB, and JS designed the studies. SB and JS wrote the manuscript. BB and KJH conducted siRNA synthesis and modification. SB, AFW, and HT performed experiments. SB, AFW, DM, DS, and JS analyzed data. SB, AFW, HR, DS, and JS discussed the results. SB, AFW, DS, and JS edited the manuscript.
Acknowledgments
We thank Diana Woellner (Charité Berlin, Germany) and Vanessa Valdix, (Charité Berlin, Germany) for excellent technical support.
Footnotes
Supplementary data related to this article can be found at http://dx.doi.org/10.1016/j.molmet.2016.08.004.
Contributor Information
Sebastian Brachs, Email: Sebastian.Brachs@charite.de.
Angelika F. Winkel, Email: Angelika.Winkel@sanofi.com.
Hui Tang, Email: Hui.Tang@charite.de.
Andreas L. Birkenfeld, Email: Andreas.Birkenfeld@uniklinikum-dresden.de.
Bodo Brunner, Email: Bodo.Brunner@sanofi.com.
Kerstin Jahn-Hofmann, Email: Kerstin.Jahn-Hofmann@sanofi.com.
Daniel Margerie, Email: Daniel.Margerie@sanofi.com.
Hartmut Ruetten, Email: Hartmut.Ruetten@sanofi.com.
Dieter Schmoll, Email: Dieter.Schmoll@sanofi.com.
Joachim Spranger, Email: joachim.spranger@charite.de.
Conflict of interest
AFW, BB, KJH, DM, HR, and DS are employees of Sanofi. ALB owns shares of Eternygen GmbH. All other authors disclose any duality of interest associated with their contribution to this manuscript.
Appendix A. Supplementary data
The following are the supplementary data related to this article:
References
- 1.Browning J.D., Szczepaniak L.S., Dobbins R., Nuremberg P., Horton J.D., Cohen J.C. Prevalence of hepatic steatosis in an urban population in the United States: impact of ethnicity. Hepatology. 2004;40(6):1387–1395. doi: 10.1002/hep.20466. [DOI] [PubMed] [Google Scholar]
- 2.Haslam D.W., James W.P. Obesity. Lancet. 2005;366(9492):1197–1209. doi: 10.1016/S0140-6736(05)67483-1. [DOI] [PubMed] [Google Scholar]
- 3.Aguilar-Valles A., Inoue W., Rummel C., Luheshi G.N. Obesity, adipokines and neuroinflammation. Neuropharmacology. 2015;96(Pt A):124–134. doi: 10.1016/j.neuropharm.2014.12.023. [DOI] [PubMed] [Google Scholar]
- 4.Vandevijvere S., Chow C.C., Hall K.D., Umali E., Swinburn B.A. Increased food energy supply as a major driver of the obesity epidemic: a global analysis. Bulletin of the World Health Organization. 2015;93(7):446–456. doi: 10.2471/BLT.14.150565. [DOI] [PMC free article] [PubMed] [Google Scholar]
- 5.Farrell G.C., Larter C.Z. Nonalcoholic fatty liver disease: from steatosis to cirrhosis. Hepatology. 2006;43(2 Suppl 1):S99–S112. doi: 10.1002/hep.20973. [DOI] [PubMed] [Google Scholar]
- 6.Woods C.P., Hazlehurst J.M., Tomlinson J.W. Glucocorticoids and non-alcoholic fatty liver disease. The Journal of Steroid Biochemistry and Molecular Biology. 2015 doi: 10.1016/j.jsbmb.2015.07.020. [DOI] [PubMed] [Google Scholar]
- 7.Postic C., Girard J. Contribution of de novo fatty acid synthesis to hepatic steatosis and insulin resistance: lessons from genetically engineered mice. The Journal of Clinical Investigation. 2008;118(3):829–838. doi: 10.1172/JCI34275. [DOI] [PMC free article] [PubMed] [Google Scholar]
- 8.Samuel V.T., Petersen K.F., Shulman G.I. Lipid-induced insulin resistance: unravelling the mechanism. Lancet. 2010;375(9733):2267–2277. doi: 10.1016/S0140-6736(10)60408-4. [DOI] [PMC free article] [PubMed] [Google Scholar]
- 9.Mabrouk G.M., Helmy I.M., Thampy K.G., Wakil S.J. Acute hormonal control of acetyl-CoA carboxylase. The roles of insulin, glucagon, and epinephrine. The Journal of Biological Chemistry. 1990;265(11):6330–6338. [PubMed] [Google Scholar]
- 10.Mancusso R., Gregorio G.G., Liu Q., Wang D.N. Structure and mechanism of a bacterial sodium-dependent dicarboxylate transporter. Nature. 2012;491(7425):622–626. doi: 10.1038/nature11542. [DOI] [PMC free article] [PubMed] [Google Scholar]
- 11.Rogina B., Reenan R.A., Nilsen S.P., Helfand S.L. Extended life-span conferred by cotransporter gene mutations in Drosophila. Science. 2000;290(5499):2137–2140. doi: 10.1126/science.290.5499.2137. [DOI] [PubMed] [Google Scholar]
- 12.Pajor A.M. Molecular cloning and functional expression of a sodium-dicarboxylate cotransporter from human kidney. The American Journal of Physiology. 1996;270(4 Pt 2):F642–F648. doi: 10.1152/ajprenal.1996.270.4.F642. [DOI] [PubMed] [Google Scholar]
- 13.Inoue K., Zhuang L., Maddox D.M., Smith S.B., Ganapathy V. Structure, function, and expression pattern of a novel sodium-coupled citrate transporter (NaCT) cloned from mammalian brain. The Journal of Biological Chemistry. 2002;277(42):39469–39476. doi: 10.1074/jbc.M207072200. [DOI] [PubMed] [Google Scholar]
- 14.Inoue K., Fei Y.J., Zhuang L., Gopal E., Miyauchi S., Ganapathy V. Functional features and genomic organization of mouse NaCT, a sodium-coupled transporter for tricarboxylic acid cycle intermediates. The Biochemical Journal. 2004;378(Pt 3):949–957. doi: 10.1042/BJ20031261. [DOI] [PMC free article] [PubMed] [Google Scholar]
- 15.Gopal E., Miyauchi S., Martin P.M., Ananth S., Srinivas S.R., Smith S.B. Expression and functional features of NaCT, a sodium-coupled citrate transporter, in human and rat livers and cell lines. American Journal of Physiology Gastrointestinal and Liver Physiology. 2007;292(1):G402–G408. doi: 10.1152/ajpgi.00371.2006. [DOI] [PubMed] [Google Scholar]
- 16.Birkenfeld A.L., Lee H.Y., Guebre-Egziabher F., Alves T.C., Jurczak M.J., Jornayvaz F.R. Deletion of the mammalian INDY homolog mimics aspects of dietary restriction and protects against adiposity and insulin resistance in mice. Cell Metabolism. 2011;14(2):184–195. doi: 10.1016/j.cmet.2011.06.009. [DOI] [PMC free article] [PubMed] [Google Scholar]
- 17.Inoue K., Zhuang L., Ganapathy V. Human Na+ -coupled citrate transporter: primary structure, genomic organization, and transport function. Biochemical and Biophysical Research Communications. 2002;299(3):465–471. doi: 10.1016/s0006-291x(02)02669-4. [DOI] [PubMed] [Google Scholar]
- 18.Hirayama B., Wright E.M. Coupling between sodium and succinate transport across renal brush border membrane vesicles. Pfluegers Archiv European Journal of Physiology. 1986;407(Suppl 2):S174–S179. doi: 10.1007/BF00584948. [DOI] [PubMed] [Google Scholar]
- 19.Pajor A.M. Molecular properties of the SLC13 family of dicarboxylate and sulfate transporters. Pfluegers Archiv European Journal of Physiology. 2006;451(5):597–605. doi: 10.1007/s00424-005-1487-2. [DOI] [PMC free article] [PubMed] [Google Scholar]
- 20.Fei Y.J., Inoue K., Ganapathy V. Structural and functional characteristics of two sodium-coupled dicarboxylate transporters (ceNaDC1 and ceNaDC2) from Caenorhabditis elegans and their relevance to life span. The Journal of Biological Chemistry. 2003;278(8):6136–6144. doi: 10.1074/jbc.M208763200. [DOI] [PubMed] [Google Scholar]
- 21.Wang P.Y., Neretti N., Whitaker R., Hosier S., Chang C., Lu D. Long-lived Indy and calorie restriction interact to extend life span. Proceedings of the National Academy of Sciences of the United States of America. 2009;106(23):9262–9267. doi: 10.1073/pnas.0904115106. [DOI] [PMC free article] [PubMed] [Google Scholar]
- 22.Schwarz F., Karadeniz Z., Fischer-Rosinsky A., Willmes D.M., Spranger J., Birkenfeld A.L. Knockdown of Indy/CeNac2 extends Caenorhabditis elegans life span by inducing AMPK/aak-2. Aging. 2015 doi: 10.18632/aging.100791. [DOI] [PMC free article] [PubMed] [Google Scholar]
- 23.Neuschafer-Rube F., Lieske S., Kuna M., Henkel J., Perry R.J., Erion D.M. The mammalian INDY homolog is induced by CREB in a rat model of type 2 diabetes. Diabetes. 2014;63(3):1048–1057. doi: 10.2337/db13-0749. [DOI] [PMC free article] [PubMed] [Google Scholar]
- 24.Li L., Li H., Garzel B., Yang H., Sueyoshi T., Li Q. SLC13A5 is a novel transcriptional target of the pregnane X receptor and sensitizes drug-induced steatosis in human liver. Molecular Pharmacology. 2015;87(4):674–682. doi: 10.1124/mol.114.097287. [DOI] [PMC free article] [PubMed] [Google Scholar]
- 25.Kilkenny C., Browne W.J., Cuthill I.C., Emerson M., Altman D.G. Improving bioscience research reporting: the ARRIVE guidelines for reporting animal research. PLoS Biology. 2010;8(6):e1000412. doi: 10.1371/journal.pbio.1000412. [DOI] [PMC free article] [PubMed] [Google Scholar]
- 26.Tschop M.H., Speakman J.R., Arch J.R., Auwerx J., Bruning J.C., Chan L. A guide to analysis of mouse energy metabolism. Nature Methods. 2012;9(1):57–63. doi: 10.1038/nmeth.1806. [DOI] [PMC free article] [PubMed] [Google Scholar]
- 27.Ayala J.E., Samuel V.T., Morton G.J., Obici S., Croniger C.M., Shulman G.I. Standard operating procedures for describing and performing metabolic tests of glucose homeostasis in mice. Disease Models & Mechanisms. 2010;3(9–10):525–534. doi: 10.1242/dmm.006239. [DOI] [PMC free article] [PubMed] [Google Scholar]
- 28.Lee H.Y., Jeong K.H., Choi C.S., International Mouse Phenotyping C In-depth metabolic phenotyping of genetically engineered mouse models in obesity and diabetes. Mammalian Genome: Official Journal of the International Mammalian Genome Society. 2014;25(9–10):508–521. doi: 10.1007/s00335-014-9520-4. [DOI] [PubMed] [Google Scholar]
- 29.Ayala J.E., Bracy D.P., McGuinness O.P., Wasserman D.H. Considerations in the design of hyperinsulinemic-euglycemic clamps in the conscious mouse. Diabetes. 2006;55(2):390–397. doi: 10.2337/diabetes.55.02.06.db05-0686. [DOI] [PubMed] [Google Scholar]
- 30.Camporez J.P., Jornayvaz F.R., Lee H.Y., Kanda S., Guigni B.A., Kahn M. Cellular mechanism by which estradiol protects female ovariectomized mice from high-fat diet-induced hepatic and muscle insulin resistance. Endocrinology. 2013;154(3):1021–1028. doi: 10.1210/en.2012-1989. [DOI] [PMC free article] [PubMed] [Google Scholar]
- 31.Muller S., Wolf J., Ivanov S.A. Current strategies for the synthesis of RNA. Current Organic Synthesis. 2004;1(3):293–307. [Google Scholar]
- 32.Beaucage S.L. Solid-phase synthesis of siRNA oligonucleotides. Current Opinion in Drug Discovery & Development. 2008;11(2):203–216. [PubMed] [Google Scholar]
- 33.Richter M., Winkel A.F., Schummer D., Gerlitz M., de Hoop M., Brunner B. Pau d'arco activates Nrf2-dependent gene expression via the MEK/ERK-pathway. The Journal of Toxicological Sciences. 2014;39(2):353–361. doi: 10.2131/jts.39.353. [DOI] [PubMed] [Google Scholar]
- 34.Herling A.W., Burger H., Schubert G., Hemmerle H., Schaefer H., Kramer W. Alterations of carbohydrate and lipid intermediary metabolism during inhibition of glucose-6-phosphatase in rats. European Journal of Pharmacology. 1999;386(1):75–82. doi: 10.1016/s0014-2999(99)00748-7. [DOI] [PubMed] [Google Scholar]
- 35.Glien M., Haschke G., Schroeter K., Pfenninger A., Zoller G., Keil S. Stimulation of fat oxidation, but no sustained reduction of hepatic lipids by prolonged pharmacological inhibition of acetyl CoA carboxylase. Hormone and Metabolic Research = Hormon- und Stoffwechselforschung = Hormones et metabolisme. 2011;43(9):601–606. doi: 10.1055/s-0031-1283138. [DOI] [PubMed] [Google Scholar]
- 36.Mehlem A., Hagberg C.E., Muhl L., Eriksson U., Falkevall A. Imaging of neutral lipids by oil red O for analyzing the metabolic status in health and disease. Nature Protocols. 2013;8(6):1149–1154. doi: 10.1038/nprot.2013.055. [DOI] [PubMed] [Google Scholar]
- 37.Schneider C.A., Rasband W.S., Eliceiri K.W. NIH Image to ImageJ: 25 years of image analysis. Nature Methods. 2012;9(7):671–675. doi: 10.1038/nmeth.2089. [DOI] [PMC free article] [PubMed] [Google Scholar]
- 38.Berglund E.D., Li C.Y., Poffenberger G., Ayala J.E., Fueger P.T., Willis S.E. Glucose metabolism in vivo in four commonly used inbred mouse strains. Diabetes. 2008;57(7):1790–1799. doi: 10.2337/db07-1615. [DOI] [PMC free article] [PubMed] [Google Scholar]
- 39.Pesta D.H., Perry R.J., Guebre-Egziabher F., Zhang D., Jurczak M., Fischer-Rosinsky A. Prevention of diet-induced hepatic steatosis and hepatic insulin resistance by second generation antisense oligonucleotides targeted to the longevity gene mIndy (Slc13a5) Aging. 2015;7(12):1086–1093. doi: 10.18632/aging.100854. [DOI] [PMC free article] [PubMed] [Google Scholar]
- 40.Fontana L., Klein S. Aging, adiposity, and calorie restriction. JAMA. 2007;297(9):986–994. doi: 10.1001/jama.297.9.986. [DOI] [PubMed] [Google Scholar]
- 41.Colman R.J., Anderson R.M., Johnson S.C., Kastman E.K., Kosmatka K.J., Beasley T.M. Caloric restriction delays disease onset and mortality in rhesus monkeys. Science. 2009;325(5937):201–204. doi: 10.1126/science.1173635. [DOI] [PMC free article] [PubMed] [Google Scholar]
- 42.Wolf M.J., Adili A., Piotrowitz K., Abdullah Z., Boege Y., Stemmer K. Metabolic activation of intrahepatic CD8+ T cells and NKT cells causes nonalcoholic steatohepatitis and liver cancer via cross-talk with hepatocytes. Cancer Cell. 2014;26(4):549–564. doi: 10.1016/j.ccell.2014.09.003. [DOI] [PubMed] [Google Scholar]
Associated Data
This section collects any data citations, data availability statements, or supplementary materials included in this article.