

Abstract
We study the optical response of monodisperse colloids of core-shell plasmonic nanoparticles and introduce a computational approach to optimize absorption for photothermal applications that require dilute colloids of non-interacting particles with a prescribed volume fraction. Since the volume fraction is held constant, the particle concentration is size-dependent. Optimization is achieved by comparing the absorption spectra of colloids as a function of particle size and structure. We demonstrate the approach via application to colloids of core-shell SiO2@Au and Fe3O4@Au nanoparticles with particle sizes that range from 5–100 nm and with the incident wavelength varying from 600–1200 nm. The absorption spectra are predicted using Mie theory and the analysis shows that there is a unique mix of parameters (core radius, shell thickness, wavelength) that maximize absorption, independent of the value of volume fraction. We show that lossy Fe3O4 cores produce a much broader absorption peak with much less sensitivity to variations in particle structure and wavelength than lossless SiO2 cores. This approach can be readily adapted to colloids of nanoparticles with arbitrary materials, shapes and structure using appropriate numerical methods to compute the absorption spectra. As such, it is useful for the rational design of colloids and process variables for a broad range of photothermal applications.
The interest in colloidal plasmonic nanoparticles (NPs) has grown rapidly in recent years due in part to advances in particle synthesis and the emergence of applications that leverage the unique optical properties of the particles, especially localized surface plasmon resonance (LSPR)1,2,3,4,5,6,7,8. At LSPR there is a uniform and coherent oscillation of free electrons within the particles that gives rise to highly localized field enhancement and intense absorption of incident light. Moreover, the LSPR wavelength can be tuned from the ultraviolet (UV) through the near-infrared (NIR) spectrum by controlling the size, shape and structure the particle during synthesis9. The ability to tune LSPR in this fashion has proven useful for a variety of applications in fields that include biosensing, optical coherence tomography10, photoacoustic imaging11 and two-photon luminescence imaging12, among others. The main focus of the paper is on photothermal applications of plasmonic colloids wherein the absorbed optical energy at LSPR is used to heat the surrounding medium. Among the many applications of laser-induced photothermal heating, minimally-invasive cancer therapies have drawn particular interest due to their potential benefit and impact on human health. In such therapies, plasmonic (usually gold) nanoparticles are functionalized to enhance their biocompatibility and to enable targeting of malignant tissue. The particles are introduced into the vasculature where they circulate and preferentially bind to targeted tissue. They are then laser heated to a sufficiently high temperature to destroy the tissue. Various plasmonic nanoparticle structures have been studied for photothermal therapies including nanoshells13, nanorods14,15, nanotori15,16, and more recently nanocages17. Such particles can be designed from fist principles (shape and structure) to achieve LSPR at preferred NIR wavelengths that more effectively penetrate soft tissues for in vivo applications, as compared to other wavelengths18. The particle design can be accomplished using various theoretical methods and numerous groups have validated such predictions experimentally. However, few groups have considered the optimization of plasmonic colloids for photothermal applications subject to constraints on the particle concentration, which is the focus of this work.
In this paper, we introduce a computational approach to optimize the optical absorption of dilute monodisperse colloids of core-shell plasmonic NPs under the constraint of a prescribed volume fraction. Since the volume fraction is held constant, the particle concentration is size-dependent, i.e., colloids with larger particles have lower particle concentrations. We demonstrate the approach for monodisperse colloids of core-shell SiO2@Au and Fe3O4@Au nanoparticles with particle sizes and wavelengths that range from 5–100 nm and 600–1200 nm, respectively (allowing for the shell thickness to range from 0 to 100% of the particle radius). These colloids are chosen to illustrate important differences in optical absorption for particles with lossless (SiO2) vs. lossy (Fe3O4) dielectric core constituents. The optical absorption is predicted using Mie theory and the analysis shows that there is a unique mix of parameters (core radius, shell thickness, wavelength) for each of the two colloidal systems respectively, that maximize absorption, independent of the value of the volume fraction. Furthermore, we show that a carefully chosen lossy core produces a much broader absorption peak with much less sensitivity to variations in particle structure and wavelength as compared to a lossless core. This is important because it provides insight into the advantageous use of lossy dielectric particle constituents to tune colloidal absorption to compensate for variations in particle size etc. that can occur during synthesis. In should also be noted that this is one of very few studies that quantifies the optical absorption of Fe3O4@Au nanoparticles19. Finally, this approach is readily implemented and can be adapted to colloids of plasmonic nanoparticles with arbitrary shapes, structures and constituents using well-established numerical methods to compute optical absorption and scattering20,21. In fact, there are several commercial programs such as the Comsol Multiphysics software (www.comsol.com) that are widely used for such analysis. Specifically, the Comsol RF module is a finite-element based solver that can be used to predict the transient or time-harmonic optical response of nanoparticles with arbitrary shapes and constituents with user-defined lossy and dispersive dielectric functions15,16,22. As such, this approach presented here is useful for the rational design of dilute colloids and process variables for a broad range of photothermal applications.
Results
We demonstrate the theory via application to dilute monodisperse colloids of SiO2@Au and Fe3O4@Au NPs subject to the constraint of a prescribed volume fraction. In this analysis, the particle separation is assumed to be sufficiently large (dilute) such that the photonic coupling between particles is negligible, i.e., the optical response of the colloid is essentially the same as the sum of the individual particles. The normalized absorption cross-section of the colloids, which is denoted by  , depends on the absorption efficiency kabs as defined in Eqs (1, 2, 3), which is a function of the particle size, shell thickness and wavelength. It is important to note that since ϕ is held constant as we compare the absorption of colloids with different sized particles, the particle concentration is size-dependent, i.e.
  . Thus the normalized absorption cross-section has a functional dependency of the form
  as in Eq. (14). We compare colloids of different sized particles in the range Dp ∈ [5, 100] nm (5 nm≤ Dp≤ 100 nm) with shells that can ranges from 0 to 100% gold, i.e. tAu ∈ [0, Dp/2] nm, or equivalently ξAu ∈ [0, 100]. Note that if tAu = Dp/2 (ξAu = 100), the particle is a solid gold sphere. We allow for wavelengths in the range λ ∈ [600, 1200] nm. Mie theory was used to generate a 3D array of normalized absorption cross-sections
  . Form this data we determine the mix of parameters (Dp, tAu, λ) that produce the optimum normalized absorption cross-section, denoted
  .
.
Three distinct studies are performed to demonstrate the optimization process. In the first study, Dp and λ are varied over their respective ranges in 0.5 nm and 2 nm increments, respectively. For each pair (Dp, λ) we determine the value of ξAu ∈ [0, 100] (i.e. the shell thickness) that produces the maximum absorption. We found that  is a very sensitive function of ξAu, and had to use very fine increments of this variable (ξAu = 0.001) to obtain smooth absorption data. This analysis results in a 2D array of optimized normalized cross-sections, which we denote by
  . This data is presented as a surface plot over the Dp − λ plane. In the second study, we allow λ to vary freely over its range of values, and for each value, we determine the pair (Dp, ξAu) that maximize the absorption by searching Dp ∈ [5, 100] nm and ξAu ∈ [0, 100]. Thus, we obtain a 1D array, which is denoted by
  . Finally, in the third study, we allow Dp to vary over its range of values, and for each of these we determine the pair (ξAu, λ) that maximize the absorption by searching the ranges ξAu ∈ [0, 100] and λ ∈ [600, 1200] nm. This produces a 1D array of optimized normalized cross-sections, which is denoted by
  . Two plots are generated from this data. The fist plot shows
  vs. Dp. In the second plot, the optimum values of ξAu and λ, which are plotted as a function of Dp on the same graph. All of this data is presented for the two colloids separately in the following sections.
SiO2@Au NP Colloids
The SiO2@Au nanoparticles have a lossless SiO2 core, i.e.  is real-valued as shown in Eq. (10). Therefore, all of the absorption is within the gold shell. The normalized absorption analysis for these colloids is shown in Figs 1 and 2, and the unnormalized peak absorption for these plots is 5.0962 × 10⁸m−1. Specifically, Fig. 1a,b show surface and projection plots of the optimized normalized absorption cross-section
  , respectively. These plots show that the maximum absorption occurs for a particle diameter Dp = 8 nm with a shell thickness ratio ξAu = 14.43 (%) at a wavelength of λ = 734 nm (indicated by the arrow). These parameters define a global maximum over the entire range of independent variables (Dp, tAu, λ). Moreover, since the volume fraction in this analysis was assumed to be constant, but otherwise arbitrary, these results are independent of a prescribed value of volume fraction and rather, apply to all monodisperse dilute colloids of SiO2@Au particles. It should be noted that in general, the optimum parameters depend on the allowed range of the independent variables. For example, if the incident wavelength were restricted to 800–1000 nm, the optimum particle size and shell thickness would be different. Figure 2 further illustrates the optimization. Figure 2a is a plot of the optimum normalized absorption as a function of wavelength,
  . The maximum absorption occurs at λ = 734 nm, which is consistent with Fig. 1a. A similar plot of absorption vs. particle size,
  , is shown in Fig. 2b. Note that the absorption increases with decreasing particle size until it peaks at Dp = 8 nm, and then decreases thereafter. This can be understood from the relation
  and an analysis of the optimum absorption efficiency kopt,abs, which is plotted as a function of Dp in Fig. 2c. A careful analysis of Fig. 2c shows that kopt,abs increases faster than for Dp ∈ [5, 8] nm, increases slower than Dp for Dp ∈ [8, 46], and then decreases for larger particles, Dp > 46 nm. Thus, the profile shown in Fig. 2b is due to the behavior of kopt,abs as shown in Fig. 2c. Finally, Fig. 2d shows the values of ξAu and λ that produce an optimum absorption for each particle size. Note that the relative shell thickness ξAu decreases with particle size while the wavelength redshifts. By cross-referencing Fig. 2b,d, we confirm that maximum absorption occurs when Dp = 8 nm, ξAu = 14.43 (%) and λ = 734 nm as indicated in Fig. 1.
Figure 1. Optimum normalized absorption for SiO2-Au particles.

(a) surface plot of  . (b) 2D projection of surface plot.
Figure 2. Optimum normalized absorption.

(a) as a function of wavelength λ, (b) as a function of particle size Dp, (c). optimum absorption efficiency kopt,abs vs. particle size Dp and (d) optimum shell-to-radius ratio (solid line, left y-axis) and wavelength (dotted line, right y-axis).
Fe3O4@Au NP Colloids
We perform a similar analysis as above for the Fe3O4@Au Colloids. A major difference between these systems is that the Fe3O4 core is lossy, i.e.  is complex-valued as shown in Fig. 3. Thus, the core and shell both contribute to absorption. The optimization normalized absorption analysis is shown in Figs 4 and 5, and the unnormalized peak absorption for these plots is
  . Figure 4a,b show surface and projection plots of the optimized absorption cross-section, respectively. The peak absorption occurs at Dp = 44 nm and λ = 600 nm as indicated by the arrow. Note that there is a relatively broad region of pronounced absorption that spans Dp ∈ [5, 70] nm and λ ∈ [600, 800] nm. In this region, the optimum normalized absorption is within 90% of its maximum value. This is also illustrated in Fig. 5a,b and is in contrast to SiO2@Au NP colloids that exhibit a relatively sharp and localized absorption peak as shown in Fig. 1b. The optimum absorption efficiency vs. particle size is plotted for comparison in Fig. 5c. It should be noted that our predictions are in excellent agreement with previous studies of Fe3O4@Au particles. For example, Chaffin et. al. predicted an LSPR wavelength of ~740 nm for a core-shell particle of Dp = 50 nm at ξAu = 10 (%)23. Our corresponding prediction is 750 nm and is based on a more rigous dielectric function for Fe3O4 as shown in Fig. 3.
Figure 3. Refractive index of Fe3O4: real and imaginary components.

Figure 4.

Optimum normalized absorption cross-section vs. Dp and λ for the Fe3O4@Au colloids (a). The surface plot and (b). the corresponding 2D projection of the surface plot.
Figure 5. Optimum normalized absorption for Fe3O4@Au colloids.

(a) Optimum absorption vs. λ, (b). optimum absorption vs. Dp and (c). optimum absorption efficiency kopt,abs as a function of particle size.
It is instructive to investigate the absorption spectrum of Fe3O4@Au NPs as a function of size and shell thickness. In Fig. 6a,b, we plot the optimum normalized absorption for different sized particles with the shell-to-radius ratio fixed for all particles at ξAu = 25(%) and ξAu = 10(%), respectively. These figures show that smaller particles have a higher absorption efficiency and a LSPR wavelength that redshifts as the particle size increases. In Fig. 7, we plot the optimum normalized absorption spectrum for two different sized particles Dp = 60 nm and 100 nm for a range of shell-to-radius ratios, ξAu = 10, 20, 30 and 40%. Note that the LSPR wavelength redshifts as this ratio decreases as expected. For the smaller particle (Dp = 60 nm), a thicker gold shell produces a higher absorption efficiency but at a lower LSPR wavelength. The highest absorption occurs for a solid gold particle at its LSPR wavelength (~537 nm). However, for the larger particle (Dp = 100 nm), there is less variation in absorption with shell thickness, and the highest absorption occurs at an intermediate thickness of ξAu = 20(%).
Figure 6.

Parametric analysis of optimum normalized absorption vs. λ for different sized Fe3O4@Au NPs with a fixed shell-to-radius ratio ξAu: (a). ξAu = 25(%), (b). ξAu = 10(%).
Figure 7. Parametric analysis of optimum normalized absorption vs.

λ for two different sized Fe3O4@Au NPS with various shell-to-radius ratios ξAu (a). Dp = 60 nm, (b). Dp = 100 nm.
Discussion
Colloids of plasmonic NPs of all types are under intense development for a broad range of applications in fields that span energy harvesting to healthcare1,2,3,4,5,6,7,8. These colloids with their unique optical properties hold potential as transformative agents for many applications, especially biomedical applications where they can enable enhanced and unprecedented multimodal biosensing, bioimaging and therapeutic functionality. While many theoretical and experimental studies of colloidal plasmonic NPs have been reported, relatively few have quantified photothermal optimization for dilute colloids subject to the constraint of a prescribed volume fraction. We have introduced a computational method that can be used to for this purpose and have demonstrated it for monodisperse SiO2@Au and Fe3O4@Au NP colloids. In our analysis, we have allowed the particle size and incident wavelength to range from 5 to 100 nm and 600–1200 nm, respectively and the shell thickness to range from 0 to 100% of the particle radius. We have found that there is a unique mix of parameters (core radius, shell thickness, wavelength), for each of the two respective colloidal systems, that optimize absorption. Moreover, these parameters depend on the allowed range of particle size and wavelength, but significantly, are independent of the prescribed volume fraction. The analysis also shows that the SiO2@Au colloids exhibit a much sharper absorption peak than the Fe3O4@Au colloids. This is due to the lossy Fe3O4 core in the latter that contributes significantly to absorption. This implies that a carefully chosen lossy core can be used to produce a much broader absorption peak with much less sensitivity to variations in particle structure and wavelength as compared to a lossless core. More broadly, lossy dielectric particle constituents can be introduced to tune colloidal absorption to compensate for variations in particle size etc. that can occur during synthesis. Finally, the method we present can be readily adapted to colloids of plasmonic NPs with arbitrary materials, shapes and structures by using appropriate numerical methods to compute the optical absorption cross-section. The approach should find considerable use for the rational design of colloids and process variables for a broad range of photothermal applications.
Materials and Methods
The Computational Model
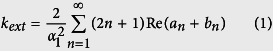
We use Mie theory to predict the optical absorption of dilute colloids of core-shell plasmonic particles as a function of particle size and structure (core radius, shell thickness) and the incident wavelength. The extinction, scattering and absorption efficiencies kext, kscat and kabs for the particles are computed using
 |
 |
 |
where an and bn are scattering coefficients taken from Bohren and Huffman24, i.e.,
 |
with
 |
and
 |
Here Dp and n1 are the diameter and refractive index of the shell, respectively, Dc and n2 are the diameter and refractive index of the core and nm is the refractive index of the surrounding medium (carrier fluid), which throughout this work is assumed to be H2O (Fig. 8). The shell has a thickness tAu = (Dp − Dc)/2, and we define a critical parameter ξAu ≡ (2tAu/Dp) × 100 (%), which is the percentage of the shell thickness to the overall particle radius, i.e. ξAu = 100 represents a solid gold sphere. It is important to note that all materials in our study can be dispersive, i.e. n1, n2 and nm can be complex-valued. The functions ψn, χn, ζn are Riccati–Bessel functions, which can be expressed as
Figure 8. Core-shell particle structure and parameters.

 |
where Jn+(1/2), Nn+(1/2) represent, respectively, half integer-order Bessel functions of the first and second kind and  represents the half-integer-order Hankel function of the second kind. The extinction, scattering and absorption cross-sections of a particle, σext, σscat and σabs, are just the product of the corresponding efficiency times the geometric cross-sectional area Ap e.g.,
  (m2), where Dp is the diameter of the particle. The comparison between our Mie theory-based model and corresponding experimental data is shown in Fig. 9. The particles in the experiment have a core radius of 62 nm (Dc = 124 nm), and a shell thickness of 14 nm (tAu = 14 nm) as reported in the literature25. Note that there is excellent agreement between the theoretical and experimental extinction data.
Figure 9. Mie theory model validation.

(a) normalized experimental extinction data (adapted form ref. 25), and (b) theoretical extinction data.
Material Properties
We apply Mie theory, Eqs (1, 2, 3, 4, 5, 6, 7), to dilute colloids of monodisperse (SiO2@Au) and (Fe3O4@Au) NPs. The synthesis of such particles has been described in the literature19,26. To model these particles, we need expressions for the refractive indices of the cores n1 = nSiO2 and  , the shell, n2 = nAu and the background medium, which is assumed to be water
  . Moreover, we need to allow for the fact that the gold shells can be thinner than the mean free path of the free electrons (~42 nm). A dielectric function for gold that accounts for electron-surface scattering is ref. 27.
 |
where εAu,bulk is the bulk dielectric function of gold, ω is the angular frequency of incident light, ωp = 0.93 eV is the plasma frequency, vf = 1.40 × 10¹⁵ nm/s is the Fermi velocity, l∞ = 42 nm is the mean free path of the free electrons, A is a dimensionless parameter, usually assumed to be close to unity (A = 1) and Leff = tA is the reduced effective mean free path of the free electrons (Fig. 8). The bulk dielectric function is given by an analytical expression that is based on an experiment-fitted critical points model28,29,30,
 |
The parameters in Eq. (9) are defined in detail in the literature28,29,30. It is instructive to evaluate the impact of the electron-surface scattering term in Eq. (8). We find that it produces a slight deviation of the real part of nAu from the corresponding bulk values at long wavelengths as shown in Fig. 10. There is virtually no difference in the imaginary part of nAu.
Figure 10. Real part of the refractive index of gold vs. shell thickness.

The SiO2 core is assumed to be lossless with a frequency-dependent refractive index of the form27
 |
The refractive index of the surrounding medium, in this case H2O, is also assumed to be lossless i.e.,
 |
In these expressions λ is the vacuum wavelength in units of micrometers.
The Fe3O4 core is lossy and the refractive index of Fe3O4 at optical frequencies has not been widely reported. We obtain values for the real and imaginary components of  in tabular form by discretizing plots of measured data found in the literature31. The components used in our analysis are plotted in Fig. 3. As noted, since
  is complex-valued the core contributes to absorption in the Fe3O4@Au NPs.
Optimization of Absorption
Our goal is to optimize the absorption of a colloid as a function of particle size, structure (core-shell dimensions) and wavelength subject to a prescribed volume fraction ϕ. Specifically, ϕ is held constant as we compare the absorption of monodisperse colloids with different-sized particles. The volume fraction is given by ϕ = npVp, where np is the particle concentration (number per unit volume) and  is the particle volume. If two different colloids, labeled i and j, have particle volumes then np,iVp,i = np,jVp,j = ϕ. Thus, np has a strong inverse dependency on particle size,
 |
We assume that the colloid is dilute and that ϕ is sufficiently small (but otherwise arbitrary) so that photonic interactions between the particles can be neglected32. Thus, the extinction, scattering and absorption cross-sections of the colloid, σcol,ext, σcol,scat and σcol,abs, can be modeled as the optical response of a single isolated immersed nanoparticle times the particle concentration18
 |
Combining Eqs (12 and 13) we find that,
 |
Thus, when the volume fraction is prescribed, the optimum absorption of a colloid depends on the ratio of the single particle absorption efficiency (k-factor) to the particle radius as in Eq. (14). In the remainder of this paper we simplify the notation and denote the absorption cross-section of the colloid by σabs.
Additional Information
How to cite this article: Xue, X. et al. Optimization of Optical Absorption of Colloids of SiO2@Au and Fe3O4@Au Nanoparticles with Constraints. Sci. Rep. 6, 35911; doi: 10.1038/srep35911 (2016).
Publisher’s note: Springer Nature remains neutral with regard to jurisdictional claims in published maps and institutional affiliations.
Acknowledgments
The authors acknowledge financial support from the U.S. National Science Foundation, through award number CBET-1337860.
Footnotes
The authors declare no competing financial interests.
Author Contributions X.X. developed and implemented the mathematical model; V.S. performed parametric analysis of optical absorption; E.P.F. provided technical guidance and reviewed final results.
References
- de Aberasturi D. J., Serrano-Montes A. B. & Liz-Marzán L. M. Modern Applications of Plasmonic Nanoparticles: From Energy to Health. Advanced Optical Materials 3, 602–617, doi: 10.1002/adom.201500053 (2015). [DOI] [Google Scholar]
- Grzelczak M. & Liz-Marzán L. M. Colloidal Nanoplasmonics: From Building Blocks to Sensing Devices. Langmuir 29, 4652–4663, doi: 10.1021/la4001544 (2013). [DOI] [PubMed] [Google Scholar]
- Eustis S. & el-Sayed M. A. Why gold nanoparticles are more precious than pretty gold: noble metal surface plasmon resonance and its enhancement of the radiative and nonradiative properties of nanocrystals of different shapes. Chemical Society reviews 35, 209, doi: 10.1039/b514191e (2006). [DOI] [PubMed] [Google Scholar]
- Jain P. K., Huang X., El-Sayed I. H. & El-Sayed M. A. Review of some interesting surface plasmon resonance-enhanced properties of noble metal nanoparticles and their applications to biosystems. Plasmonics 2, 107–118, doi: 10.1007/s11468-007-9031-1 (2007). [DOI] [Google Scholar]
- Huang X., Jain P. K., El-Sayed I. H. & El-Sayed M. A. Gold nanoparticles: interesting optical properties and recent applications in cancer diagnostics and therapy. Nanomedicine (London, England) 2, 681–693, doi: 10.2217/17435889.2.5.681 (2007). [DOI] [PubMed] [Google Scholar]
- Kelly K. L., Coronado E., Zhao L. L. & Schatz G. C. The Optical Properties of Metal Nanoparticles: The Influence of Size, Shape, and Dielectric Environment. The Journal of Physical Chemistry B 107, 668–677, doi: 10.1021/jp026731y (2003). [DOI] [Google Scholar]
- Link S. & El-Sayed M. A. Spectral Properties and Relaxation Dynamics of Surface Plasmon Electronic Oscillations in Gold and Silver Nano-dots and Nano-rods. J. Phys. Chem. B 103, 8410–8426, doi: 10.1021/jp9917648 (1999). [DOI] [Google Scholar]
- Link S. & El-Sayed M. A. Shape and size dependence of radiative, non-radiative and photothermal properties of gold nanocrystals. Int. Rev. Phys. Chem. 19, 409–453, doi: 10.1080/01442350050034180 (2000). [DOI] [Google Scholar]
- Teranishi T., Eguchi M., Kanehara M. & Gwo S. Controlled localized surface plasmon resonance wavelength for conductive nanoparticles over the ultraviolet to near-infrared region. Journal of Materials Chemistry 21, 10238–10242, doi: 10.1039/c0jm04545d (2011). [DOI] [Google Scholar]
- Oldenburg A. L., Hansen M. N., Zweifel D. A., Wei A. & Boppart S. A. Plasmon-resonant gold nanorods as low backscattering albedo contrast agents for optical coherence tomography. Optics Express 14, 6724–6738, doi: 10.1364/OE.14.006724 (2006). [DOI] [PubMed] [Google Scholar]
- Agarwal A. et al. Targeted gold nanorod contrast agent for prostate cancer detection by photoacoustic imaging. Journal of Applied Physics 102, 064701, doi: 10.1063/1.2777127 (2007). [DOI] [Google Scholar]
- He W., Low P. S., Cheng J.-X. & Shen Y. R. In vitro and in vivo Two-Photon Luminescence Imaging of Single Gold Nanorods. Proceedings of the National Academy of Sciences of the United States of America 102, 15752–15756, doi: 10.1073/pnas.0504892102 (2005). [DOI] [PMC free article] [PubMed] [Google Scholar]
- Bardhan R., Lal S., Joshi A. & Halas N. J. Theranostic nanoshells: from probe design to imaging and treatment of cancer. Accounts of chemical research 44, 936 (2011). [DOI] [PMC free article] [PubMed] [Google Scholar]
- Huang X., El-Sayed I. H., Qian W. & El-Sayed M. A. Cancer cell imaging and photothermal therapy in the near-infrared region by using gold nanorods. Journal of the American Chemical Society 128, 2115–2120, doi: 10.1021/ja057254a (2006). [DOI] [PubMed] [Google Scholar]
- Alali F., Karampelas I. H., Kim Y. H. & Furlani E. P. Photonic and thermofluidic analysis of colloidal plasmonic nanorings and nanotori for pulsed-laser photothermal applications. Journal of Physical Chemistry C 117, 20178–20185, doi: 10.1021/jp406986y (2013). [DOI] [Google Scholar]
- Furlani E. P., Karampelas I. H. & Xie Q. Analysis of pulsed laser plasmon-assisted photothermal heating and bubble generation at the nanoscale. Lab on a Chip 12, 3707, doi: 10.1039/c2lc40495h (2012). [DOI] [PubMed] [Google Scholar]
- Chen J. et al. Immuno gold nanocages with tailored optical properties for targeted photothermal destruction of cancer cells. Nano letters 7, 1318–1322, doi: 10.1021/nl070345g (2007). [DOI] [PMC free article] [PubMed] [Google Scholar]
- Frangioni J. V. In vivo near-infrared fluorescence imaging. Current Opinion in Chemical Biology 7, 626–634, doi: 10.1016/j.cbpa.2003.08.007 (2003). [DOI] [PubMed] [Google Scholar]
- Xu Z., Hou Y. & Sun S. Magnetic core/shell Fe3O4/Au and Fe3O4/Au/Ag nanoparticles with tunable plasmonic properties. Journal of the American Chemical Society 129, 8698–8699, doi: 10.1021/ja073057v (2007). [DOI] [PubMed] [Google Scholar]
- Rahman B. M. A. & Agrawal A. Finite Element Modeling Methods for Photonics. (Artech House Inc, 2013). [Google Scholar]
- Musa S. M. & Ebooks C. Computational nanophotonics: modeling and applications. Vol. 1 (Taylor & Francis, 2013). [Google Scholar]
- Karampelas I. H., Liu K., Alali F. & Furlani E. P. Plasmonic Nanoframes for Photothermal Energy Conversion. Journal of Physical Chemistry C 120, 7256–7264, doi: 10.1021/acs.jpcc.5b12743 (2016). [DOI] [Google Scholar]
- Chaffin E. A., Bhana S., O’Connor R. T., Huang X. H. & Wang Y. M. Impact of Core Dielectric Properties on the Localized Surface Plasmonic Spectra of Gold-Coated Magnetic Core Shell Nanoparticles. Journal of Physical Chemistry B 118, 14076–14084, doi: 10.1021/jp505202k (2014). [DOI] [PubMed] [Google Scholar]
- Bohren C. F. & Huffman D. R. Absorption and scattering of light by small particles. (Wiley, 1983). [Google Scholar]
- Ayala-Orozco C. et al. Au Nanomatryoshkas as Efficient Near-Infrared Photothermal Transducers for Cancer Treatment: Benchmarking against Nanoshells. ACS NANO 8, 6372–6381, doi: 10.1021/nn501871d (2014). [DOI] [PMC free article] [PubMed] [Google Scholar]
- Zhang X., Ye S., Zhang X. & Wu L. Optical properties of SiO2@M (M = Au, Pd, Pt) core–shell nanoparticles: material dependence and damping mechanisms. J. Mater. Chem. C 3, 2282–2290, doi: 10.1039/C4TC02780A (2015). [DOI] [Google Scholar]
- Tuersun P. & Han X. e. Optical absorption analysis and optimization of gold nanoshells. Applied optics 52, 1325 (2013). [DOI] [PubMed] [Google Scholar]
- Meyer M., Etchegoin P. & Le Ru E. An analytic model for the optical properties of gold. Journal of Chemical Physics 125, 164705-164705-164703, doi: 10.1063/1.2360270 (2006). [DOI] [PubMed] [Google Scholar]
- Meyer M., Etchegoin P. & Le Ru E. Erratum: “An analytic model for the optical properties of gold” [J. Chem. Phys. 125, 164705 (2006)]. Journal of Chemical Physics 127, 189901-189901-189901, doi: 10.1063/1.2802403 (2007). [DOI] [PubMed] [Google Scholar]
- Johnson P. B. & Christy R. W. Optical Constants of the Noble Metals. Physical Review B 6, 4370–4379, doi: 10.1103/PhysRevB.6.4370 (1972). [DOI] [Google Scholar]
- Schlegel A., Alvarado S. F. & Wachter P. Optical properties of magnetite (Fe3O4). Journal of Physics C: Solid State Physics 12, 1157, doi: 10.1088/0022-3719/12/6/027 (1979). [DOI] [Google Scholar]
- Barrera R. n. G., Noguez C. & Anda E. V. A new diagrammatic summation for the effective dielectric response of composites. The Journal of Chemical Physics 96, 1574, doi: 10.1063/1.462141 (1992). [DOI] [Google Scholar]