Significance
In Alzheimer’s disease, soluble clusters of amyloid-β (Aβ) are believed to degrade synapses and impair memory formation. The removal of AMPA receptors from synapses was previously shown to be a critical step in Aβ-driven synapse loss. In this report, we establish that AMPA receptors that contain subunit GluA3 play a central role in Aβ-driven synaptic and memory deficits. Neurons that lack GluA3 are resistant to synaptic weakening and inhibition of synaptic plasticity, and mice that lack GluA3 were resistant to memory impairment and premature mortality. Our experiments suggest that Aβ initiates synaptic and memory deficits by removing GluA3-containing AMPA receptors from synapses.
Keywords: Alzheimer, AMPA, synapse, amyloid
Abstract
Amyloid-β (Aβ) is a prime suspect for causing cognitive deficits during the early phases of Alzheimer’s disease (AD). Experiments in AD mouse models have shown that soluble oligomeric clusters of Aβ degrade synapses and impair memory formation. We show that all Aβ-driven effects measured in these mice depend on AMPA receptor (AMPAR) subunit GluA3. Hippocampal neurons that lack GluA3 were resistant against Aβ-mediated synaptic depression and spine loss. In addition, Aβ oligomers blocked long-term synaptic potentiation only in neurons that expressed GluA3. Furthermore, although Aβ-overproducing mice showed significant memory impairment, memories in GluA3-deficient congenics remained unaffected. These experiments indicate that the presence of GluA3-containing AMPARs is critical for Aβ-mediated synaptic and cognitive deficits.
Synaptic perturbations are strongly linked to cognitive decline and memory impairment in patients with early-stage Alzheimer’s disease (AD) (1, 2). The accumulation of soluble oligomeric clusters of amyloid-β (Aβ), a secreted proteolytic derivative of the amyloid precursor protein (APP), may be important for the early synaptic failure that is seen in AD pathogenesis (3–6). Neurons that overexpress APP or are exposed to Aβ oligomers show synaptic depression, a loss of dendritic spines, and a reduced capacity for synaptic plasticity (7–10). For all these effects to occur, NMDA receptor (NMDAR) activity is required (7, 11–13). Aβ oligomers trigger an NMDAR-dependent signaling pathway that leads to synaptic depression through the removal of AMPA receptors (AMPARs) and NMDARs from synapses (7, 11, 14). Interestingly, a blockade of AMPAR endocytosis prevents the depletion of NMDARs and a loss of spines (15, 16), suggesting that the removal of AMPARs from synapses is critical for this pathway to induce synaptic failure.
Excitatory neurons of the mature hippocampus predominantly contain two types of AMPARs in approximately equivalent amounts (17): those consisting of subunits GluA1 and GluA2 (GluA1/2s) and those consisting of subunits GluA2 and GluA3 (GluA2/3s) (18). GluA1-containing AMPARs are inserted into synapses upon the induction of long-term potentiation (LTP) in brain slices (19) and play a prominent role in memory formation (20, 21). In contrast, GluA2/3s contribute relatively little to synaptic currents, LTP, or memory formation (22–25) and have been implicated in participating in the homeostatic scaling of synapse strength (26, 27). Here we demonstrate that the AMPAR subunit GluA3 plays a major role in AD pathology by showing that mice lacking GluA3 are protected against Aβ-driven synaptic deficits, spine loss, and memory impairment.
Results
GluA3-Deficient Neurons Are Resistant Against Aβ-Mediated Synaptic Depression.
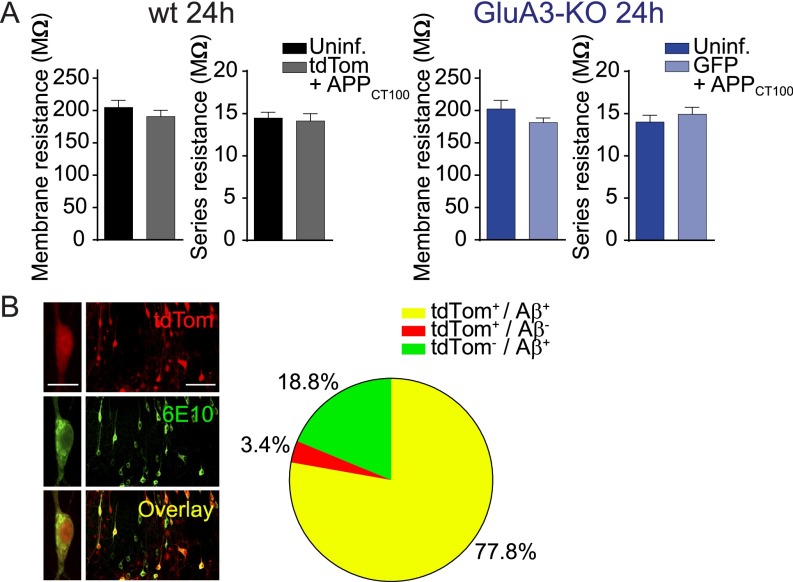
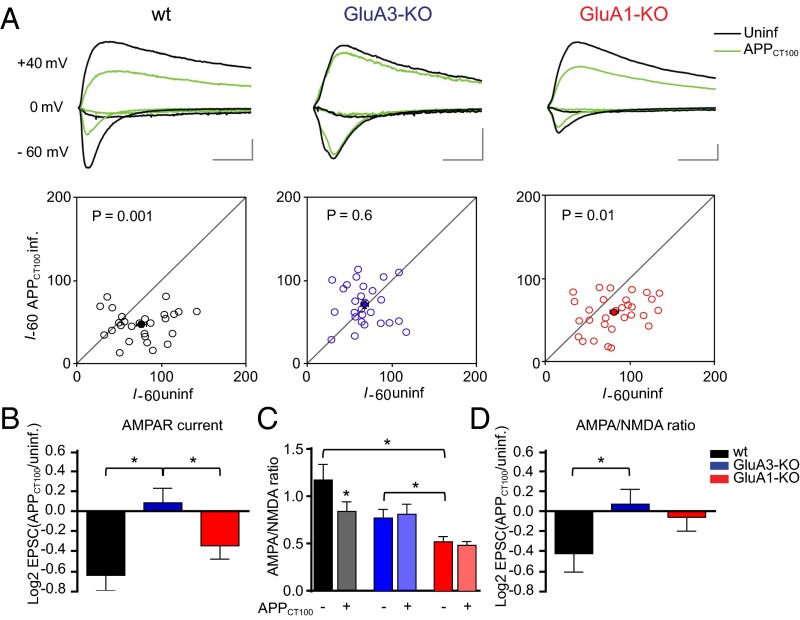
To assess whether the removal of AMPARs from synapses by Aβ depends on AMPAR subunit composition, organotypic hippocampal slice cultures were prepared from GluA1-deficient or GluA3-deficient mice and their WT littermates. CA1 neurons were sparsely (<10%) infected with Sindbis virus expressing APPCT100, the β-secretase product of APP and precursor to Aβ, together with tdTomato fluorescent protein under the control of a second subgenomic promoter. Twenty to thirty hours after viral infection, synaptic currents evoked by electrical stimulation of Schaffer collateral inputs were measured simultaneously on tdTomato-expressing and neighboring uninfected pyramidal CA1 neurons. We ascertained that the majority of tdTomato-expressing neurons produced APPCT100 without affecting their membrane resistance (Fig. S1), supporting previous demonstrations that in these conditions the health of the neurons is not affected by Sindbis infection (7, 11, 19). WT neurons that expressed APPCT100 showed decreased AMPAR currents (P < 0.01) (Fig. 1A) and reduced AMPA/NMDA ratios (P = 0.03) (Fig. 1C), which have been shown to be caused by increased neuronal production of Aβ (7, 11). In CA1 neurons of GluA3-deficient organotypic slices the AMPA/NMDA ratios were reduced 35% on average compared with WT CA1 neurons (P = 0.05) (Fig. 1C), and APPCT100 expression failed to decrease synaptic AMPAR currents (P = 0.6) (Fig. 1 A and B) or AMPA/NMDA ratios (P = 0.6) (Fig. 1 C and D). GluA1-deficient neurons had an even more reduced AMPA/NMDA ratio (55%) (Fig. 1C) but still showed APPCT100-induced synaptic AMPAR depression (P = 0.01) (Fig. 1A) similar to the depression in WT neurons (P = 0.2) (Fig. 1B). These data indicate that the presence of AMPARs containing GluA3, but not of those containing GluA1, is crucial for Aβ to trigger synaptic AMPAR depression.
Fig. S1.
Sindbis virus expression does not affect membrane resistance of neurons and allows dual APPCT100/tdTomato expression. (A) Average membrane and series resistance of whole-cell patch-clamped CA1 neurons expressing tdTomato+APPCT100 (gray; n = 24) and uninfected WT neurons (black; n = 24) 24 h after infection, GFP+APPCT100-expressing (light blue; n = 13) and uninfected (dark blue; n = 15) GluA3-KO neurons 24 h after infection. The mean membrane resistance indicates that Sindbis-driven APPCT100 expression did not compromise neuronal health. Data are mean ± SEM. Statistics: two-tailed unpaired t test. (B, Left) Sample images of an individual neuron and a population of CA1 neurons in an organotypic slice infected with Sindbis virus expressing APPCT100/tdTomato and immunostained for Aβ (6E10 antibody). [Scale bars: 20 μm (Left) and 100 μm (Right).] (Right) The majority of tdTomato-expressing CA1 neurons (total: n = 144) showed positive staining for Aβ.
Fig. 1.
GluA3-deficient neurons are resistant against Aβ-mediated synaptic AMPAR depression as shown by dual whole-cell recordings of APPCT100-infected and neighboring uninfected CA1 neurons in organotypic slices from WT mice (black), GluA3-KO littermate mice (blue), and GluA1-KO littermate mice (red). (A) Sample traces (Upper) and dot plots (Lower) of paired EPSC recordings (open dots) with averages denoted as filled dots (WT, n = 27; GluA3-KO, n = 27; GluA1-KO, n = 31). Genotype × APPCT100: P < 0.01 (two-way ANOVA). (Scale bars: 20 ms and 50 pA.) (B) Fold change in AMPAR currents upon APPCT100 expression, calculated as the average log2-transformed ratio of EPSCs recorded from APPCT100-infected neurons over EPSCs from neighboring uninfected neurons. (C) AMPA/NMDA ratios of uninfected and APPCT100-infected neurons (WT, n = 18; GluA3-KO, n = 18; GluA1-KO, n = 20). Genotype × APPCT100: P = 0.3 (two-way ANOVA). (D) Fold change in AMPA/NMDA ratios upon APPCT100 expression, calculated as in B. Data are mean ± SEM. Statistics: two-tailed paired (A and C) or unpaired (B and D) t test. *P < 0.05.
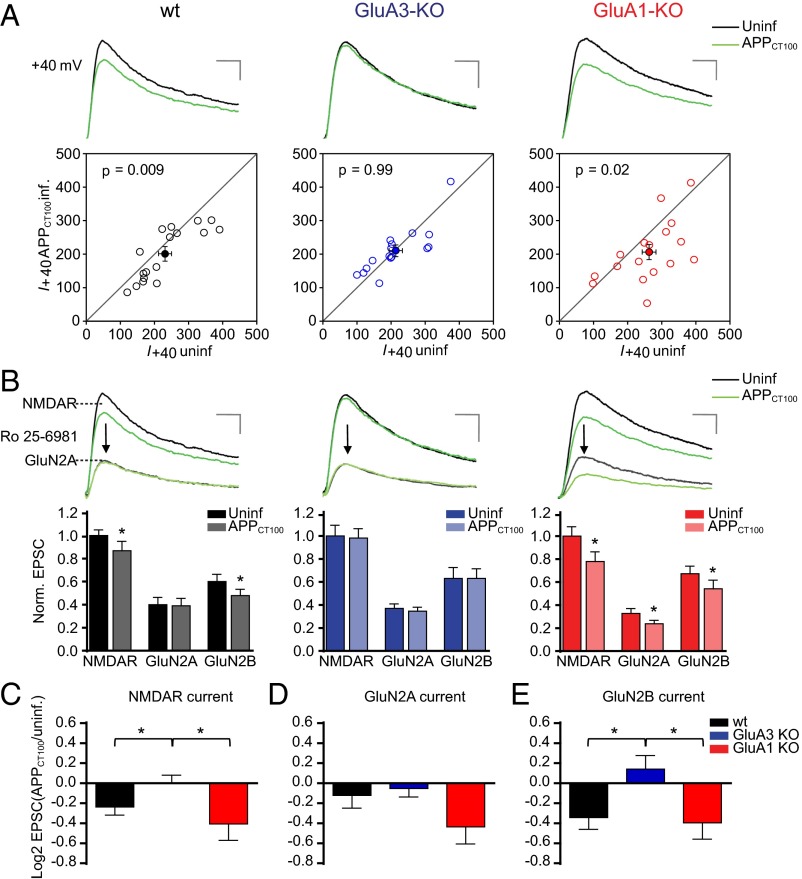
To assess the effect of Aβ on NMDARs, we compared synaptic NMDAR currents in pairs of APPCT100-infected and nearby uninfected neurons (Fig. 2). APPCT100 expression led to a significant decrease in synaptic NMDAR currents in WT CA1 neurons (P < 0.01) (Fig. 2A) and in GluA1-deficient CA1 neurons (P = 0.02) but not in neurons lacking GluA3 (P > 0.9) (Fig. 2 A and C). These data indicate that neurons are susceptible to Aβ-mediated NMDAR depression only when they express AMPAR subunit GluA3. Digital subtraction of currents before and after wash-in of Ro 25-6981, a specific blocker of the GluN2B subunit, permitted measurement of the relative contribution of subunits GluN2A and GluN2B to the NMDAR currents. The relative contribution of GluN2A and GluN2B to total NMDAR currents was not altered by the absence of GluA1 or GluA3 (Fig. 2B). As previously shown (11), APPCT100 expression in WT neurons selectively affected NMDAR currents mediated by GluN2B (P = 0.01) (Fig. 2 B and E) but not those mediated by GluN2A (P = 0.4) (Fig. 2 B and D). APPCT100 expression in GluA3-deficient neurons failed to reduce NMDAR currents independently of whether they contained GluN2A (P = 0.6) (Fig. 2 B and D) or GluN2B (P = 0.3) (Fig. 2 B and E). In GluA1-deficient neurons both GluN2A (P = 0.02) and GluN2B (P = 0.03) NMDAR currents were significantly reduced upon APPCT100 expression (Fig. 2 B–E), suggesting that the presence of GluA1 protects synapses from an Aβ-mediated reduction in synaptic GluN2A currents. A proportional decrease in AMPAR (Fig. 1B) and NMDAR (Fig. 2C) currents in APPCT100-expressing GluA1-deficient neurons corresponds with their unchanged AMPA/NMDA ratio (Fig. 1D).
Fig. 2.
GluA3-deficient neurons are resistant against Aβ-mediated synaptic NMDAR depression as shown by dual whole-cell recordings of APPCT100-infected and neighboring uninfected CA1 neurons in organotypic slices from WT mice (black), GluA3-KO littermate mice (blue), or GluA1-KO littermate mice (red). (A) Sample traces (Upper) and dot plots (Lower) of paired NMDAR EPSC recordings (open dots) with the averages shown as filled dots (WT, n = 17; GluA3-KO, n = 16; GluA1-KO, n = 17). Genotype × APPCT100: P = 0.05 (two-way ANOVA). (Scale bars: 20 ms and 50 pA.) (B) Sample traces (Upper) and average EPSC currents normalized to the average of the uninfected neurons (Lower) before and after Ro 25-6981 wash-in to reveal GluN2A- and GluN2B-contributing NMDAR currents. (Scale bars: 20 ms and 50 pA.) (C–E) Fold change in total NMDAR (C), GluN2A (D), and GluN2B (E) currents upon APPCT100 expression, calculated as the average log2-transformed ratio of EPSCs recorded from APPCT100-infected neurons over EPSCs from neighboring uninfected neurons. Data are mean ± SEM. Statistics: two-tailed paired (A and B) or unpaired (C–E) t test. *P < 0.05.
Aβ-Mediated Synapse Loss Depends on the Presence of GluA3.
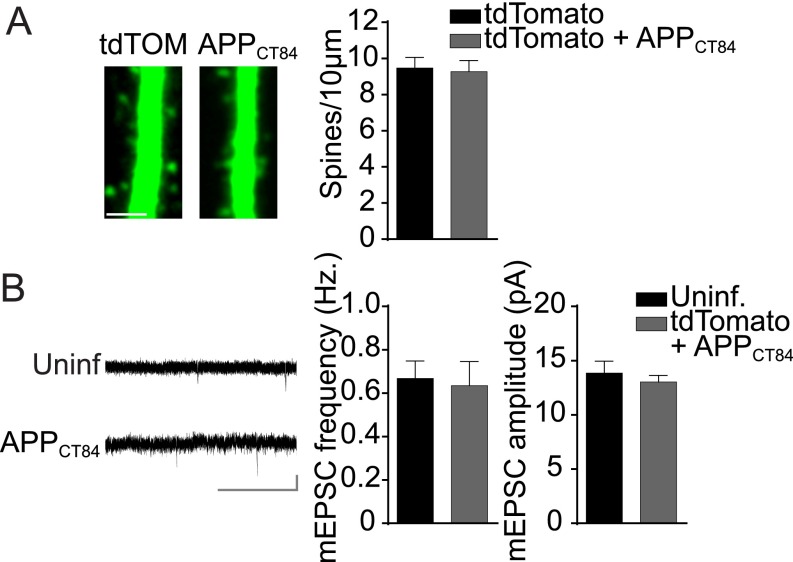
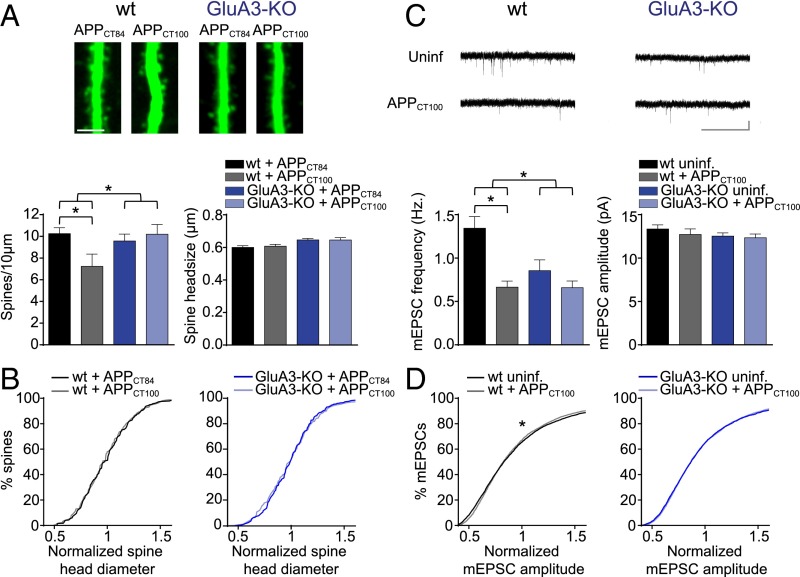
The number of AMPARs at a synapse correlates well with the synapse size and the spine size (28). To examine whether Aβ selectively targets a specific subtype of synapses harboring GluA3-containing AMPARs, we analyzed spine densities, spine size, and miniature excitatory postsynaptic potential (mEPSC) events in Aβ-overproducing neurons. We assessed Aβ-induced spine loss by expressing APPCT100 together with the cytosolic marker tdTomato in CA1 neurons of organotypic slices. As a control we expressed APPCT84, the α-secretase product of APP, which does not produce Aβ and did not affect spine density, mEPSC frequency, or mEPSC amplitude (Fig. S2). The spine density at apical dendrites was significantly lower in APPCT100-expressing WT CA1 neurons than in APPCT84-expressing ones (P = 0.01) (Fig. 3A). The loss of spines in APPCT100-expressing CA1 neurons occurred without a change in the average spine head diameter (P = 0.6) (Fig. 3A) or in the distribution of spine head sizes (Fig. 3B). Correspondingly, CA1 neurons expressing APPCT100 showed a decrease in mEPSC frequency (P < 0.01) (Fig. 3C) but not in average mEPSC amplitude (P = 0.9) (Fig. 3C). A minor change in the distribution of mEPSC amplitudes (P = 0.02) (Fig. 3D) indicates that APPCT100-expressing neurons have a slightly smaller proportion of synapses with large AMPAR current amplitudes.
Fig. S2.
Expression of APPct84 does not affect spine density or mEPSCs. (A, Left) Sample two-photon images of apical CA1 dendrites expressing tdTomato or tdTomato+APPct84. (Scale bar: 3 μm.) (Right) The average spine density was not different in CA1 pyramidal neurons expressing tdTomato (n = 11) or tdTomato+APPct84 (n = 11). (B, Left) Sample mEPSC traces of WT neurons with or without APPCT84 expression. (Scale bar: 3 s, 10 pA.) (Right) APPCT84 expression did not affect mean mEPSC frequency or amplitude in WT neurons (uninfected, n = 17; CT84, n = 14). Data are mean ± SEM. Statistics: two-tailed unpaired t test.
Fig. 3.
GluA3-deficient neurons are resistant against Aβ-mediated spine loss. Spine and mEPSC analysis of CA1 neurons in organotypic slices from WT (black) or GluA3-KO (blue) mice. (A, Upper) Sample images of WT and GluA3-KO dendrites expressing APPCT84 or APPCT100. (Scale bar: 5 μm.) (Lower) APPCT100 expression reduced spine density in WT but not in GluA3-KO neurons without changing the average spine head diameter. (WT: APPCT84, n = 20 and APPCT100: n = 13; GluA3-KO: APPCT84, n = 26 and APPCT100, n = 19). (B) Distribution of spine head diameters in WT or GluA3-KO neurons expressing APPCT100 or APPCT84. (C, Upper) Sample mEPSC traces of WT and GluA3-KO neurons with or without APPCT100 expression. (Scale bar: 3 s, 10 pA.) (Lower) APPCT100 expression reduced mEPSC frequency in WT neurons but not in GluA3-KO neurons without changing average mEPSC amplitude (WT: APPCT100, n = 24 and uninfected, n = 25; GluA3-KO: APPCT100, n = 21 and uninfected, n = 22). (D) APPCT100 changed the normalized distribution of mEPSC amplitudes in WT neurons but not in GluA3-KO neurons. Data are mean ± SEM. Statistics: two-way ANOVA with post hoc Sidak comparisons (A and C) or K–S test (B and D). *P < 0.05.
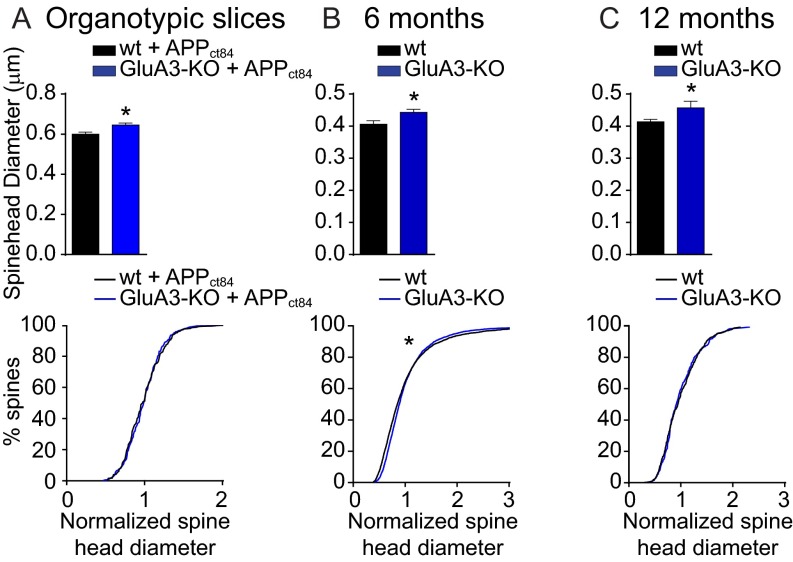
GluA3-deficient CA1 neurons have a spine density similar to that in WT neurons (P = 0.6) with, on average, slightly larger spine heads (P = 0.002) (Fig. S3). APPCT100 expression in these GluA3-deficient neurons did not lead to a reduced spine density (P > 0.9) or spine head size (P > 0.9) (Fig. 3A). The average mEPSC amplitude also was similar between GluA3-deficient neurons and WT neurons (P = 0.2) and was not altered upon APPCT100 expression in GluA3-deficient neurons [P = 0.7 (Fig. 3C) and P = 0.6 (Fig. 3D)]. Notably, the mEPSC frequency was significantly lower in GluA3-deficient neurons (P < 0.01) (Fig. 3C), similar to the level in APPCT100-expressing WT neurons (P = 0.2), and did not change upon APPCT100 expression (P = 0.2) (Fig. 3C). These findings indicate that Aβ triggers a reduction in synaptic AMPAR currents and a loss of spines only when GluA3 is present. Combined with previous reports showing that AMPAR endocytosis is required for the synaptotoxic effects of Aβ (15, 16), our data indicate that the active removal of GluA3-containing AMPARs by Aβ (but not the genetic deficiency of GluA3) leads to a loss of spines.
Fig. S3.
GluA3–deficient CA1 neurons have increased spine head size in the SLM. Shown are the average spine head diameter (Upper) and the normalized distribution of spine head sizes (Lower) of CA1 pyramidal neurons in WT (black) and GluA3-KO (blue) littermate mice. (A) SR dendrites expressing APPCT84 + tdTomato in organotypic hippocampal slices as in Fig. 3A. (B and C) SLM dendrites in 6-mo-old mice as in Fig. 6G (B) and in 12-mo-old mice as in Fig. 5H (C). Data are mean ± SEM. Statistics: two-tailed unpaired t tests for spine diameter and K–S test for spine size distributions. *P < 0.05.
GluA3-Deficient Neurons Are Insensitive to the Aβ-Mediated Blockade of LTP.
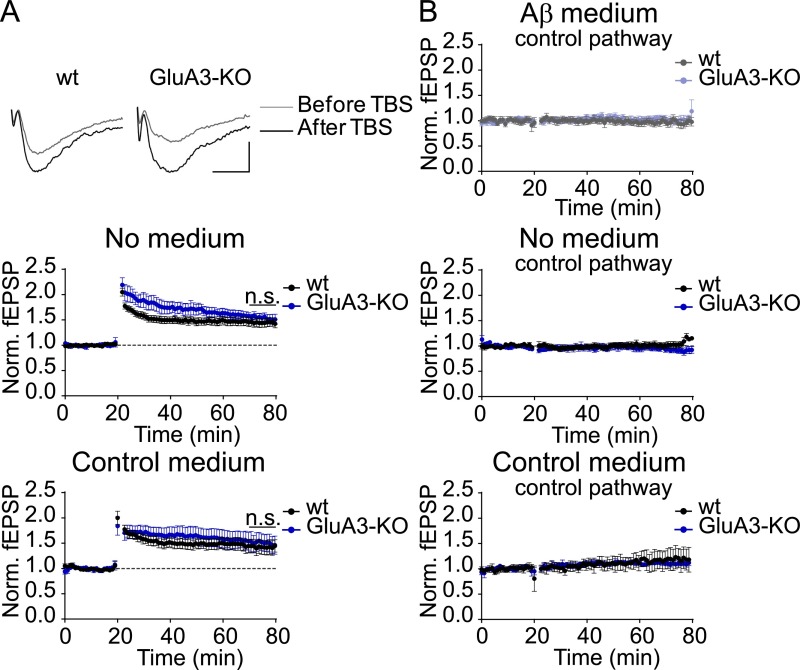
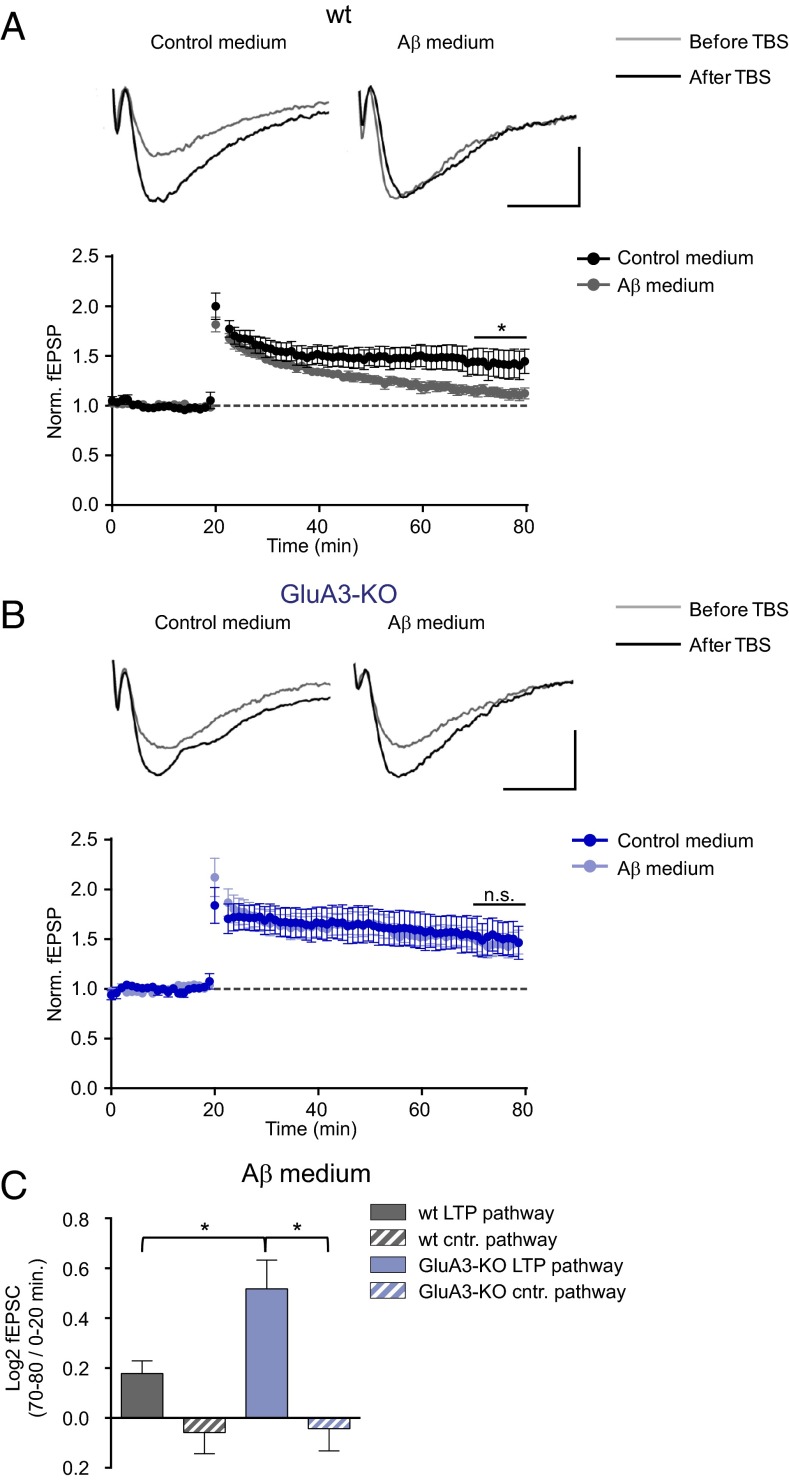
Aβ oligomers are capable of blocking NMDAR-dependent LTP (9). To assess whether GluA3-deficient neurons are susceptible to the Aβ-mediated blockade of LTP, we performed extracellular local field potential recordings in brain slices acutely isolated from WT mice and GluA3-deficient littermates. Previous studies have shown that LTP induction in GluA3-deficient brain slices produces a level of potentiation that is similar to (23) or larger than (25) that in WT neurons. We observed that a theta-burst stimulation (TBS) of CA3–CA1 synapses produced stable, pathway-specific LTP of similar magnitude in WT and GluA3-deficient slices (Fig. S4). This experiment was repeated in slices incubated with cell culture medium from a cell line that produces Aβ in oligomeric form or with control medium (29). The incubation of slices with 1 nM of oligomeric Aβ blocked LTP in WT slices (P = 0.03) (Fig. 4A) but failed to block LTP in GluA3-deficient slices (P = 0.8) (Fig. 4B). In the presence of Aβ oligomers LTP was significantly smaller in WT slices than in GluA3-deficient slices (P = 0.04) (Fig. 4C). Thus, GluA3 expression was critical for Aβ oligomers to block LTP.
Fig. S4.
GluA3-KO slices show normal pathway-specific LTP. (A) Sample LTP traces (Top; scale bar: 10 ms, 0.2 mV) and peak LTP responses (Middle and Bottom) show LTP with similar magnitude in the absence of medium (WT, n = 11; GluA3-KO, n = 6) and in the presence of control medium (WT, n = 6; GluA3-KO, n = 8) in WT and GluA3-KO slices. (B) The control pathways of the LTP experiments shown in Fig. 4 remained stable over time in Aβ medium (WT, n = 5; GluA3-KO n = 8) (Top), in the absence of medium (WT, n = 6; GluA3-KO, n = 6) (Middle), and in control medium (WT, n = 3; GluA3-KO, n = 3) (Bottom), demonstrating that the LTP was specific for the stimulated pathway. Data are mean ± SEM. Statistics: two-tailed unpaired t test over the last 10 min of the recording.
Fig. 4.
GluA3-deficient neurons are resistant against the Aβ-mediated block in LTP. (A and B) Sample traces (Upper) and average peak field potential responses (Lower) recorded at the CA1 stratum radiatum before and after theta burst stimulation (TBS) at 20 min. (Scale bars: 10 ms, 0.2 mV.) (A) LTP was inhibited in WT neurons by Aβ-containing medium (gray, n = 11) compared with control medium (black, n = 6). (B) In GluA3-KO slices LTP was not inhibited by Aβ-containing medium (light blue, n = 8) in comparison with control medium (dark blue, n = 8). (C) In the presence of Aβ-containing medium, the fold change in AMPAR currents upon TBS, calculated as the log2-transformed ratio of the fEPSP 50–60 min after TBS (i.e., at 70–80 min) over the fEPSP during baseline (0–20 min) was larger in the LTP pathway of GluA3-KO slices than in the LTP pathway of WT slices and control pathways (plots of control pathways are shown in Fig. S4). Data are mean ± SEM. Statistics: two-tailed unpaired t test over the last 10 min of the recording (A and B) and two-way ANOVA with post hoc Sidak comparisons (C). *P < 0.05.
GluA3-Deficient APP/PS1 Transgenic Mice Do Not Display Spine Loss or Memory Impairment.
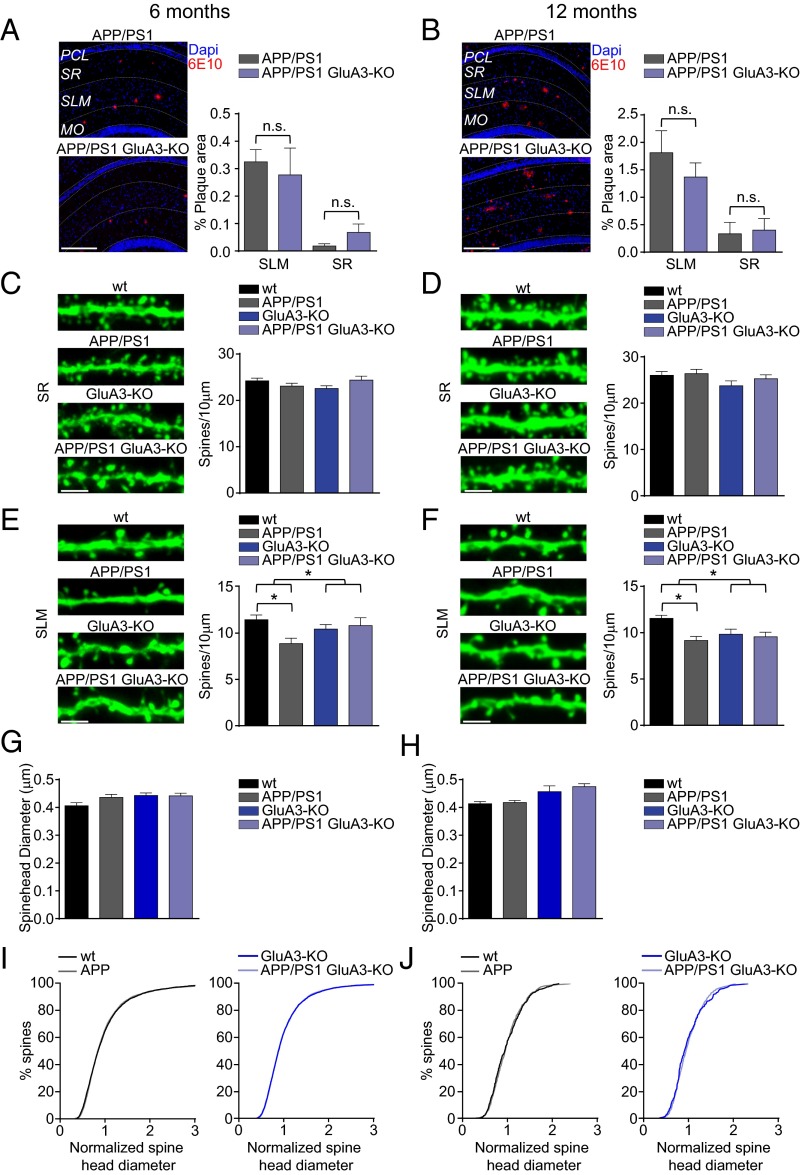
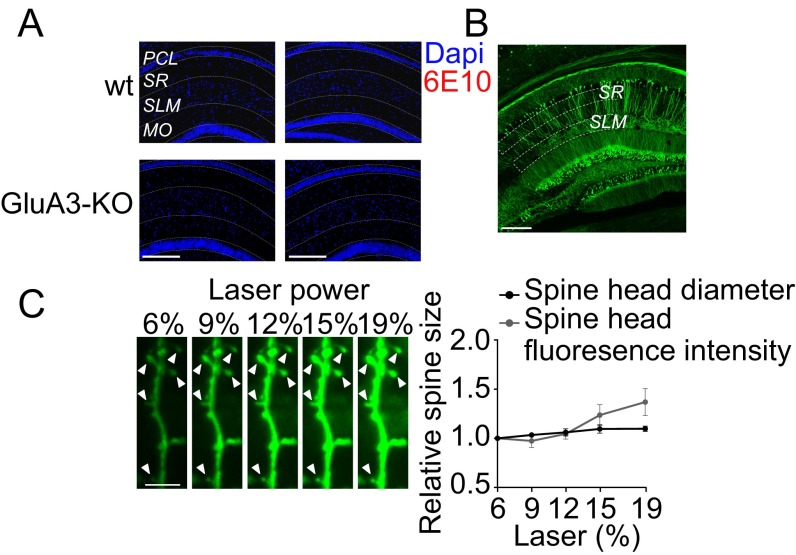
Mice that express human APP (APPswe) and mutant presenilin 1 (PS1dE9) transgenes produce high levels of Aβ42 and are used as a mouse model for familial AD (30). Immunostaining for Aβ shows that these APP/PS1-transgenic mice start to develop plaques in the CA1 region of the hippocampus at the age of 6 mo, with more plaques situated in the stratum lacunosum-moleculare (SLM) than in the stratum radiatum (SR) (Fig. 5A and Fig. S5A). To assess whether these local differences in Aβ load correspond with location-specific patterns of spine loss (31), spine analysis was performed on oblique CA1 dendrites in both the SR and the SLM. Indeed, although the spine density in the SR remained unaffected (P = 0.6) (Fig. 5 C and D and Fig. S5B), we did observe a reduced spine density in the SLM (P < 0.01) (Fig. 5 E and F). Although in 12-mo-old mice the plaque load had approximately quadrupled in both the SR and the SLM (Fig. 5B), the spine loss in the CA1 had not increased (Fig. 5 D and F). The observed spine loss in the SLM of APP/PS1-transgenic mice was not accompanied by a change in the average diameter of spine heads (Fig. 5 G and H) or in the distribution of spine head sizes (Fig. 5 I and J). In GluA3-deficient APP/PS1 mice the development of plaque formation was similar to that in their GluA3-expressing APP/PS1 littermates (P > 0.9) (Fig. 5 A and B), suggesting that the level of Aβ accumulation was unaffected by the absence of GluA3. As we observed in organotypic slice cultures, GluA3-deficient CA1 neurons have, on average, a spine density similar to that in their age-matched littermates (Fig. 5 C–F) but have larger spine heads (Fig. 5 G and H and Fig. S3). Notably, in GluA3-deficient mice the APP/PS1 transgenes did not cause a reduced spine density in the SLM at either 6 or 12 mo of age (Fig. 5 E and F), indicating that APP/PS1 mice are susceptible to spine loss only when they express AMPAR subunit GluA3.
Fig. 5.
APP/PS1 mice that lack GluA3 develop Aβ plaques but do not show spine loss. (A and B) Examples of 6E10 staining (Left) and average mean plaque load (Right) of 6-mo-old (A) and 12-mo-old (B) APP/PS1 mice (n = 4 mice for all groups) demonstrate that more Aβ plaques were formed in the SLM than in the SR. MO, molecular layer of the dentate gyrus; PCL, pyramidal cell layer. (Scale bars: 250 μm.) (C and D, Left) Sample images showing spine density of eYFP-expressing CA1 dendrites in the SR. (Right) Average spine density of CA1 dendrites in the SR was similar in dendrites of 6-mo-old (WT = 18; APP/PS1 = 24; GluA3-KO = 18; APP/PS1/GluA3-KO = 18) (C) and 12-mo-old (WT = 24; APP/PS1 = 24; GluA3-KO = 12; APP/PS1/GluA3-KO = 18) (D) APP/PS1 mice. (Scale bars: 2 μm.) (E and F, Left) Sample images showing spine density in eYFP-expressing SLM dendrites. (Right) Average spine density was lower in APP/PS1-expressing SLM dendrites, provided that they expressed GluA3, in both 6-mo-old (WT = 18; APP/PS1 = 24; GluA3-KO = 18; APP/PS1/GluA3-KO = 18) (E) and 12-mo-old (WT = 24; APP/PS1 = 24; GluA3-KO = 12; APP/PS1/GluA3-KO = 18) (F) mice. (Scale bars: 2 μm.) (G and H) Mean spine head diameter was unaffected in 6-mo-old (G) and 12-mo-old (H) APP/PS1 mice. (I and J) Spine head size normalized distribution was unaffected in 6-mo-old (I) and 12-mo-old (J) APP/PS1 mice. Data are mean ± SEM. Statistics: two-way ANOVA with post hoc Sidak comparisons (A–H), or K–S test (I and J). *P < 0.05.
Fig. S5.
Control experiments for plaque load analysis and spine size analysis in the CA1 of aged mice. (A) 6E10 staining in 6-mo-old (Left) and 12-mo-old (Right) WT and GluA3-KO mice without the APP/PS1 transgenes confirmed an absence of plaque formation. (Scale bar: 250 μm.) (B) Confocal image of a hippocampal slice of a Thy1-eYFP mouse depicting the regions where spine density was quantified. (Scale bar: 250 μm.) (C) Comparison of two different spine-size analyses showed that the average spine head diameter was less sensitive than spine volume to variation in fluorescence intensity reflected as the spine brightness (background-subtracted and corrected for fluorescence levels in the dendritic shaft). (Left) Confocal images of a CA1 dendrite obtained with different levels of laser intensity. Arrowheads indicate the spines analyzed. (Scale bar: 2 μm.) (Right) Spine head diameter and spine fluorescence (after background fluorescence subtraction) normalized to the value at 6% laser intensity plotted against laser intensity (n = 5 spines). Data are mean ± SEM.
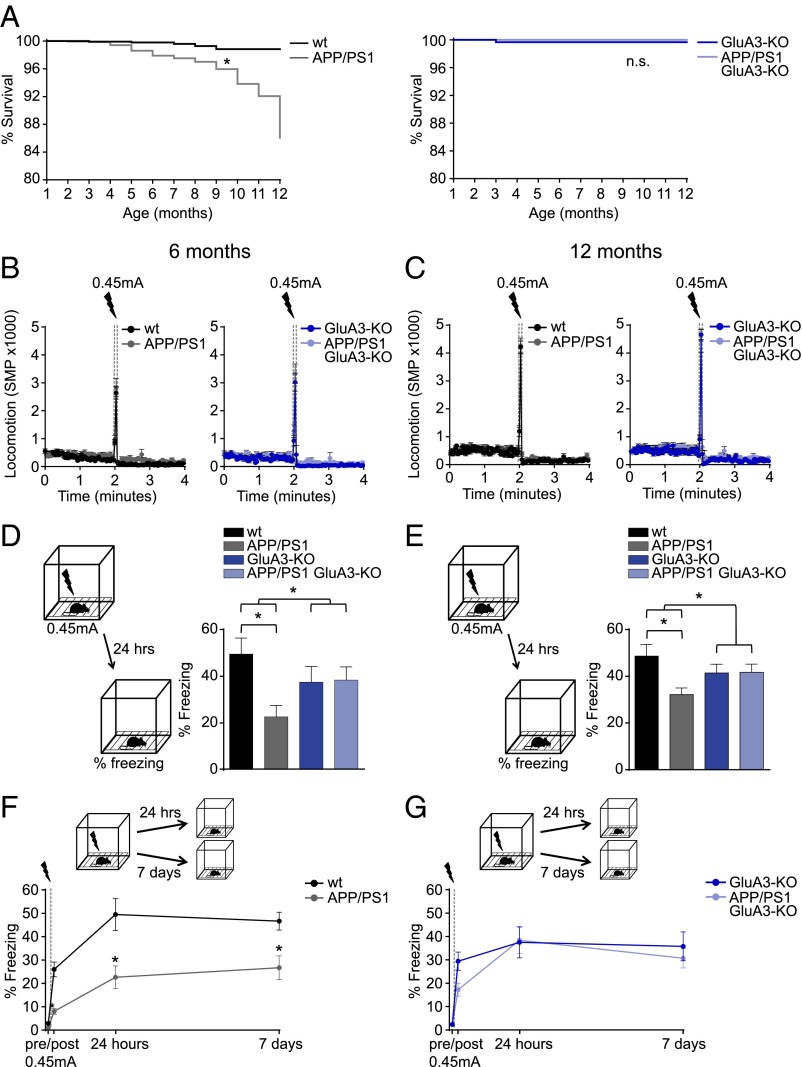
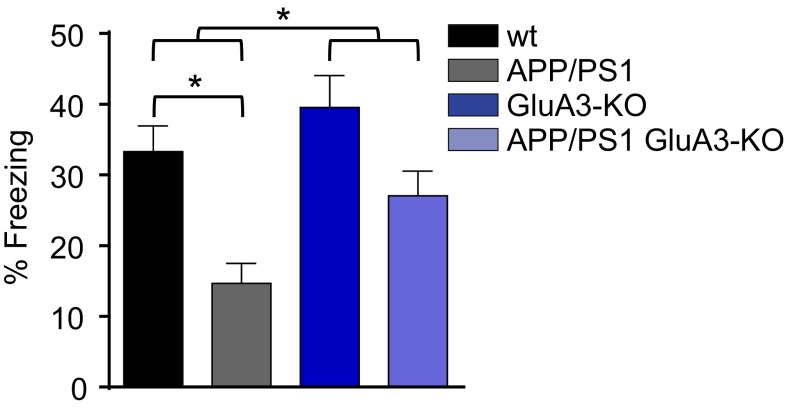
In addition to Aβ plaque and spine pathology, APP/PS1 mice show cognitive deficits and premature mortality. In our colony the survival rate of APP/PS1 mice was lower than that of their WT littermates (P < 0.01). However, GluA3-deficient APP/PS1 mice did not show premature mortality (P = 0.2) (Fig. 6A). We tested the ability to form hippocampus- and amygdala-dependent memories by submitting 6-mo-old and 12-mo-old mice to a contextual fear-conditioning paradigm. Upon exposure to the shock cage, the mice with different genotypes displayed similar locomotor activity in a novel environment and a similar startle response to a mild foot shock (Fig. 6 B and C). When re-exposed to the shock cage 24 h after conditioning, APP/PS1 mice showed impaired fear memories as expressed by a lower level of freezing behavior compared with WT littermate controls at both 6 mo (P = 0.01) (Fig. 6D) and 12 mo of age (P = 0.03) (Fig. 6E). For GluA3-deficient mice, the freezing response to the fearful context was equal whether or not the mice carried APP/PS1 transgenes (P > 0.9) (Fig. 6 D and E). Similar results were obtained when another group of 6-mo-old mice was tested 7 d after conditioning (Fig. 6 F and G), indicating that the long-term stability of contextual fear memories also remained unaffected by APP/PS1 transgenes in the absence of GluA3. GluA3-deficient mice consistently displayed a lower (nonsignificant) memory performance than their WT littermate controls at both age 6 mo (P = 0.7) (Fig. 6D) and age 12 mo (P = 0.6) (Fig. 6E). This lower memory performance was not observed in 3-mo-old mice (Fig. S6). Combined, these findings indicate that GluA3 renders APP/PS1 mice susceptible to memory impairment.
Fig. 6.
APP/PS1 mice do not show increased mortality or memory deficits when they lack GluA3. (A) Kaplan–Meier curves demonstrate that APP/PS1 but not APP/PS1/GluA3-KO mice have increased mortality rates (n = 780 surviving at 1 mo, n = 127 surviving at 12 mo). (B and C) Locomotion is similar before and during (startle response) the foot-shock in the conditioning trial in 6-mo-old (B) and 12-mo-old (C) mice. The automated quantification of motion as the number of significant motion pixels (SMP) was described previously (48). (D and E) Freezing levels during fear-memory retrieval 24 h after conditioning in 6-mo-old littermates (WT, n = 13; APP/PS1, n = 13; GluA3-KO, n = 11; APP/PS1/GluA3-KO, n = 15) (D) and in 12-mo-old littermates (WT, n = 13; APP/PS1, n = 20; GluA3-KO, n = 12; APP/PS1/GluA3-KO, n = 19) (E). (F and G) Freezing responses to the fear context at 24 h (as in D) and in a different group of mice tested 7 d after conditioning (WT, n = 14; APP/PS1, n = 13; GluA3-KO, n = 16; APP/PS1/GluA3-KO, n = 19) showed that the long-term stability of contextual fear memories is unaffected in APP/PS1/GluA3-KO mice. Data are mean ± SEM. Statistics: Mantel–Cox test with Bonferroni correction (A), two-way ANOVA with post hoc Sidak comparisons (D and E), and unpaired t test (F and G). *P < 0.05.
Fig. S6.
Freezing levels during fear-memory retrieval 24 h after conditioning in 3-mo-old littermates (WT, n = 11; APP/PS1, n = 10; GluA3-KO, n = 7; APP/PS1/GluA3-KO, n = 11) show memory impairment in APP/PS1 mice that is not seen in APP/PS1 GluA3-KO mice. Statistics: Two-way ANOVA with post hoc Sidak comparisons. *P < 0.05.
Discussion
We studied the influence of AMPAR subunit composition on Aβ-mediated synapto-toxicity in three different model systems. First we showed that synaptic depression and spine loss in APPCT100-overexpressing CA1 neurons of organotypic slices require GluA3 expression. Second, exogenously added Aβ oligomers block LTP in acutely isolated brain slices of WT mice but not in slices from GluA3-deficient mice. Finally, increased mortality, contextual fear memory deficits, and spine loss are absent in APP/PS1-transgenic mice that lack GluA3. Our data indicate that GluA3-containing AMPARs play a central role in these Aβ-mediated deficits. The increased mortality of APP/PS1 transgenic mice appears to be related to the occurrence of epileptic seizures and not to neurodegeneration (32). It will be interesting to assess whether GluA3 is also required for seizure generation in APP/PS1 mice.
How Aβ oligomers initiate synaptic deficits remains largely unclear. Aβ oligomers have a broad range of binding partners at the surface of neurons (33), and a number of these partners have been proposed to be necessary for inducing pathological effects (10, 34). Although GluA3 may be another candidate Aβ receptor, we consider the possibility that GluA3 is responsible not for the induction but rather for the expression of Aβ-driven synaptic deficits. We propose a model in which Aβ oligomers bind one or a combination of surface receptors, thereby hijacking or facilitating an endogenous NMDAR-dependent signaling cascade that ultimately leads to the selective removal of GluA3-containing AMPAR from synapses. A factor that potentially mediates the depletion of GluA2/3 AMPARs from synapses is PICK1 (protein interacting with C-kinase 1), an adaptor protein that selectively interacts with GluA2 and GluA3. The phosphorylation of the GluA2 or GluA3 c-tail by protein kinase Cα (PKCα) permits PICK1 binding, leading to AMPAR endocytosis (35, 36). Notably, PICK1 and PKCα are necessary for Aβ-mediated synaptic depression to take place (37, 38). The PICK1-dependent removal of AMPARs from the surface by Aβ was shown to be more prominent for GluA2 than for GluA1 (37), suggesting that Aβ oligomers particularly trigger the endocytosis of GluA2/3s. The removal of GluA3-containing receptors by Aβ as a mechanism of action is supported by our finding that AMPAR currents are similarly reduced in neurons lacking GluA3 and in WT neurons expressing APPCT100. (i.e., the mEPSC frequencies and AMPAR/NMDAR ratios are similar). Other effects of Aβ, including synaptic NMDAR depression, spine loss, LTP blockade, memory impairment, and premature mortality, did not fully mimic the lack of GluA3. Possibly these effects require the active removal of GluA3-containing AMPARs and/or GluA3 deficiency is chronic and could allow compensatory mechanisms to ameliorate some of the deficits. Regardless of the mechanisms underlying the partial mimicry, our experiments indicate that the presence of GluA3 is required for these effects to occur.
GluA3-containing AMPARs have been proposed to be involved in the homeostatic scaling of synapse strength (26, 27). In such a scenario, neurons that are deprived of synaptic input increase their synaptic GluA2/3 levels, and, conversely, neurons that are hyperactive counteract by lowering the number of GluA2/3s at synapses. It has recently been suggested that AD-related synaptic and memory deficits may arise from defects in homeostatic plasticity (39, 40). Possibly Aβ oligomers mediate a persistent synaptic downscaling by reducing the levels of GluA2/3s at synapses irrespective of the history of neuronal activity. Alternatively, Aβ oligomers may trigger increased neuronal network activity (41) to which neurons respond by lowering synaptic GluA2/3 levels. However, the consequences of excess deposition of Aβ are not limited to the loss of synaptic AMPAR levels. Our observation that other Aβ-driven effects are not observed in GluA3-deficient mice is consistent with the notion that the removal of AMPARs from synapses is one of the first critical steps in Aβ pathogenesis (15, 16), followed or accompanied by the collateral removal of GluA1/2s and GluN2B-containing NMDARs and the disintegration of the synapse. Possibly GluA2/3s play a role in the stabilization of spine structures, for instance through their interaction with N-cadherins at synapses (42, 43). Alternatively, the endocytosis of GluA3-containing AMPARs may trigger a cellular signal that leads to the dismantling of spine structures. We propose that an intervention in the signaling pathway that is used by Aβ to remove GluA2/3s from synapses may be an attractive approach to prevent all Aβ-driven synaptic and memory deficits.
Lowering the neuronal or synaptic levels of GluA3-containing AMPARs may reduce the vulnerability of neurons to the detrimental effects of oligomeric Aβ. Interestingly, a recent study that screened for gene-expression profiles associated with mild cognitive impairment (MCI), a clinical transitional stage between aging and AD dementia (44), found that among the genes that showed a strong negative correlation with cognitive performance were those encoding the glutamate receptors GluA3 and GluN2B (45). It is tempting to speculate that people with relatively low levels of GluA3 and GluN2B expression are less likely to develop MCI despite the presence of Aβ oligomers. Along these lines, a mentally active brain would theoretically provide a reduced susceptibility for MCI, because learning behavior and sensory experiences trigger the delivery of GluA1-containing AMPARs to synapses (20, 21) and the subsequent homeostatic removal of synaptic GluA2/3s (26, 27). Future experiments may reveal the physiological conditions under which the levels of GluA3 change in neurons and whether differences in the expression levels of GluA3 determine the severity of AD symptoms.
Experimental Procedures
Mice.
GluA3-deficient mice (Gria3tm1Dgen/Mmnc; Mutant Mouse Regional Resource Center, Davis, CA), APPswe/PS1dE9 mice (30) (kindly provided by Elly Hol, University Medical Center, Utrecht, The Netherlands), and Thy1-eYFP mice (B6.Cg-Tg(Thy1-YFP)HJrs/J; Jackson Laboratories) were backcrossed to c57bl6 mice at least six times. GluA1-deficient mice were in a c57bl6/129 hybrid background and were a kind gift from R. Huganir, Johns Hopkins University, Baltimore (46). GluA3 is an X-linked gene; for behavioral experiments only male GluA3−/Y and littermate GluA3+/Y mice were used. For electrophysiology both male GluA3−/Y and GluA3+/Y and female GluA3−/− and GluA3+/+ littermates were used; female GluA3+/− mice were excluded from this study. Mice were kept on a 12-h day-night cycle and had ad libitum access to food and water. All experiments were approved by the Institutional Animal Care and Use Committee of the Royal Netherlands Academy of Arts and Sciences or of the University of California, San Diego.
Organotypic and Acute Hippocampal Slices.
Organotypic hippocampal slices were prepared from postnatal day 7–8 mice as described previously (47) and were used after 7–12 d in culture for electrophysiology or after 13–15 d in culture for spine analysis. Constructs of APP-CT100+tdTomato and APP-CT84+tdTomato were cloned into a pSinRep5 shuttle vector, and infective Sindbis pseudo viruses were produced according to the manufacturer’s protocol (Invitrogen BV). Acute hippocampal slices were prepared from 3- to 4-wk-old mice. Slices were cut coronally in cold sucrose cutting buffer (72 mM sucrose, 22 mM glucose, 2.6 mM NaHCO3, 83 mM NaCl, 2.5 mM KCl, 3.3 mM MgSO4, and 0.5 mM CaCl2) at a thickness of 350 μm and were transferred to a recovery chamber containing oxygenated artificial cerebrospinal fluid (ACSF) containing 11 mM glucose, 1 mM MgCl2, and 2 mM CaCl2. Slices were maintained at 34 °C for 45 min and then at room temperature for 45 min.
Preparation of Aβ Oligomers.
CHO cells stably transfected with the APP751(V717F) mutation, referred to as “7PA2 cells” (29), were a gift from Edward Koo, Department of Neurosciences, University of California, San Diego, La Jolla, CA. 7PA2 cells or control CHO cells were cultured in DMEM containing 10% (wt/vol) bovine FCS, were grown to near confluence, and then were cultured in plain DMEM for 16 h. The Aβ medium was collected, centrifuged at 200 × g for 10 min, and concentrated 10-fold using an Amicon Ultra 3k filtration device at 4,000 × g for 30 min at 4 °C. Levels of Aβ40 and Aβ42 oligomers were measured by ELISA. 7PA2-conditioned medium was diluted to 1 nM total Aβ, and CHO-conditioned medium from the same batch was diluted similarly. Western blots were used to confirm the presence of Aβ oligomers.
Electrophysiology.
Organotypic hippocampal slices were perfused with ACSF (in mM: 118 NaCl, 2.5 KCl, 26 NaHCO3, 1 NaH2PO4, 4 MgCl2, 4 CaCl2, and 20 glucose) gassed with 95%O2/5%CO2. Whole-cell recordings were made with 3- to 5-MΩ pipettes (Raccess <20 MΩ, and Rinput >10× Raccess) filled with internal solution containing (in mM) 115 CsMeSO3, 20 CsCl, 10 Hepes, 2.5 MgCl2, 4 Na2-ATP, 0.4 Na-GTP, 10 Na-Phosphocreatine, and 0.6 EGTA. mEPSCs were recorded at −60 mV with 1 μM TTX and 50 μM picrotoxin added to the bath. For evoked recordings, a cut was made between CA1 and CA3, and 50 μM picrotoxin and 4 μM 2-chloroadenosine (Tocris) were added to the bath. Two stimulating electrodes (two-contact Pt/Ir cluster electrodes; FHC), were placed between 100 and 300 μm down the apical dendrite, 100 μm apart, and 200 μm laterally in opposite directions. AMPAR-mediated EPSCs were measured as the peak inward current at −60 mV. NMDAR-mediated EPSCs were measured as the mean outward current between 40 and 90 ms after the stimulation at +40 mV, corrected by the current at 0 mV. EPSC amplitudes were obtained from an average of at least 40 sweeps at each holding potential. Data were acquired using a Multiclamp 700B amplifier (Molecular Devices). Evoked recordings were analyzed using custom software written in Igor Pro (WaveMetrics). mEPSC recordings were analyzed with the Mini Analysis program (Synaptosoft) with an amplitude threshold of 5 pA. For LTP recordings, acute slices were transferred to a recording chamber, where they were submerged and received a continuous flow of ACSF supplemented with 11 mM glucose, 1 mM MgCl2, 2 mM CaCl2, and 100 μM picrotoxin (pH 7.4). Extracellular field potentials were recorded in the SR with glass electrodes (1.5–2.5 MΩ) containing ACSF. Field excitatory postsynaptic potentials (fEPSPs) were evoked by stimulating independent afferents by placing bipolar stimulation electrodes 150 μm down the apical dendrites and 150–200 μm laterally in opposite directions. Aβ or control medium was added to the perfusion for 20 min during the acquisition of a stable baseline before LTP induction. LTP was induced by applying four trains of electrical stimulation at 100 Hz, each lasting 100 ms, at 20-s intervals. After LTP induction, fEPSPs were recorded for an additional 60 min. An averaged normalized fEPSP for the last 10 min of each recording (50–60 min after LTP induction) was used to quantify the potentiation value. Experimenters were blind to experimental conditions.
Dendritic Spine Analysis in Organotypic Hippocampal Slices.
3D images were collected by two-photon laser scanning microscopy (Femtonics Ltd.) with a Ti:sapphire laser (Chameleon; Coherent) tuned at 910 nm. Optical z-sections were captured every 0.75 μm of apical dendrites, ∼180 μm from the cell body. The density and diameter of spines protruding in the horizontal (x/y) plane were manually quantified from projections of stacked 3D images by an experimenter blind to experimental conditions and genotype using ImageJ software (fiji.sc).
Aβ Plaque Load and Spine Analysis in APP/PS1 Mice.
Mice were anesthetized with pentobarbital and perfused with 20 mL 0.1 M PBS followed by 80 mL of fixative (4% paraformaldehyde in 0.1 M PBS, pH 7.2). Brains were removed, postfixed for 1 h in fixative, and washed in PBS.
For plaque load analysis brains were kept in 20% (wt/vol) sucrose overnight, snap-frozen in dry-ice, and stored at −80 °C. The brains were sliced into 10-μm sections on a Leica CM3050S cryostat and thaw-mounted onto microscope slides. Epitope retrieval was achieved by incubating the slides in a sodium citrate buffer (10 mM sodium citrate, 0.05% Tween-20, pH 6.0) at 95 °C. The sections were washed in PBS, incubated in blocking solution [10% (wt/vol) normal donkey serum, 0.4% Triton X-100 in PBS] for 1 h, and subsequently incubated with the 6E10 antibody (1:15,000 dilution; SIG-39320; Covance) overnight at room temperature in blocking solution, washed in PBS, and incubated with Cy3-conjugated donkey anti-mouse IgG in PBS (1:1,400; Jackson ImmunoResearch) for 2 h at room temperature. Sections were washed in PBS and covered with VECTASHIELD mounting medium with DAPI (Vector Labs). Images of the CA1 (magnification, 10×; pixel size, 1,392 × 1,040, 0.65 μm2) were obtained using a fluorescence microscope (Leica DM-RE). Eight images per animal were acquired by experimenters blind to experimental conditions and were analyzed with Image-Pro Plus software (Media Cybernetics). The level of plaque area was expressed as the percentage of positive pixels. Slices from WT and GluA3-KO littermates were included as negative controls (Fig. S5A).
For spine analysis coronal 50-μm-thick slices were prepared from the fixed brains of Thy1-eYFP mice with a vibratome (Leica) and were mounted with VECTASHIELD medium (Vector Labs). Z-stack images of oblique apical dendrites were obtained with a Leica SP5 II confocal microscope. Laser power was adjusted to achieve similar fluorescence levels across images. Spine density and spine size were manually quantified by an experimenter blind to experimental conditions and genotype using ImageJ software (fiji.sc). Spine size was determined by measuring spine head diameters, because diameter measurements were largely independent of fluorescence intensity levels (Fig. S5C).
Contextual Fear-Conditioning Behavioral Assay.
Male mice (GluA3-/Y) were placed in a box 29 cm high × 31.5 cm wide × 23 cm deep with a grid floor of stainless steel bars (Med Associates Inc.) inside a sound-attenuating chamber for 4 min. After 2 min a shock (0.45 mA, 2 s) was delivered through the floor. Each trial took place between 1:00 and 4:00 PM during the light cycle. Freezing behavior and locomotion were quantified using a custom-made Matlab script (48). Absence of movement for at least 1 s was considered as freezing. Experimenters were blind to the genotypes of the mice.
Statistical Analysis.
The Kolmogorov–Smirnov test (K–S) was used to test whether datasets were normally distributed. The F-test was used to test equal variance. Where necessary, data were log- or square root-transformed to obtain normal distributions and homogeneity of variance. Significance was determined using two-tailed Student t tests to compare two groups. Two-way ANOVA followed by post hoc Sidak comparisons were used when two independent variables (i.e., genotype and the expression/presence of Aβ) were measured. The K–S tests on the cumulative distributions were done on data normalized to the group mean, allowing the comparison of distributions independent of a difference in mean. A Mantel–Cox test with Bonferroni correction was used to compare mortality rates. P values below 0.05 were considered statistically significant.
Acknowledgments
We thank Prof. Dr. Ed Koo for providing Aβ-oligomer samples and Prof. Elly Hol and Dr. Willem Kamphuis for their expert advice. This work was supported by The Netherlands Organization for Scientific Research (H.W.K.), The Netherlands Organization for Health Research and Development (H.W.K.), the Alzheimer's Association (H.W.K.), the Internationale Stichting Alzheimer Onderzoek (H.W.K.), the Marcos-Shiley Endowment in Honor of Leon Thal (R.M.), and NIH Grants MH049159 and AG032132 (to R.M.).
Footnotes
Conflict of interest statement: R.L.H. has supplied critical reagents and has therefore appeared as a coauthor on a paper from R.M.'s lab published as ref. 37.
This article contains supporting information online at www.pnas.org/lookup/suppl/doi:10.1073/pnas.1614249113/-/DCSupplemental.
References
- 1.Brown DF, et al. Neocortical synapse density and Braak stage in the Lewy body variant of Alzheimer disease: A comparison with classic Alzheimer disease and normal aging. J Neuropathol Exp Neurol. 1998;57(10):955–960. doi: 10.1097/00005072-199810000-00007. [DOI] [PubMed] [Google Scholar]
- 2.Scheff SW, Price DA, Schmitt FA, Mufson EJ. Hippocampal synaptic loss in early Alzheimer’s disease and mild cognitive impairment. Neurobiol Aging. 2006;27(10):1372–1384. doi: 10.1016/j.neurobiolaging.2005.09.012. [DOI] [PubMed] [Google Scholar]
- 3.Lambert MP, et al. Diffusible, nonfibrillar ligands derived from Abeta1-42 are potent central nervous system neurotoxins. Proc Natl Acad Sci USA. 1998;95(11):6448–6453. doi: 10.1073/pnas.95.11.6448. [DOI] [PMC free article] [PubMed] [Google Scholar]
- 4.Lesné S, et al. A specific amyloid-beta protein assembly in the brain impairs memory. Nature. 2006;440(7082):352–357. doi: 10.1038/nature04533. [DOI] [PubMed] [Google Scholar]
- 5.McLean CA, et al. Soluble pool of Abeta amyloid as a determinant of severity of neurodegeneration in Alzheimer’s disease. Ann Neurol. 1999;46(6):860–866. doi: 10.1002/1531-8249(199912)46:6<860::aid-ana8>3.0.co;2-m. [DOI] [PubMed] [Google Scholar]
- 6.Shankar GM, et al. Amyloid-beta protein dimers isolated directly from Alzheimer’s brains impair synaptic plasticity and memory. Nat Med. 2008;14(8):837–842. doi: 10.1038/nm1782. [DOI] [PMC free article] [PubMed] [Google Scholar]
- 7.Kamenetz F, et al. APP processing and synaptic function. Neuron. 2003;37(6):925–937. doi: 10.1016/s0896-6273(03)00124-7. [DOI] [PubMed] [Google Scholar]
- 8.Lacor PN, et al. Abeta oligomer-induced aberrations in synapse composition, shape, and density provide a molecular basis for loss of connectivity in Alzheimer’s disease. J Neurosci. 2007;27(4):796–807. doi: 10.1523/JNEUROSCI.3501-06.2007. [DOI] [PMC free article] [PubMed] [Google Scholar]
- 9.Walsh DM, et al. Naturally secreted oligomers of amyloid beta protein potently inhibit hippocampal long-term potentiation in vivo. Nature. 2002;416(6880):535–539. doi: 10.1038/416535a. [DOI] [PubMed] [Google Scholar]
- 10.Mucke L, Selkoe DJ. Neurotoxicity of amyloid β-protein: Synaptic and network dysfunction. Cold Spring Harb Perspect Med. 2012;2(7):a006338. doi: 10.1101/cshperspect.a006338. [DOI] [PMC free article] [PubMed] [Google Scholar]
- 11.Kessels HW, Nabavi S, Malinow R. Metabotropic NMDA receptor function is required for β-amyloid-induced synaptic depression. Proc Natl Acad Sci USA. 2013;110(10):4033–4038. doi: 10.1073/pnas.1219605110. [DOI] [PMC free article] [PubMed] [Google Scholar]
- 12.Shankar GM, et al. Natural oligomers of the Alzheimer amyloid-beta protein induce reversible synapse loss by modulating an NMDA-type glutamate receptor-dependent signaling pathway. J Neurosci. 2007;27(11):2866–2875. doi: 10.1523/JNEUROSCI.4970-06.2007. [DOI] [PMC free article] [PubMed] [Google Scholar]
- 13.Wei W, et al. Amyloid beta from axons and dendrites reduces local spine number and plasticity. Nat Neurosci. 2010;13(2):190–196. doi: 10.1038/nn.2476. [DOI] [PMC free article] [PubMed] [Google Scholar]
- 14.Snyder EM, et al. Regulation of NMDA receptor trafficking by amyloid-beta. Nat Neurosci. 2005;8(8):1051–1058. doi: 10.1038/nn1503. [DOI] [PubMed] [Google Scholar]
- 15.Hsieh H, et al. AMPAR removal underlies Abeta-induced synaptic depression and dendritic spine loss. Neuron. 2006;52(5):831–843. doi: 10.1016/j.neuron.2006.10.035. [DOI] [PMC free article] [PubMed] [Google Scholar]
- 16.Miyamoto T, Kim D, Knox JA, Johnson E, Mucke L. Increasing the receptor tyrosine kinase EphB2 prevents amyloid-β-induced depletion of cell surface glutamate receptors by a mechanism that requires the PDZ-binding motif of EphB2 and neuronal activity. J Biol Chem. 2016;291(4):1719–1734. doi: 10.1074/jbc.M115.666529. [DOI] [PMC free article] [PubMed] [Google Scholar]
- 17.Kessels HW, Kopec CD, Klein ME, Malinow R. Roles of stargazin and phosphorylation in the control of AMPA receptor subcellular distribution. Nat Neurosci. 2009;12(7):888–896. doi: 10.1038/nn.2340. [DOI] [PMC free article] [PubMed] [Google Scholar]
- 18.Wenthold RJ, Petralia RS, Blahos J II, Niedzielski AS. Evidence for multiple AMPA receptor complexes in hippocampal CA1/CA2 neurons. J Neurosci. 1996;16(6):1982–1989. doi: 10.1523/JNEUROSCI.16-06-01982.1996. [DOI] [PMC free article] [PubMed] [Google Scholar]
- 19.Hayashi Y, et al. Driving AMPA receptors into synapses by LTP and CaMKII: Requirement for GluR1 and PDZ domain interaction. Science. 2000;287(5461):2262–2267. doi: 10.1126/science.287.5461.2262. [DOI] [PubMed] [Google Scholar]
- 20.Mitsushima D, Ishihara K, Sano A, Kessels HW, Takahashi T. Contextual learning requires synaptic AMPA receptor delivery in the hippocampus. Proc Natl Acad Sci USA. 2011;108(30):12503–12508. doi: 10.1073/pnas.1104558108. [DOI] [PMC free article] [PubMed] [Google Scholar]
- 21.Rumpel S, LeDoux J, Zador A, Malinow R. Postsynaptic receptor trafficking underlying a form of associative learning. Science. 2005;308(5718):83–88. doi: 10.1126/science.1103944. [DOI] [PubMed] [Google Scholar]
- 22.Adamczyk A, et al. GluA3-deficiency in mice is associated with increased social and aggressive behavior and elevated dopamine in striatum. Behav Brain Res. 2012;229(1):265–272. doi: 10.1016/j.bbr.2012.01.007. [DOI] [PMC free article] [PubMed] [Google Scholar]
- 23.Humeau Y, et al. A pathway-specific function for different AMPA receptor subunits in amygdala long-term potentiation and fear conditioning. J Neurosci. 2007;27(41):10947–10956. doi: 10.1523/JNEUROSCI.2603-07.2007. [DOI] [PMC free article] [PubMed] [Google Scholar]
- 24.Lu W, et al. Subunit composition of synaptic AMPA receptors revealed by a single-cell genetic approach. Neuron. 2009;62(2):254–268. doi: 10.1016/j.neuron.2009.02.027. [DOI] [PMC free article] [PubMed] [Google Scholar]
- 25.Meng Y, Zhang Y, Jia Z. Synaptic transmission and plasticity in the absence of AMPA glutamate receptor GluR2 and GluR3. Neuron. 2003;39(1):163–176. doi: 10.1016/s0896-6273(03)00368-4. [DOI] [PubMed] [Google Scholar]
- 26.Makino H, Malinow R. Compartmentalized versus global synaptic plasticity on dendrites controlled by experience. Neuron. 2011;72(6):1001–1011. doi: 10.1016/j.neuron.2011.09.036. [DOI] [PMC free article] [PubMed] [Google Scholar]
- 27.Rial Verde EM, Lee-Osbourne J, Worley PF, Malinow R, Cline HT. Increased expression of the immediate-early gene arc/arg3.1 reduces AMPA receptor-mediated synaptic transmission. Neuron. 2006;52(3):461–474. doi: 10.1016/j.neuron.2006.09.031. [DOI] [PMC free article] [PubMed] [Google Scholar]
- 28.Matsuzaki M, et al. Dendritic spine geometry is critical for AMPA receptor expression in hippocampal CA1 pyramidal neurons. Nat Neurosci. 2001;4(11):1086–1092. doi: 10.1038/nn736. [DOI] [PMC free article] [PubMed] [Google Scholar]
- 29.Podlisny MB, et al. Aggregation of secreted amyloid beta-protein into sodium dodecyl sulfate-stable oligomers in cell culture. J Biol Chem. 1995;270(16):9564–9570. doi: 10.1074/jbc.270.16.9564. [DOI] [PubMed] [Google Scholar]
- 30.Savonenko A, et al. Episodic-like memory deficits in the APPswe/PS1dE9 mouse model of Alzheimer’s disease: Relationships to beta-amyloid deposition and neurotransmitter abnormalities. Neurobiol Dis. 2005;18(3):602–617. doi: 10.1016/j.nbd.2004.10.022. [DOI] [PubMed] [Google Scholar]
- 31.Šišková Z, et al. Dendritic structural degeneration is functionally linked to cellular hyperexcitability in a mouse model of Alzheimer’s disease. Neuron. 2014;84(5):1023–1033. doi: 10.1016/j.neuron.2014.10.024. [DOI] [PubMed] [Google Scholar]
- 32.Scharfman HE. “Untangling” Alzheimer’s disease and epilepsy. Epilepsy Curr. 2012;12(5):178–183. doi: 10.5698/1535-7511-12.5.178. [DOI] [PMC free article] [PubMed] [Google Scholar]
- 33.Rahman MM, Zetterberg H, Lendel C, Härd T. Binding of human proteins to amyloid-β protofibrils. ACS Chem Biol. 2015;10(3):766–774. doi: 10.1021/cb5008663. [DOI] [PubMed] [Google Scholar]
- 34.Benilova I, Karran E, De Strooper B. The toxic Aβ oligomer and Alzheimer’s disease: An emperor in need of clothes. Nat Neurosci. 2012;15(3):349–357. doi: 10.1038/nn.3028. [DOI] [PubMed] [Google Scholar]
- 35.Kim CH, Chung HJ, Lee HK, Huganir RL. Interaction of the AMPA receptor subunit GluR2/3 with PDZ domains regulates hippocampal long-term depression. Proc Natl Acad Sci USA. 2001;98(20):11725–11730. doi: 10.1073/pnas.211132798. [DOI] [PMC free article] [PubMed] [Google Scholar]
- 36.Terashima A, et al. An essential role for PICK1 in NMDA receptor-dependent bidirectional synaptic plasticity. Neuron. 2008;57(6):872–882. doi: 10.1016/j.neuron.2008.01.028. [DOI] [PMC free article] [PubMed] [Google Scholar]
- 37.Alfonso S, et al. Synapto-depressive effects of amyloid beta require PICK1. Eur J Neurosci. 2014;39(7):1225–1233. doi: 10.1111/ejn.12499. [DOI] [PMC free article] [PubMed] [Google Scholar]
- 38.Alfonso SI, et al. Gain-of-function mutations in protein kinase Cα (PKCα) may promote synaptic defects in Alzheimer’s disease. Sci Signal. 2016;9(427):ra47. doi: 10.1126/scisignal.aaf6209. [DOI] [PMC free article] [PubMed] [Google Scholar]
- 39.Megill A, et al. Defective age-dependent metaplasticity in a mouse model of Alzheimer’s disease. J Neurosci. 2015;35(32):11346–11357. doi: 10.1523/JNEUROSCI.5289-14.2015. [DOI] [PMC free article] [PubMed] [Google Scholar]
- 40.Jang SS, Chung HJ. Emerging link between Alzheimer’s disease and homeostatic synaptic plasticity. Neural Plast. 2016;2016:7969272. doi: 10.1155/2016/7969272. [DOI] [PMC free article] [PubMed] [Google Scholar]
- 41.Verret L, et al. Inhibitory interneuron deficit links altered network activity and cognitive dysfunction in Alzheimer model. Cell. 2012;149(3):708–721. doi: 10.1016/j.cell.2012.02.046. [DOI] [PMC free article] [PubMed] [Google Scholar]
- 42.Saglietti L, et al. Extracellular interactions between GluR2 and N-cadherin in spine regulation. Neuron. 2007;54(3):461–477. doi: 10.1016/j.neuron.2007.04.012. [DOI] [PubMed] [Google Scholar]
- 43.Silverman JB, et al. Synaptic anchorage of AMPA receptors by cadherins through neural plakophilin-related arm protein AMPA receptor-binding protein complexes. J Neurosci. 2007;27(32):8505–8516. doi: 10.1523/JNEUROSCI.1395-07.2007. [DOI] [PMC free article] [PubMed] [Google Scholar]
- 44.Boyle PA, Wilson RS, Aggarwal NT, Tang Y, Bennett DA. Mild cognitive impairment: Risk of Alzheimer disease and rate of cognitive decline. Neurology. 2006;67(3):441–445. doi: 10.1212/01.wnl.0000228244.10416.20. [DOI] [PubMed] [Google Scholar]
- 45.Berchtold NC, et al. Brain gene expression patterns differentiate mild cognitive impairment from normal aged and Alzheimer’s disease. Neurobiol Aging. 2014;35(9):1961–1972. doi: 10.1016/j.neurobiolaging.2014.03.031. [DOI] [PMC free article] [PubMed] [Google Scholar]
- 46.Kim CH, et al. Persistent hippocampal CA1 LTP in mice lacking the C-terminal PDZ ligand of GluR1. Nat Neurosci. 2005;8(8):985–987. doi: 10.1038/nn1432. [DOI] [PubMed] [Google Scholar]
- 47.Stoppini L, Buchs PA, Muller D. A simple method for organotypic cultures of nervous tissue. J Neurosci Methods. 1991;37(2):173–182. doi: 10.1016/0165-0270(91)90128-m. [DOI] [PubMed] [Google Scholar]
- 48.Kopec CD, et al. A robust automated method to analyze rodent motion during fear conditioning. Neuropharmacology. 2007;52(1):228–233. doi: 10.1016/j.neuropharm.2006.07.028. [DOI] [PubMed] [Google Scholar]


