Significance
Chromatin is one of the most critical structures within the cell because it houses most genetic information. Its structure is well understood at the nucleosomal (<20-nm) and chromosomal (>200-nm) levels; however, due to the lack of quantitative imaging modalities to study this organization, little is known about the higher-order structure between these length scales in live cells. We present a label-free technique, live-cell partial-wave spectroscopic (PWS) microscopy, with sensitivity to structures between 20 and 200 nm that can quantify the nanoarchitecture in live cells. With this technique, we can detect DNA fragmentation and expand on the link between metabolic function and higher-order chromatin structure. Live-cell PWS allows high-throughput study of the relationship between nanoscale organization and molecular function.
Keywords: chromatin, microscopy, DNA damage, mitochondrial metabolism, cell dynamics
Abstract
The organization of chromatin is a regulator of molecular processes including transcription, replication, and DNA repair. The structures within chromatin that regulate these processes span from the nucleosomal (10-nm) to the chromosomal (>200-nm) levels, with little known about the dynamics of chromatin structure between these scales due to a lack of quantitative imaging technique in live cells. Previous work using partial-wave spectroscopic (PWS) microscopy, a quantitative imaging technique with sensitivity to macromolecular organization between 20 and 200 nm, has shown that transformation of chromatin at these length scales is a fundamental event during carcinogenesis. As the dynamics of chromatin likely play a critical regulatory role in cellular function, it is critical to develop live-cell imaging techniques that can probe the real-time temporal behavior of the chromatin nanoarchitecture. Therefore, we developed a live-cell PWS technique that allows high-throughput, label-free study of the causal relationship between nanoscale organization and molecular function in real time. In this work, we use live-cell PWS to study the change in chromatin structure due to DNA damage and expand on the link between metabolic function and the structure of higher-order chromatin. In particular, we studied the temporal changes to chromatin during UV light exposure, show that live-cell DNA-binding dyes induce damage to chromatin within seconds, and demonstrate a direct link between higher-order chromatin structure and mitochondrial membrane potential. Because biological function is tightly paired with structure, live-cell PWS is a powerful tool to study the nanoscale structure–function relationship in live cells.
Every cellular and extracellular structure has a complex nanoscale organization ranging from individual macromolecules that are a few nanometers in size (e.g., protein and DNA) to macromolecular assemblies that are tens to hundreds of nanometers in size (e.g., cell membranes, higher-order chromatin structure, cytoskeleton, and extracellular matrix fibers). A major scientific challenge is to understand these macromolecular structures, specifically their function and interactions in structurally and dynamically complex living cellular systems. To meet these goals, the ideal live-cell imaging technology would satisfy six key requirements: being (i) nanoscale sensitive (<200 nm), (ii) label free, (iii) nonperturbing, (iv) quantitative, (v) high throughput, and (vi) molecularly informative.
Current approaches are unable to meet all of these criteria alone. The breakthroughs in superresolution fluorescence microscopy (SRM) have enabled new imaging technologies capable of providing unprecedented molecular identification at the highest resolutions currently available in live cells, but require the use of exogenous fluorophores to visualize macromolecular structures (1–3). For some applications, these labels are indispensable to achieve molecular specificity. However, there are significant drawbacks to the exclusive use of molecular labels for studies of cellular structure and function. Exclusively label-based SRM approaches are limited by the number of possible imaging channels, by the high label densities required, by the high light intensities used during imaging, and by the introduction of possible artifacts due to the labels themselves, especially at the high densities required for nanoscale resolution (4, 5). In the study of macromolecular organization, current imaging approaches have significant drawbacks as macromolecular structures are often composed of dozens to hundreds of distinct molecules and often include different subtypes such as lipids, proteins, nucleic acids, and carbohydrates, some of which are difficult to directly label. Due to these limitations, phase contrast microscopy is still the most widely used label-free imaging modality for live-cell experiments. Although this technique is fast and improves contrast to visualize live cells, its diffraction-limited resolution cannot provide any insights into the macromolecular nanoarchitecture. As such, currently no label-free optical technique exists to measure the nanoarchitectural properties of live cells below the diffraction limit.
One prominent area of biological research with a demonstrated need for label-free, nanoscale-sensitive imaging is the investigation of the structure–function relationship of chromatin. Chromatin organization (which is comprised of DNA, histones, and hundreds of other conjugated proteins and small molecules such as RNA) involves a hierarchy of length scales ranging from 10 nm in nucleosomes to hundreds of nanometers for chromosomal territories (6, 7). The physical nanostructure of chromatin is regulated by numerous molecular factors, including the primary DNA sequence composition, differential methylation patterns, histone modifications, polycomb and cohesin protein complexes, RNA and DNA polymerases, long noncoding RNA, etc., and nonmolecular factors, such as crowding, ionic conditions, and pH. Due to this complexity and the lack of existing optical techniques that can rapidly sample information below 200 nm, little is known about the higher-order chromatin structure at length scales between 10 and 200 nm or their dynamics in live cells (e.g., the folding structure of chromatin above that of mononucleosomes). Results from fixed-cell–imaging techniques, such as electron microscopy or SRM, have shown that chromatin between 20 and 200 nm is first organized into polynucleosomal 10-nm fibers, and in certain conditions, these fibers have been shown to assemble into 30-nm clusters (8–10), although the existence of the 30-nm fiber is a subject of an active debate. At length scales between 100 and 200 nm, recent work using SRM has shown a power-law (fractal) relation in the organization of chromatin, with domains of highly dense, inactive chromatin localizing within a few hundred nanometers of transcriptionally active sites (11). Furthermore, in vitro studies using texture analysis of microscopy images have shown that the topology of chromatin is well represented as a fractal media (12). Likewise, ex vivo analysis of somatic copy number alterations and neutron scattering measurements of isolated nuclei have shown that, across these length scales, chromatin is well described as a fractal media (13–15). In conjunction, molecular techniques such as chromosomal capture methods [chromosome conformation capture (3C) and high-throughput 3C (Hi-C)] have shown that the higher-order organization of chromatin above single nucleosomes and below the structure of chromosomal territories follows this same power-law fractal organization. These methods have shown that topology of this higher-order organization is correlated with the regulation of gene transcription (16–18) and capable of evolving rapidly under stress conditions to globally regulate the expression of genes (19). Critically, these observed changes in chromatin structure have recently been linked to the regulation of genes often implicated in oncogenesis (20).
In cancer, it is increasingly clear that changes in chromatin topology at all length scales are a critical determinant of tumor formation, aggressiveness, and chemoresistance. One of the primary features of tumorigenesis is a shift in the fractal physical organization of chromatin, correlating both with the formation of tumors and their invasiveness. In early carcinogenesis, we have previously applied a fixed-cell–imaging technique, partial-wave spectroscopic (PWS) microscopy and transmission electron microscopy (TEM), to detect physical changes in the chromatin nanoarchitecture, indicating that the topology of chromatin is a critical component in cellular function at the earliest stages of tumor formation (21). PWS microscopy allows examination of the intracellular organization concealed by the diffraction limit with length scale sensitivity in the range of 20–200 nm, the range at which existing label-free live-cell imaging techniques are deficient, due to the relationship between the nanoscale spatial variations of macromolecular density and the resulting variance in the spectrum of backscattered light (22, 23). The novelty is grounded in a previously overlooked difference between resolution and detectability. Although subdiffractional structures are not resolved by PWS, they are still detected by analyzing the spectrum of elastically scattered light to provide quantitative contrast. This capability is rooted in the principle that, whereas structures below the diffraction limit cannot be resolved, structures at all length scales within a sample, larger or smaller than the focused spot size, will scatter light. Moreover, the amount of light a particle scatters depends on the size of the particle and not on the focused spot size. Hence, particles smaller than the diffraction limit of light cannot be visualized, yet their presence and organization can be sensed by analyzing the light they scatter.
In this work, we set out to create a label-free live-cell microscopy method based on interference principles used in PWS cytology, thereby creating a tool to directly study the dynamic nanoscale topology of live cells, with a specific focus on studying real-time changes in chromatin organization. We sought to develop an ideal extension of PWS in live cells that would (i) provide nanoscale sensitivity to structures between 20 and 200 nm, (ii) use label-free contrast to capture nanoscopic information, (iii) be nonperturbing to biological samples by using low-power illumination and label-free contrast, (iv) quantify the cellular nanoarchitecture, and (v) rapidly capture the temporal evolution of nanoscale structures, providing contrast in multiple cells in seconds. For studies aimed at understanding the overall structure–function relationship in eukaryotic cells, using SRM approaches alone would not be suitable. The power of live-cell PWS is its unique ability to work in conjunction with existing label-based technologies to provide the structural context for molecular interactions, thereby greatly expanding our understanding of the molecular behavior in live cells (24). With this approach, we demonstrate the ability to measure the nanoarchitecture in live cells in seconds. Specifically, we explore changes to the cellular nanoarchitecture due to UV light exposure, show that live-cell DNA-binding dyes transform chromatin within seconds, and demonstrate a direct link between higher-order chromatin structure and mitochondrial membrane potential.
Results and Discussion
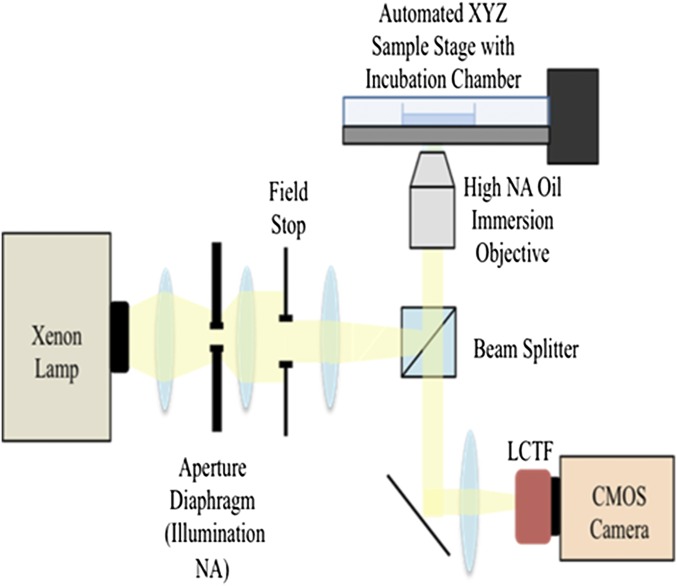
The live-cell PWS instrument is built into a commercial inverted microscope equipped with a broadband illumination and a tunable spectral collection filter (Fig. S1). With this configuration, the live-cell instrument uses the glass–cell interface to produce the requisite interference signal that allows for the study of underlying nanoscale structure. In brief, the spatial fluctuations of refractive index (RI) produced by the macromolecular density distribution cause backscattering of incident light waves from the sample. Optical interference of the backpropagating light results in wavelength-dependent fluctuations in the acquired spectrally resolved microscope image. The standard deviation of these spectra (Σ) quantifies the internal structure of the sample with nanometer sensitivity (22, 23). In cells, there are numerous variations in macromolecular density due to the spatial organization of macromolecules. Quantification of this nanomolecular density distribution is given by the statistical parameter, Σ, at each diffraction-limited pixel (22, 23).
Fig. S1.
Schematic diagram of the live-cell PWS microscope. The live-cell PWS microscope was built onto a commercial Leica DMIRB microscope equipped with a broadband illumination source (xenon lamp or an LED). Monochromatic spectral collection was performed using a LCTF and a camera to yield a 3D image cube containing spatial coordinates and spectral information.
Σ, and the disorder strength (Ld, which is Σ normalized by sample thickness), are proportional to two crucial characteristics of molecular organization at deeply subdiffractional length scales: the characteristic length scale of macromolecular organization (Lc), and the standard deviation (δn) of the density (22, 23). In a fractal media, such as chromatin, the characteristic length scale of macromolecules can be alternatively evaluated through the fractal dimension, D, which is proportional to Σ. Thus, Σ measured from chromatin senses nanoscale changes in its fractal organization. Critically, increase in heterogeneity (i.e., differential compaction) within chromatin by definition produces an increase in D, δn, or Lc. This relation is derived from the properties of fractal media with conserved mass and volume—as compaction increases locally, the variations in mass density (heterogeneity) must also increase. Previous molecular dynamics simulations have further confirmed that increases in δn*Lc correspond to an increase in macromolecular compaction, and experimental results have shown that this increase within the nucleus quantitatively describes an increase in chromatin heterogeneity (21, 25, 26).
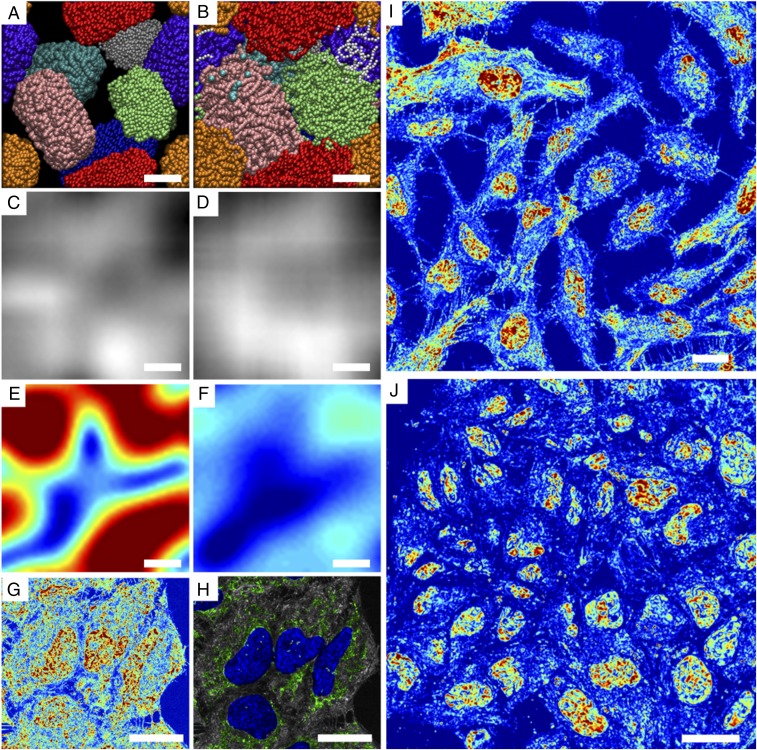
As a representation of the nanoscopic topology detected by live-cell PWS, we used as a model 10-nm “beads on a string” chromatin fibers (Fig. 1 A and B) as has been previously described by Kim et al. (26). In this model, we consider changes in the nanoscopic structure of higher-order chromatin that have the same nanoscopic average mass density but have starkly different nanoscale organization: differentially compacted (Fig. 1A) and diffusely compacted (Fig. 1B) DNA fibers. In both cases, images produced from conventional light microscopy techniques cannot capture information about the nanoscale topology of these differential states (Fig. 1 C and D). Likewise, although PWS cannot resolve the structures directly, it provides information about their subdiffractional organization. To demonstrate sensitivity to these structures, Σ is computed directly as described by the work of Cherkezyan et al. (22, 23) accounting for the physical properties of the live-cell system. As is shown in Fig. 1E, differentially compacted chromatin (Fig. 1A) produces a much higher Σ than diffusely compacted chromatin (Fig. 1F). Consequently, regions that result in high Σ in live cells would be the heterogeneous, differentially compacted regions likely resulting from the formation of local heterochromatin domains neighboring decompacted euchromatin (Fig. 1A). Conversely, homogeneous regions of chromatin would result in low Σ.
Fig. 1.
Live-cell PWS rapidly provides quantitative nanoscale structural information of living cells. (A and B) Orthographic z-axis projection of molecular dynamics simulations of chromatin as a 10-nm “beads on a string” polymer capturing (A) differentially compacted (lc = 70 nm) and (B) diffusely compacted chromatin (lc = 20 nm). (Scale bar: 100 nm.) (C and D) Calculated transmission microscope image captured by (C) conventional bright-field microscope from differentially compacted chromatin in A and D of diffusely compacted chromatin in B. Images were produced by calculating the average mass density at each pixel, and a Gaussian PSF of 250 nm was applied to simulate a conventional microscope. Grid size of the simulations was 10 nm. (E and F) Calculation of Σ captured by live-cell PWS from differentially compacted chromatin in A and diffusely compacted chromatin in B. Σ was calculated directly from the distribution of mass within configurations shown in A and B with Σ = 0.01–0.065. (G) Representative pseudocolored live-cell PWS image of HeLa cells with 63× oil-immersion lens, N.A. = 1.4 with Σ scaled to range between 0.0125 and 0.065. (H) Colocalization of fluorescence with live-cell PWS image showing mitochondria (green), nuclei (dark blue), and mitochondria–nucleus overlap (light blue). (Scale bar: 20 µm.) (I and J) Representative pseudocolored live-cell PWS image of (I) HeLa cells and (J) Mes-SA cells demonstrating the capacity to capture nanoscopic information from dozens of nuclei in seconds with Σ scaled to range between 0.01 and 0.05 in I and 0.01 and 0.065 in J.
Although this instrument configuration was optimized to allow live-cell imaging with multimodal acquisition, including wide-field fluorescence and phase contrast microscopy, it has an appreciably weaker reference interference signal than that produced in traditional PWS cytology and a much higher objective collection numerical aperture. Therefore, we validated the nanoscale sensitivity of live-cell PWS by using rigorous finite-difference time domain computations (Fig. S2) to numerically solve Maxwell’s equations without approximations simulating the nanoscale-complex spatial distribution of molecular density in live cells. These computations were used to study the effect of the RI mismatch using sapphire as a high-RI substrate on the interference signal (SI Materials and Methods, Origin of Interference Spectrum), and to compare the effect of numerical aperture on Σ (Fig. S3). The finite-difference time domain (FDTD) simulations enabled us to optimize the configuration of signal acquisition to provide nanoscale sensitivity to intracellular structure at length scale between 20 and 200 nm.
Fig. S2.
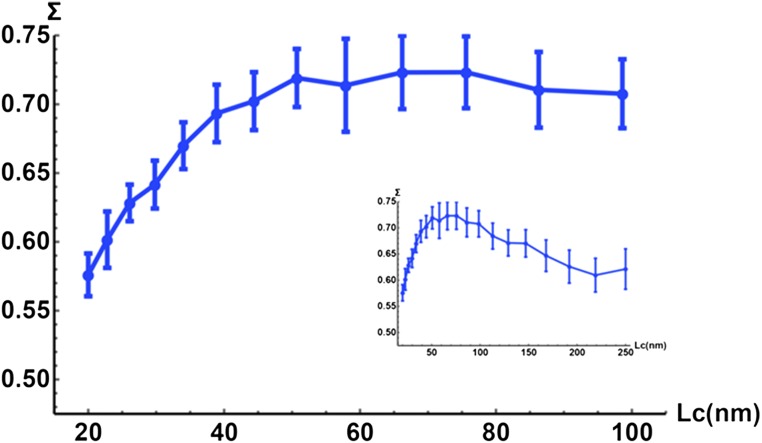
FDTD simulations of live-cell PWS microscope. FDTD simulations of light scattering through three layers of media with a collection N.A. of 1.25. The first layer is glass with constant refractive index (RI) of 1.53; the second layer represents a cell with randomized RI (mean of 1.38, SD of 0.04); the third layer is media with constant RI of 1.33. At deeply subdiffractional length scales, ∑ increases proportionally with the correlation length (Lc). Inset represents full range of subdiffractional Lc present within cells. Error bars are SD.
Fig. S3.
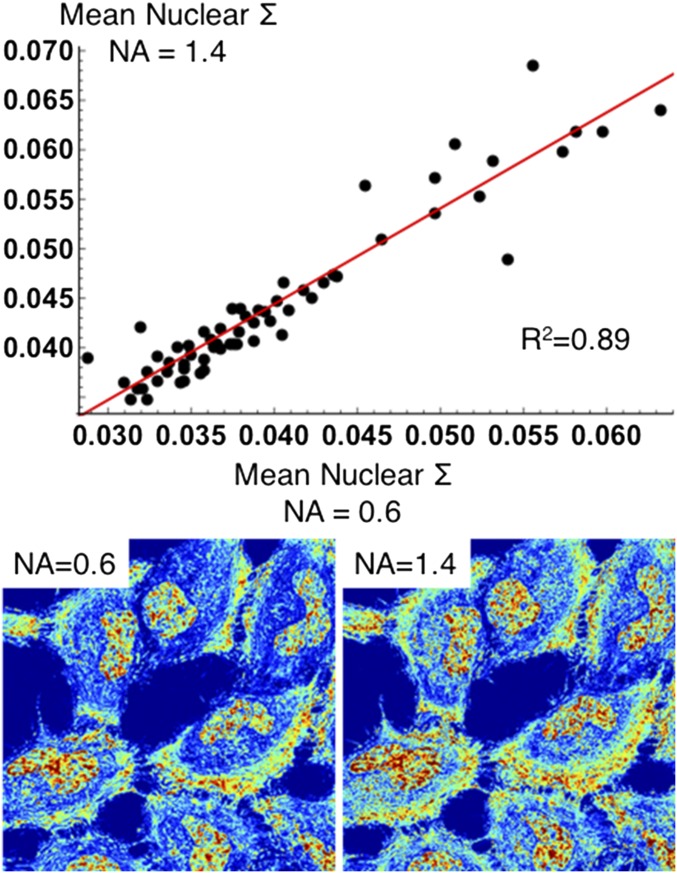
Analysis of numerical aperture on spectral interference (∑) signal. A variable 63× oil objective was used to measure the effect of numerical aperture (N.A.) on ∑ in the nuclei of HeLa cells. A reference signal was collected for both the low-N.A. (0.6) and high-N.A. (1.4) configurations. The same cells were directly imaged using both N.A. configurations (n = 62 from two independent experiments over 12 fields of view) and were collected successively in under a minute to minimize temporal variations in structure.
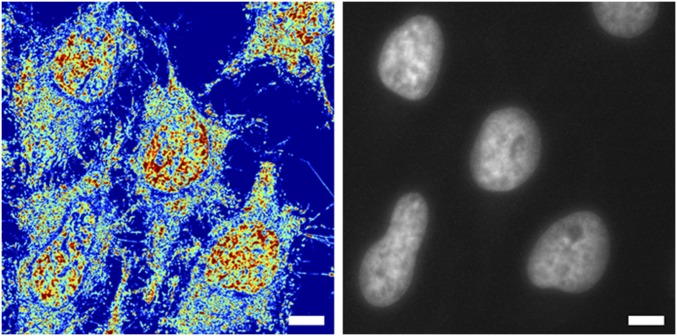
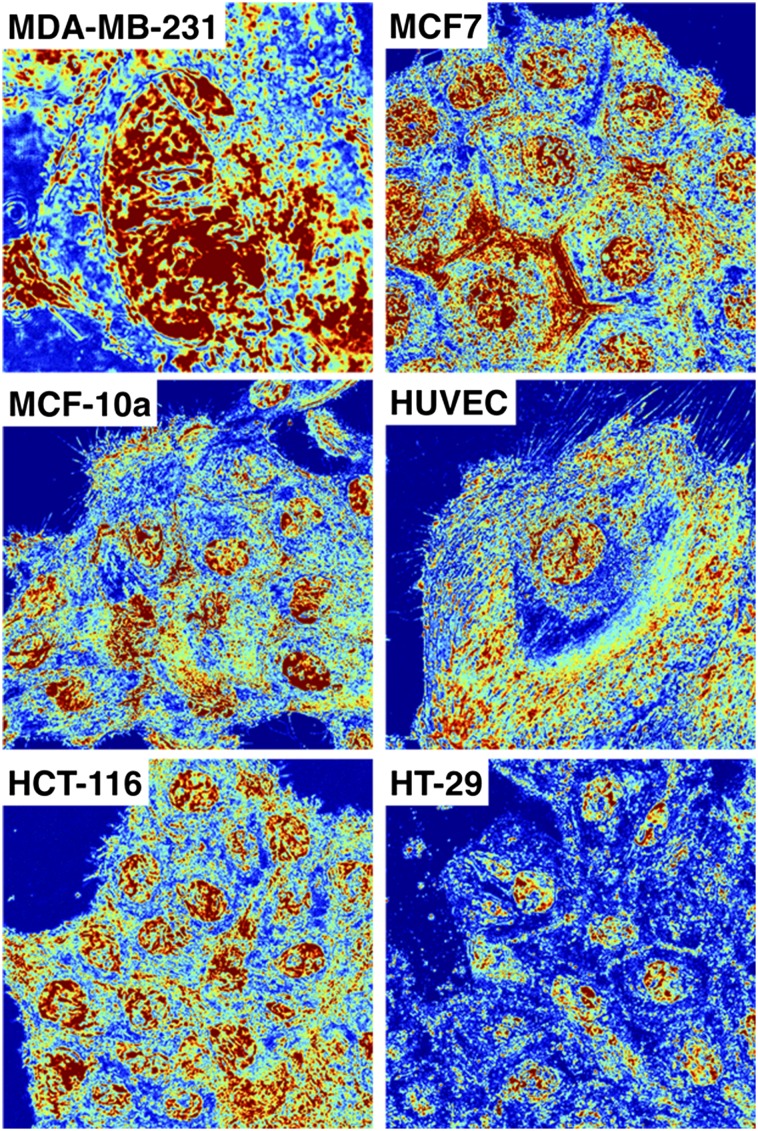
Without the use of exogenous labels, we can achieve high-contrast images using Σ that delineate nuclei from cytoplasm due to the intrinsic differences in their nanoarchitecture (Fig. 1G; Fig. S4 for additional comparisons in multiple cell lines, including primary; and Fig. S5 for cell lines). Due to its multimodal design, exogenous and endogenous labels can be subsequently used to colocalize specific molecular markers or organelles (Fig. 1H). Live-cell PWS acquisition yields a 3D data cube, I(λ, x, y), where λ is the wavelength and (x, y) correspond to pixel positions across a 10,000-μm2 field of view, allowing multiple cells to be imaged simultaneously. Acquisition of the full cell reference interference spectrum (500–700 nm) for spectral analysis takes under 30 s, with each wavelength collection produced from <100-ms exposures. Using a reduced wavelength approach to subsample the interference spectrum, this can be further reduced to under 2 s per acquisition (27). Even with full spectral collection, as demonstrated in Fig. 1 I and J (and Figs. S4 and S5), live-cell PWS provides rapid, quantitative visualization of cellular structures within a single field of view for dozens of cells simultaneously for multiple cell lines (Fig. 1I, 20 HeLa cells captured in ∼30 s, and Fig. 1J, 36 Mes-SA cells captured in ∼15 s). Indeed, one of the most critical features of this rapid acquisition is the capacity to directly study the underlying heterogeneity of both chromatin structure and its temporal evolution within the cell population over time. Likewise, as a label-free technique using low illumination intensity, live-cell PWS allows for the study of various time-evolving processes on the structure of cells in general, and chromatin in particular for different cell types over extended periods of time.
Fig. S4.
Comparison of live-cell PWS images (Left) with wide-field fluorescence of nuclei (Right). Live-cell PWS microscopy allows identification of nuclei due to the intrinsic differences in the structure between the nucleus and the cytoplasm. ∑ scaled between 0.2 and 0.65. (Scale bar: 15 μm.)
Fig. S5.
Full spectral acquisition of live-cell PWS for six cell lines. Live-cell PWS microscopy allows direct analysis of the nanoscopic topology of a wide range of eukaryotic cell line models. In addition to the ubiquitously used cell lines used in the main manuscript (HeLa and CHO cells), additional classical models of breast cancer (MDA-MB-231, MCF-7, MCF-10a), colon (HT-29, HCT116), and even primary human cell lines (HUVECs) can all be imaged without the need for fluorescent transfection or small-molecule exogenous dyes. ∑ scaled between 0.01 and 0.065 in all cells except MDA-MB-231, which is called from 0.01 to 0.1.
Live-cell PWS has a broad utility as a tool for studying the complex relationships between cell function and chromatin nanoorganization. As the initial demonstration, we explored live-cell PWS to rapidly quantify the changes in the nanoscale chromatin structure due to DNA damage. As a demonstration of its ability to detect rapid changes specific to chromatin (within seconds), we explored the transformation of the higher-order chromatin structure secondary to DNA fragmentation using the DNA-binding dye, Hoechst 33342. Damage to DNA results in the formation of DNA fragments and double-stranded breaks (28–30). This damage, in turn, leads to apoptosis or mutagenic transformation. In cancer therapy, many drugs eliminate tumor cells by causing an unbearable accumulation of DNA damage and/or by activating the intrinsic apoptotic pathways (31, 32). Therefore, the identification of DNA fragmentation and understanding of the time evolution of chromatin structure in response to damage are crucial to both understanding DNA repair mechanisms and to identifying chemotherapeutic efficacy.
Current techniques to study these processes require cell fixation, such as immunofluorescent identification of the rapidly phosphorylated histone H2A.X (γ-H2A.X) subunit (30) or transfection using photoactivatable proteins (33, 34). Furthermore, fluorescent visualization of cell viability for drug screening often requires the use of cell-permeant minor-groove binding dyes. However, it has been reported that these minor-groove DNA-binding dyes, including Hoechst 33342, induce DNA fragmentation by disrupting the activity of topoisomerase I (35, 36). These effects are observed independently from the fluorescence excitation of the dye but are accelerated upon UV excitation (36). Consequently, no methods currently exist with the capability for the real-time study of changes to chromatin higher-order structure due to DNA damage or the overall dynamics of the damage response in unlabeled live cells.
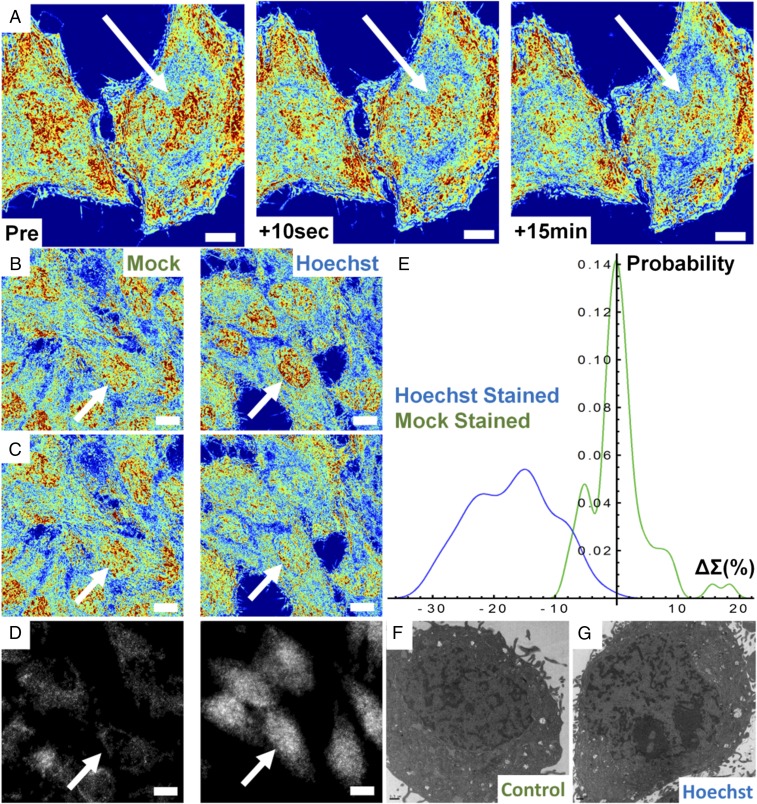
Using live-cell PWS, we show that the addition of Hoechst 33342 to living mammalian cells transforms the nanoorganization of chromatin at the timescale required for imaging and that subsequent excitation induces fragmentation of the chromatin nanoarchitecture within seconds. This is apparent, as we observe an overall decrease in the Σ after irradiation, suggesting homogenization and decompaction of chromatin across the entire nucleus (Fig. 2A). Additionally, these effects persist for longer durations, lasting at least 15 min, indicating that the once-fragmented chromatin in the presence of the dye does not immediately reassemble, suggesting these changes could be irreversible. To control for the effects of ionizing UV radiation required for Hoechst excitation, we performed a mock-staining (M-S) experiment where we compared the nuclear changes in cells incubated with Hoechst 33342 to those exposed to UV light alone. In the M-S cells, there was not an observable change in cellular or chromatin structure during the short illumination time required for Hoechst excitation, indicating preservation of the original chromatin structure (Fig. 2 B and C). Quantitatively, M-S cells showed no significant change in mean-nuclear Σ after a few seconds of UV exposure, whereas the Hoechst-stained cells display a 17.01% decrease in HeLa [99% confidence interval, Hoechst (−18.5%, −15.6%); value of P < 0.001] between M-S and Hoechst-stained cells with n = 146 cells from 11 independent experiments for Hoechst-stained cells and n = 68 cells from 6 independent experiments for M-S cells (Fig. 2 B and C). In Hoechst-stained cells, all nuclei demonstrate a negative change in the mean nuclear Σ after UV exposure, whereas the M-S cells display a narrow, zero-centered distribution after UV exposure (Fig. 2E). In both M-S and Hoechst-stained cells, cytoplasmic Σ did not change following UV exposure (value of P > 0.05). Similar results were observed for Chinese hamster ovarian (CHO) cells with M-S cells displaying no change, whereas Hoechst-stained cells experience a −7.1% decrease [99% confidence interval, Hoechst (−9%, −5%); value of P < 0.001 between M-S and Hoechst-stained cells; n = 127 cells for M-S, n = 87 for Hoechst-stained from five independent experiments each], demonstrating this effect occurs independent of the cell type (Fig. S6).
Fig. 2.
Hoechst excitation induces rapid transformation of chromatin nanoarchitecture. (A) Pseudocolored live-cell PWS image of Hoechst 33342-stained HeLa cells before and after excitation of the dye with UV light. Transformation of chromatin occurs across the whole nucleus within seconds and no repair is observed even after 15 min. (B) Hoechst-stained and M-S cells before excitation and (C) the same M-S and Hoechst-stained cells after UV irradiation. (D) Minimal (mock) and significant (Hoechst) γH2A.X antibody accumulation. (E) Distribution of chromatin transformation after UV excitation for Hoechst-stained and M-S cells. (F and G) Transmission electron-microscopic images of control and Hoechst-stained cells confirming nanoscale fragmentation of the chromatin nanoarchitecture in fixed cells. All pseudocolored images scaled between Σ = 0.01 and 0.065. (All scale bars: 15 µm.) Arrows indicate representative nuclei.
Fig. S6.
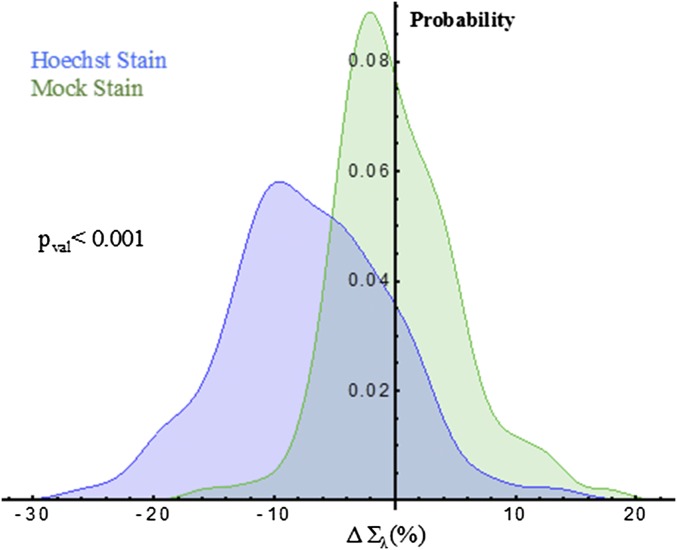
UV excitation of Hoechst 33342 in Chinese hamster ovarian (CHO) cells. Distribution of nuclear transformation (ΔPost-Pre irradiation) after UV excitation for mock-stained (green) and Hoechst-stained (blue) CHO cells. As with HeLa cells, CHO cell nuclei demonstrate a decrease in signal immediately after irradiation in the Hoechst-stained cells.
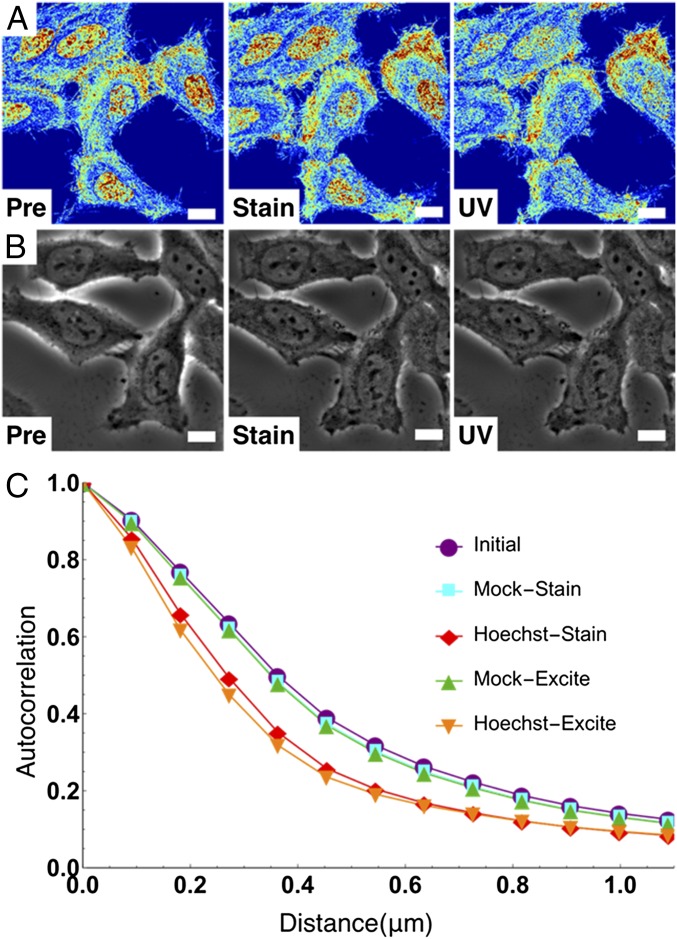
Due to this rapid (<10-s) chromatin transformation, we hypothesized that the decrease in the mean nuclear Σ was due to the homogenization of the higher-order chromatin organization caused by DNA fragmentation and the resulting nuclear remodeling. To test this hypothesis, we used a γ-H2A.X-Alexa 488–conjugated antibody to independently monitor the fragmentation of DNA. In Hoechst-stained cells, we observed a drastic accumulation of the γ-H2A.X antibody, whereas we observed little or no localization in the M-S control nuclei (Fig. 2D). Additionally, TEM on Hoechst-stained and M-S cells exposed to UV light showed an increase in micrometer-scale dense chromatin clumps compared with untreated cells (Fig. 2 F and G). As previous work has shown that DNA damage causes local chromatin expansion (37), this confirmed our hypothesis that immediate DNA fragmentation was induced by Hoechst 33342 excitation, a phenomenon that is detectable by live-cell PWS in real time without the need for exogenous labels. Subsequently, we compared live-cell PWS with phase contrast microscopy to determine whether live-cell PWS provides information not detectable by other standard, label-free optical modalities (Fig. 3 A and B). With phase contrast microscopy, no changes in the cell or nuclear structure were detected after excitation of Hoechst 33342 due to its diffraction-limited resolution (Fig. 3B). Although electron microscopy cannot be performed on live cells, these experiments demonstrate that photoexcitable molecules disrupt the chromatin nanoarchitecture, which is uniquely detectable in real time in live cells by live-cell PWS.
Fig. 3.
Live-cell PWS uniquely detects nanoarchitectural transformation resulting from Hoechst incubation and excitation. (A and B) Live-cell PWS (A) and phase contrast (B) cells preincubation, 15-min postincubation, Hoechst fluorescent image, and after excitation. (C) Change in the autocorrelation function of live-cell PWS intensity. Hoechst transforms chromatin into a more globally heterogeneous structure. Live-cell PWS images are scaled between Σ = 0.01 and 0.065. (All scale bars: 15 µm.)
Next, we investigated the effects of Hoechst staining on the spatial transformation of chromatin nanoorganization as measured by live-cell PWS. In particular, we analyzed the spatial distribution of Σ across the nucleus by calculating the 2D spatial autocorrelation, which measures the change in the pixel-to-pixel variability as a function of distance. An increase in the spatial autocorrelation indicates that the nanoscale structure at one pixel has become similar to its neighboring pixels, whereas a decrease indicates a more locally heterogeneous structure. The size of these clusters of similar nanoscale structures was significantly decreased between 100 nm and 1 µm after both the addition of Hoechst and its excitation (n = 40 from three independent experiments) (Fig. 3C). This indicates an increase in the spatial microscopic heterogeneity of nanoscopic heterogeneity of the nuclear nanoscale structure (Σ) after Hoechst addition and excitation. Consequently, we found that Hoechst causes a global alteration in the chromatin nanoarchitecture independent of its excitation. Not only does this study demonstrate the ability of live-cell PWS to sense the alterations in chromatin structure that were heretofore undetectable in live cells, such as double-strand DNA breaks, but it also illustrates some of the limitations of the extrinsic labeling approaches, such as Hoechst: even though they have traditionally been used for live-cell imaging, these labels alter chromatin structure and lead to DNA damage, which in turn may lead to a perturbation of cell function (Fig. S7).
Fig. S7.
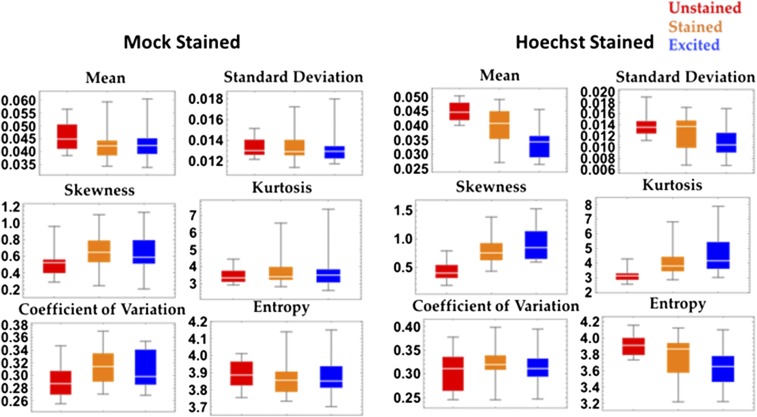
Distribution statistics for Hoechst-stained cells. The effect of Hoechst staining on the statistical properties of the nanoarchitecture as measured by ∑ within cell nuclei between mock-stained and Hoechst-stained cells. In addition to altering the mean nuclear ∑, Hoechst staining and its excitation causes changes in the distribution of possible nuclear states. In particular, Hoechst staining increases the skewness and the kurtosis while decreasing the image entropy.
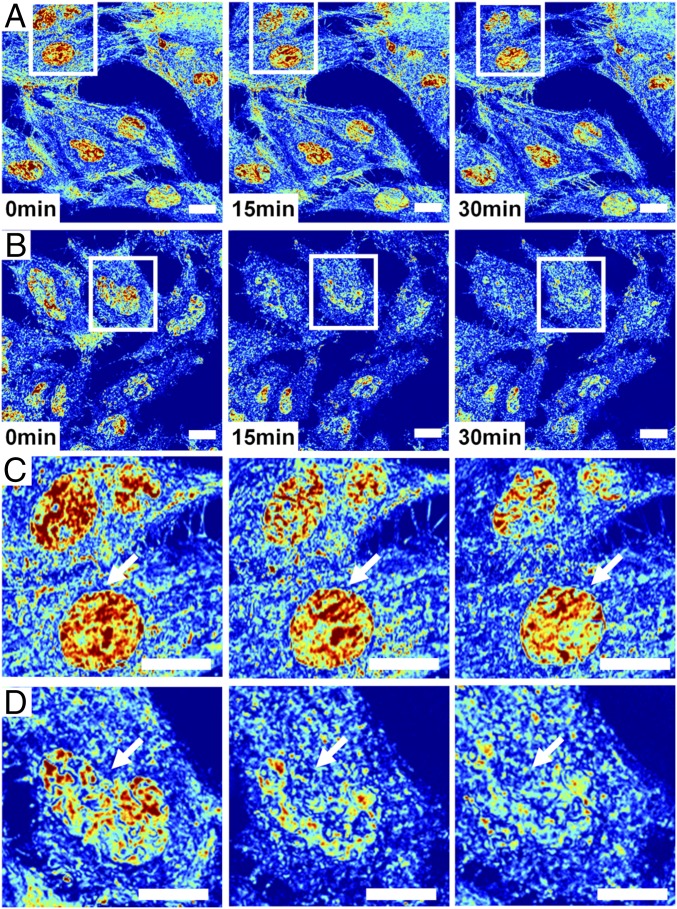
Owing to this sensitivity of live-cell PWS to detect dynamic changes to the chromatin nanoarchitecture due to DNA damage, we next applied it to study the temporal dynamics of the cellular nanoarchitecture under normal growth conditions (Fig. 4A) in comparison with cells exposed to continuous UV light (Fig. 4B). UV light is known to cause DNA damage, generate reactive oxygen species, alter receptor-kinase function, and disrupt the cellular membrane. Under normal conditions, chromatin structure can evolve rapidly, with whole-scale changes occurring in minutes (Fig. 4C; for a full movie of control cells, see Movie S1). Although the nanoscale topology of chromatin rapidly evolves within any given cell, the organization across the population overall remains stable under normal conditions. In comparison, during continuous UV exposure over 30 min, higher-order chromatin structure is degraded after few minutes of exposure (Fig. 4D; for a full movie of UV-irradiated cells, see Movie S2), with pronounced variations in structure over time from cell to cell (with time-lapse measurements performed for three independent experiments). As can be observed in Movie S3, there are numerous phenomena that occur to the cellular nanoarchitecture during continuous UV exposure across a distribution of timescales.
Fig. 4.
Live-cell PWS detects dynamics of nanoarchitectural transformation under normal and UV-irradiated conditions. (A) Representative field of view displaying seven HeLa cells imaged in ∼15 s using a 63× oil-immersion lens, N.A. = 1.4, with Σ scaled to range between 0.01 and 0.065 over 30 min of imaging. (B) Representative field of view displaying seven HeLa cells exposed continuously to UV light imaged in ∼22 s using a 63× oil-immersion lens, N.A. = 1.4, with Σ scaled to range between 0.01 and 0.065 over 30 min of imaging. (C) Inset from field of view in A showing the time evolution of two nuclei. Interestingly, chromatin organization is rapidly evolving in time, showing that, even at steady state, the underlying structure changes. (D) Inset from field of view in B showing the time evolution of one nucleus under UV illumination. Under UV exposure, homogeneous micrometer-scale domains form within chromatin, lacking their original higher-order structure. Arrows indicate representative nuclei.
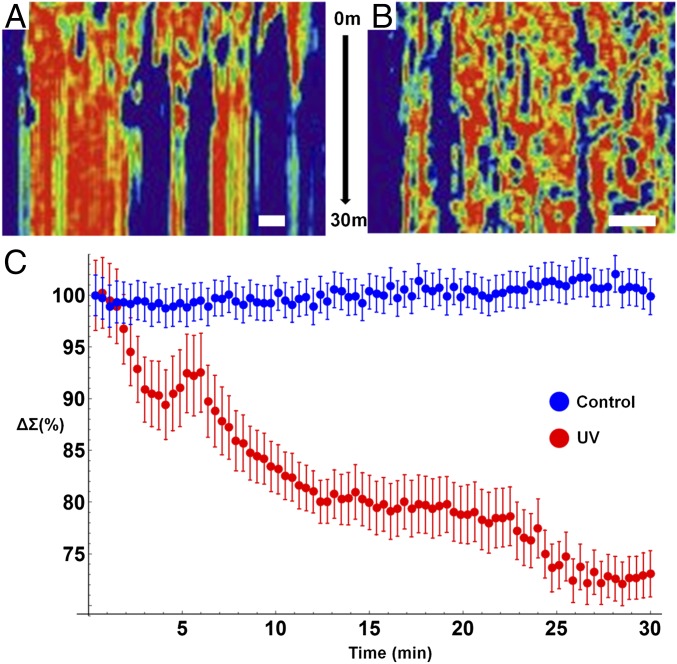
Over the course of 2–3 min, there are minimal changes in chromatin and cellular topology due to UV light exposure. However, after ∼3 min, the chromatin of some cells exposed to UV light undergoes rapid, directional increase in heterogeneity that corresponds with the formation of micrometer-scale homogeneous domains (Movie S3 and Fig. 4D). Concurrently, the cytoplasm of the cell is transformed, with cell–cell adhesions retracting and a retreating waveform spreading from the cell periphery toward the nucleus. Finally, a near-instantaneous transition occurs within the cytoplasm, with the changes in the cytoplasmic and chromatin nanostructure spontaneously arresting 20 min after exposure. To capture these temporal dynamics in nanostructure, we performed a kymograph analysis using ImageJ of a representative cell exposed to UV light in comparison with a control cell. As is shown in Fig. 5A, over the 30 min of exposure to UV, micrometer-scale homogeneous domains form within the nucleus and the temporal evolution of nanostructure ceases. In comparison, control cells display continuous transformation, with homogeneous and heterogeneous domains transiently forming and dissipating over the time frame of a few minutes (Fig. 5B). As is shown in Fig. 5C, the formation of these large, homogeneous domains that lack higher-order structure dominate, resulting in an overall decrease in ∑ (average decrease at 30 min of 26.9% calculated from 19 nuclei from three independent experiments). Interestingly, even under control conditions, some cells rapidly demonstrate global changes in their chromatin topology, possibly due to intrinsic molecular variations or due to differential sensitivity to light exposure. Despite these rapid alterations, the overall chromatin structure of the population displays minimal changes over the course of 30 min (average 0.2% decrease in ∑ from 32 nuclei from two independent experiments; additional control experiments with slower acquisition were not included) (Fig. 5C). Given the multimodal nature of the current system, these topological variations can be examined and any possible light toxicity further minimized by a variety of well-established methods, including spectral filtration at the illumination source or by using structured illumination.
Fig. 5.
Live-cell PWS detects dynamics of nanoarchitectural transformation under normal and UV-irradiated conditions. (A) Kymograph (with the x axis representing a linear cross-section in x–y plane and the y axis showing changes over time) representing the temporal evolution of chromatin of a cell exposed to continuous UV light. Interestingly, nanoscopically homogenous, micrometer-scale domains form within the nucleus after ∼5 min of exposure with an overall arrest in structural dynamics. (B) Kymograph representing the temporal evolution of chromatin of a cell under normal conditions. Under normal conditions, the nanoscale topology of chromatin is highly dynamic, with continuous transitions in structure occurring throughout the nucleus. (C) Quantitative analysis of nanoscale structure of chromatin of cells under normal conditions (blue, n = 32 cells from two replicates) and exposed to UV light (red, n = 19 cells from three replicates) for 30 min. Exposure to UV light induces overall homogenization of chromatin nanoarchitecture within minutes. Error bars represent SE. (Scale bar: 5 µm.)
As a final demonstration of the broad utility of live-cell PWS as a tool for studying the complex relationships between cell function and chromatin nanoorganization, we studied the effect of alteration of cellular metabolism on higher-order chromatin architecture. The relationship of chromatin structure with mitochondrial function and metabolism has been a major point of focus in recent years. Studies have shown that the cellular metabolic activity is intimately linked to cell replication, tumor formation, DNA damage response, and transcriptional activity (38–41). Therefore, understanding the interplay between the structural organization of chromatin and mitochondrial function is pivotal to understanding numerous diseases. Recent fluorescence microscopy studies have suggested that impairment of cellular metabolism induces rapid (<15-min) transformation of chromatin (42, 43). However, these studies often require the production of specialized transfection models (H2B-GFP) or the use of DNA-binding dyes such as Hoechst 33342 and, as such, are limited in their ability to study multiple cell lines and/or over significant periods of time without perturbing the natural cell behavior (42, 43).
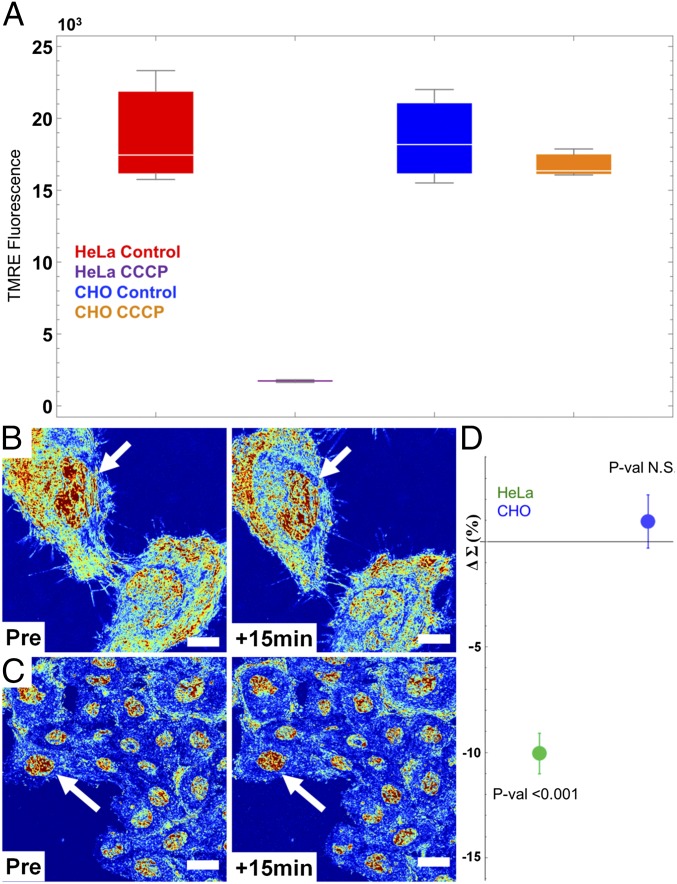
To study the link between chromatin structure and mitochondrial function, we used the protonophore, carbonyl cyanide m-chlrophenyl hydrazine (CCCP), which is widely used for studies of mitochondrial function due to its disruption of mitochondrial membrane potential (ΔΨm). To explore the role of ΔΨm reduction on the immediate transformation of the chromatin nanoarchitecture in live cells, we used two cell lines, HeLa and CHO. Following addition of 10 µM CCCP, HeLa cells rapidly lost ΔΨm, whereas CHO cells displayed no significant change as gauged by tetramethylrhodamine (TMRE) fluorescence (Fig. 6A). Interestingly, after 15 min of treatment with CCCP, we found that addition of 10 μM CCCP produced rapid transformation of chromatin structure in HeLa cells but not in CHO cells (Fig. 6B). Critically, in HeLa cells, we observed a decrease in nuclear Σ suggesting homogenization and decompaction in the chromatin structure. Conversely, in CHO cells, we observed no statistical change in chromatin compaction and heterogeneity (Fig. 6C). Quantitatively, HeLa nuclei showed a 10% decrease in mean-nuclear Σ after CCCP (value of P < 0.001; n = 31 from six independent experiments), whereas the CHO cells displayed no significant increase in mean-nuclear Σ (n = 159 cells from five independent experiments) (Fig. 6D). This transformation suggests that the depletion of mitochondrial membrane potential induces rapid decompaction and homogenization of chromatin nanostructure. Disruption of the ΔΨm has numerous effects, including the inhibition of mitochondrial ATP synthesis, changes in the production of reactive oxygen species, altered signal transduction, as well as modification of other mitochondrially produced metabolites (i.e., acetyl and methyl transfer groups). Although previous groups have shown that Ψm is an important determinant of cellular proliferation, to date it has not been shown that loss of Ψm has a rapid effect on the global chromatin structure. These results show that the change in Ψm rapidly regulates the nanoscale organization of chromatin, possibly resulting in the observed decreased proliferative potential of cells over time.
Fig. 6.
Mitochondrial membrane potential (ΔΨm) is a direct, rapid regulator of chromatin compaction. (A) Flow cytometry showing a 10-fold decrease in HeLa cell TMRE fluorescence after 10 μM CCCP treatment (P < 0.015) and no significant change in CHO cell fluorescence. (B) HeLa and (C) CHO cells before and 15 min after CCCP treatment. (D) Quantification of the nuclear nanoarchitecture change in HeLa and CHO cells before and after treatment (HeLa = 31 cells, six replicates; CHO = 159 cells, five replicates) with SE bars. Depletion of ΔΨm induces decompaction and homogenization of HeLa but not CHO chromatin. Live-cell PWS images are scaled between Σ = 0.01 and 0.065. (All scale bars: 15 µm.) Arrows indicate representative nuclei.
SI Materials and Methods
Cell Culture.
HeLa Cells (ATCC) were grown in Gibco-formulated RPMI 1640 media (Life Technologies) supplemented with 10% FBS (Sigma-Aldrich) and grown at 37 °C and 5% CO2. Chinese hamster ovarian (CHO) cells (ATCC) were maintained in ATCC-formulated F-12K media (ATCC) supplemented with 10% FBS and grown at 37 °C and 5% CO2. MDA-MB-231 cells (provided courtesy of the O’Halloran Laboratory, Northwestern University, Evanston, IL) were grown in Gibco-formulated DMEM media (Life Technologies) supplemented with 10% FBS (Sigma-Aldrich) and grown at 37 °C and 5% CO2. All of the cells in this study were maintained between passages 5 and 20. Microscopy measurements were obtained from cells grown on uncoated size 0 or 1 glass coverslips attached to 50-mm Petri dishes (MatTek). Petri dishes were seeded with between 10,000 and 50,000 cells in 2–5 mL of the cell-appropriate media at the time of passage. Cells were allowed at least 24 h to readhere and recover from trypsin-induced detachment. Imaging was performed when the surface confluence of the slide was between 40% and 70%. All imaging of HeLa and CHO cells for colocalization was performed in RPMI 1640 supplemented with 10% FBS without phenol red. For all other experiments, cells were imaged in cell-appropriate growth media formulations indicated by ATCC or Lonza at 37 °C and 5% CO2.
MitoTracker and Hoechst 33342 Staining.
Mitochondria were stained using MitoTracker Orange CMTMRos (Life Technologies) dissolved in RPMI 1640 supplemented with 10% FBS at a final concentration of 100 nM for 15 min at 37 °C and 5% CO2 (open air). Nuclei were stained with Hoechst 33342 (Life Technologies) dissolved in RPMI 1640 supplemented with 10% FBS at a final concentration of 4 μM staining solution for 15 min. Imaging of Hoechst-stained nuclei was performed by 8 s/collection exposure to broadband UV light produced by a HBO-100 mercury lamp (Leica) passed through a DAPI filter (Chroma). Imaging of MitoTracker Orange-stained mitochondria was performed by 2 ms/collection exposure to broadband green light produced by the Xcite-120 LED lamp passed through a Cy3 filter (Chroma).
Instrumentation.
Live-cell partial-wave spectroscopic (PWS) instrumentation differs from PWS microscopes in a few keys ways: (i) a high-N.A. oil-immersion objective, (ii) an inverted sample geometry, (iii) a long-pass filter to remove UV wavelengths, and (iv) a stage top incubation chamber to perform long-term studies. These alterations in instrumentation and sample geometry enable live-cell PWS to rapidly image nanoscale cellular structure in live cells with minimal perturbation. Although subtle, these modifications completely transform the types of processes that can be studied, significantly alter the nature of light interference, maximize throughput, signal-to-noise, and reduce cellular toxicity. By studying live cells, we can now perform time-dependent causation studies, whereas PWS cytology is limited to studying correlations between populations at fixed time points. The live-cell PWS instrument is built into a commercial inverted microscope (Leica DMIRB) equipped with a broadband illumination provided by a xenon lamp (Fig. S1). With this configuration, the live-cell instrument is also capable of multimodal acquisition, including wide-field fluorescence and phase contrast microscopy. The sample is illuminated with a low N.A., whereas the collected backscattered light is limited by a high-N.A. oil-immersion objective (40×, N.A. = 1.25; 63×, N.A. = 1.4; or 100×, N.A. = 1.4). Monochromatic images of the backscattered light are collected at 1-nm wavelength intervals ranging from 500 to 700 nm using a combination of a liquid crystal tunable filter (LCTF) (CRi) and a camera (CMOS Hamamatsu ORCA-Flash 2.8 or Hamamatsu Image-EM CCD C9100-13). This yields a 3D data cube, I(λ, x, y), where λ is the wavelength and (x, y) correspond to pixel positions across a 10,000-μm2 field of view, allowing multiple cells (1–100, depending on the eukaryotic cell line) to be imaged simultaneously. Acquisition of the full interference spectra for spectral analysis takes under 30 s, with each wavelength collection produced from <100-ms exposures. As the result of this design, our instrumentation produces baseline temporal fluctuations in intensity that are on average below 1% and spatial variance in intensity of 0.08% throughout the illuminated field. The current system configuration maximizes signal to noise with minimal acquisition time (35 ms/wavelength, under 20-s total acquisition) resulting in 10:1 ratio of luminescence to the camera dark count. As a result, ∑ from intracellular structures ranges between 5:1 and 250:1 compared with empty media.
Origin of Interference Spectrum.
Live-cell PWS collects light scattered from within a cell due to refractive index (RI) fluctuations (internal scattering) and a strong reflection from the glass–cell interface (reference arm, RI mismatch: 1.52–1.38). The nanoscale sensitivity of live-cell PWS arises from analyzing the interference between the internal scattering from cellular structures and the scattering from the reference arm (internal-reference interference) (18). In short, the signal registered by live-cell PWS has two components: (i) wavelength-dependent internal-reference interference, and (ii) wavelength-independent reflectance from the substrate.
To demonstrate that live-cell PWS signal originates from internal-reference interference (component 1), we experimentally measured the ratio of Σ for cells grown on glass to that of cells grown on sapphire (reference arm, RI mismatch: 1.77–1.38). The ratio of Σ for cells imaged on sapphire to cells imaged on glass is expressed through theoretically predicted reflectances as follows (18):
where Σsapphire is the average Σ for cells grown on sapphire, Σglass is the average Σ for cells grown on glass, and Ra-b is the known theoretical reflectance from an interface between media (a) and substrate (b). In our system, the measured relative ratio is 0.458 (SE = 0.012; nglass = 91 cells; nsapphire = 72 cells), which closely matches the theoretical value given experimental error and an assumption of average cellular reflective index of 1.38. This result validates that Σ originates from the interference produced between scattering from internal structures with the strong scattering from the reference.
To test the wavelength-independent portion of the signal (component 2), we compared the spectrally averaged reflectance intensity of cells and their substrate-specific normalization measurement. The ratio of these reflectances are close to 1 for both glass and sapphire measurements (99% confidence interval for glass of Itotal/Iglass-media is [1.014, 1.028] and for sapphire Itotal/Isapphire-media is [1.000, 1.014]). Here, Itotal is the spectrally averaged reflectance intensity measured from cells and Isubstrate-media is the spectrally averaged reflectance intensity from our normalization measurements. The fact that total reflectance intensity and the normalization reflectance match, confirms that the origin of live-cell PWS signal arises from the interference originating between light scattered from the internal structures within the cell and that scattered from the substrate.
Most importantly, as a live-cell instrument, it can capture the relative transformation in the nanoorganization in less than 1 min. At short timescales (<1 min), the total mass of the any nondividing eukaryotic cell is approximately constant and macromolecular flux is conserved at short length scales. Due to this conservation of total cellular mass, the relative change in Σ between frames must capture changes in the length scale distribution within the cell. Conceptually, large decreases in Σ correspond to the consequent homogenization of internal structures, whereas increases in Σ correspond to the inverse.
Owing to the experimental length scale sensitivity (20–200 nm), live-cell PWS would predominantly measure topological changes of macromolecular organization because it has a noise-derived lower length scale limit of 20 nm. Structures and macromolecules below 20 nm would affect the average density and therefore refractive index, but are not at length scales large enough to change the spatial heterogeneity of density that is sensed by PWS. As a result, live-cell PWS microscopy is most sensitive to macromolecular assemblies such as filamentous structures within the cytoplasm (F-actin, microtubules), the folding properties of organelles (e.g., mitochondrial matrix), and the intranuclear macromolecular assemblies formed by chromatin. Within the interphase nucleus, there are no structural assemblies such as microtubules or F-actin to provide organization. As a result, the organization is derived from the intrinsic folding of the genome. Although there are free molecules such as transcription factors and mRNA, these macromolecules are generally below 20 nm in size and contribute mainly to the average refractive index of the nucleus. Therefore, due to this lower limit of sensitivity, the only component within the nucleus that PWS probes is chromatin as it is the main intranuclear macromolecule that can form structures above 20 nm.
Analysis of Numerical Aperture on Spectral Interference Signal.
Another critical validation of the system is the study of the effect of the numerical aperture on the observed interference signal. In comparison with fixed-cell PWS, live-cell PWS employs a high-N.A. oil-immersion objective (N.A. of 0.60 vs. 1.40). The increased N.A. improves imaging resolution for PWS as well as wide-field fluorescence. This will be particularly important in the future for adding superresolution modalities to the instrument. The switch from the lower N.A. used in air objectives for fixed-cell PWS to that of the high N.A. alters the angles of light collected from the cells during measurements, possibly limiting the nanoscale sensitivity. As such, a high-N.A. system could result in collection of light from larger angles and nonlinearly influence the signal by introducing noninterference scattering. To address this concern, we used a variable-N.A. oil objective that could be adjusted from 0.60 to 1.40. The same live cells were measured using both the low (0.60)- and the high (1.40)-N.A. configurations of the objective and analyzed for any apparent mismatch in signal. Critically, the change in the N.A. results in a linear relationship with an R2 = 0.89 (n = 62 cells from two independent experiments), thus validating the signal from the live-cell system even for the high-N.A. objectives used in the studies performed within the manuscript (Fig. S3).
FDTD Simulations.
FDTD solutions of Maxwell’s equations were used to simulate a physical experiment performed by the live-cell PWS microscope (52). Using an in-house software implementation of the FDTD method called Angora, we synthesize microscope images of arbitrary inhomogeneous materials under various imaging parameters by solving Maxwell’s equations for the electric field evolution in space (53, 54). We model live biological cells as inhomogeneous, weakly scattering media with continuous refractive index (RI) distribution [mean RI = 1.38, spatial SD of 0.04 with 6-μm thickness, sandwiched between a glass slide (RI = 1.53) and water (RI = 1.33)] (55, 56). We have synthesized live-cell PWS images of samples with various characteristic length scales of internal organization, modeled by 20 different RI spatial correlation lengths (Lc) within the subdiffractional regime (20–250 nm). Following the analysis methodology used in experiments, the spectral variance Σ2 was computed for every pixel, averaged over 25 independent pixels per image, and then over 20 images of samples with statistically equivalent structure. The results (Fig. S1) of these simulations validate the sensitivity of Σ to changes at deeply subdiffractional correlation lengths for the optical configuration of the live-cell PWS instrument. We also note that the rate of Σ increase with Lc decays as the Lc increases, with Σ peaking at Lc near 75 nm. These simulations represent one component, Lc, of the signal captured by the live-cell PWS instrument.
Autocorrelation Analysis.
The spatial autocovariance function is defined as follows:
where * denotes the complex conjugate and h(x, y) is the mean subtracted Σ value (57, 58).
Using the Wiener–Khinchin theorem, the autocovariance can be calculated as follows:
where FFT and IFFT are the direct and the inverse 2D fast Fourier transforms, obtained via Matlab. Then, a rotational average of g(δx, δy) was taken to obtain the one-dimensional autocovariance function g(∂x, ∂y), which represents the covariance of Σ values as a function of distance, r. Finally, g(∂x, ∂y) is rescaled by the variance to result in the autocorrelation function, with a value of 1 at r = 0 so that the autocorrelation is only a dependent on the spatial distribution of Σ and is not affected by changes in the magnitude of the Σ values.
Image Entropy and Statistical Moments.
Higher-order statistical moments (SD, skewness, and kurtosis) were calculated from the intranuclear distribution using Mathematica 10. Image entropy was calculated as E(X) = over all of the possible states of x of ∑, where p(x) is the probability of state x occurring within the image. Entropy was calculated by the selection of 500 random pixels (states) within each nuclei to avoid bias resulting from changes in the number of selected pixels and pixel with ∑-intensities rounded to the nearest 0.001.
TEM.
TEM micrographs of HeLa cells were obtained for cells exposed to Hoechst 33342 with and without UV light. Hoechst- and mock-stained cells were incubated as previously described, and then exposed to sterilizing UV lamp for 1 h. Cells were trypsinized (Life Technologies) for 10 min and were then processed for TEM at the Biological Imaging Facility of Northwestern University. Trypsinized cells were pelleted by centrifugation (500 × g) and then subjected to high-pressure freezing using a Leica EM-PACT2 high-pressure freezer. Automatic freeze substitution (AFS) was carried out using a Leica AFS2 system before Epon 812 resin (Electron Microscopy Sciences). Thin sectioning (90 nm) of the samples was performed using a Leica Ultracut S-microtome before deposition onto copper grids.
Conclusion
In summary, we have extended the application of PWS microscopy to the study of temporal dynamics of the cellular nanoarchitecture. Using this technique, we can rapidly quantify the nanomolecular organization in live eukaryotic cells without the use of exogenous labels. Applying this technique to studying the topological changes within the nucleus, live-cell PWS microscopy predominantly measures spatiotemporal changes in the macromolecular assemblies formed by chromatin because there are no other scaffolding structures present within the nucleoplasm of interphase nuclei within its sensitivity range. As a result, live-cell PWS demonstrates that the nanoscale structure of chromatin evolves rapidly with time, which would significantly transform our understanding of the structure–function relationship between critical processes and chromatin structure, including DNA repair, replication, and transcription. With this technique, we determined that live-cell DNA-binding dyes, such as Hoechst 33342, cause rapid destruction of the higher-order chromatin structure at timescales (seconds) not previously recognized. Paradoxically, this dye is ubiquitously used for the study of cell viability and the presence of DNA damage (44). As a result, live-cell PWS is a powerful tool for studying DNA damage/repair and, potentially, chemotherapeutic efficacy in live cells. To demonstrate its potential for use in this regard, we studied the temporal dynamics of chromatin during continuous-UV light exposure, showing a transformation in both the temporal and physical properties of the chromatin nanoarchitecture during UV-induced stress.
Additionally, we showed that live-cell PWS allows for previously limited exploration of the factors affecting the chromatin nanoarchitecture by demonstrating differential responses in chromatin structure that depend on the mitochondrial membrane potential. In particular, this illustrates that mitochondrial function is intimately related to chromatin structure in real time and that live-cell PWS can act as a tool to further investigate the mechanisms of chromatin–metabolic interactions. Live-cell PWS is a natural supplement to superresolution fluorescence techniques, providing quantifiable information about unstained cellular organization to examine the role of the nanoarchitecture on molecular interactions in live cells. In the future, we envision that live-cell PWS can be applied to a broad range of critical studies of structure–function in live cells, leveraging the multimodal potential in conjunction with existing SRM to study: (i) the interaction between chromatin structure and mRNA transport; (ii) the accessibility of euchromatin and heterochromatin to transcription factors (45–47); (iii) the relationship between chromatin looping, as measured by techniques such as Hi-C, to the physical chromatin structure (6, 16, 48); (iv) why and how higher-order chromatin structure changes in cancer (14); (v) the role of nuclear architecture as an epigenetic regulator of gene expression (6, 16, 48); (vi) the effect of metabolism on chromatin structure (40, 49); and (vii) the role of chromatin dynamics in stem cell development (50, 51).
Materials and Methods
Live-Cell PWS Imaging.
Before imaging, media within the Petri dishes was exchanged with fresh RPMI-1640 media (lacking phenol red pH indicator; purchased from Life Technologies) supplemented with 10% (vol/vol) FBS (Sigma-Aldrich). For DNA fragmentation experiments, live-cell PWS images were acquired at room temperature (22 °C) and in trace CO2 (open air) conditions for cells subsequently stained with Hoechst 33342. During acquisition of any time series data (UV and controls, metabolic perturbation), cells were maintained at physiological conditions for the duration of the experiment. For imaging, a reference scattering spectra was obtained from an open surface of the substrate coverslip immersed in media before any cellular imaging to normalize the intensity of light scattered for each wavelength at each pixel. We define Σ as the spectral SD of our measured reflectance intensity normalized to this reference scattering spectra from the substrate–media interface. To account for noise due to high-frequency oscillations produced by the lamp, we used a low-pass Butterworth filter before calculation of Σ. For phase contrast imaging, cells were grown and maintained in the same conditions as cells used for live-cell PWS, but images were acquired with a 40× air objective and a transmission illumination beam. Likewise, for wide-field fluorescent imaging, cells were grown in the same conditions but preincubated with Hoechst 33342 for 15 min before imaging. To study the effects of UV illumination on cellular structure and function, cells were continuously exposed to UV light produced from an Xcite 120 LED light source (Excelitas) by removing the 500-nm long-pass filter from the illumination path (measurements were performed in triplicate; n = 19). For Hoechst-induced DNA damage experiments, significance was determined using Student’s t test with unpaired, unequal variance on nuclear Δ(Σ) between the conditions indicated in the experiment in both Mathematica, version 10, and Microsoft Excel (Microsoft) with n = 146 for Hoechst-stained HeLa cells from 11 replicates and n = 87 for Hoechst-stained CHO cells from 5 replicates. For mitochondrial membrane depletion experiments, significance was determined using a two-tailed, paired Student’s t test on nuclear Σ before and after CCCP treatment using Microsoft Excel (Microsoft) with n = 31 for HeLa cells from six independent experiments and n = 159 for CHO cells from five independent experiments. Each experiment consists of 1–10 independent fields of view for analysis. Sequences of pseudocolored live-cell PWS images were merged into movies using ImageJ. All pseudocolored live-cell PWS images were produced using Matlab, version 2015b, using the Jet color scheme with the ranges indicated in the figure legend. All cells were purchased from American Type Culture Collection (ATCC) unless otherwise noted and imaged in their cell appropriate media supplemented with 10% (vol/vol) FBS. Human umbilical vein endothelial cells (HUVECs) were purchased from Lonza and grown under cell-appropriate media formulation on poly-l-lysine–coated glass imaging dishes.
Colocalization.
Fluorescence colocalization of organelle-specific stains with live-cell PWS imaging was performed through manual image alignment of mean-reflectance images produced by live-cell PWS acquisition of unstained cells to the cells at the time of acquisition. Background intensity was removed using ImageJ with using a rolling average of 50 pixels for nuclei and 75 pixels for mitochondria. Threshold intensities for the aligned fluorescence images were then calculated by FindThreshold function in Mathematica, version 10, using Otsu’s algorithm. Colocalized images were produced by the binary mapping of fluorescent images for each stain, pseudocolored, and scaled by the live-cell PWS ∑ intensity.
H2A.X Phosphorylation.
Coregistration of live-cell PWS imaging and DNA strand damage using phospho-histone H2A.X was performed by immunofluorescent staining on three independent experiments. Cells were fixed for 20 min with 4% (wt/vol) paraformaldehyde at room temperature and washed twice with PBS, and a permeabilization/blocking step was performed with 0.1% Triton X-100 in 1% BSA (Sigma-Aldrich) for 20 min. Cells were again washed twice with PBS and then incubated with Alexa Fluor 488 conjugated to anti-γH2A.X (serine 139 residue) rabbit monoclonal antibody (Cell Signaling) for 30 min. Following incubation with the antibody, cells were imaged using the FITC-EGFP filter on the live-cell PWS microscope.
Mitochondrial Membrane Potential Perturbation.
HeLa and CHO cells were grown and prepared for live-cell imaging as previously described. Cell measurements for a single field of view were sequentially obtained for 3 min before treatment with CCCP. HeLa (n = 31 from six independent experiments) and CHO (n = 159 from five independent experiments) cells were treated with 10 μM for 15 min and imaged before and after treatment. Mock-treated cells were incubated with 0.01% DMSO to account for the effect of DMSO solvent on the cells. No significant changes were observed in the mock-treated cells for either cell line. Mitochondrial membrane potential, ΔΨm, was measured by flow cytometry (BD LSRII at the Northwestern Flow Cytometry Core) for TMRE (purchased from Life Technologies)-stained cells. In brief, cells were trypsinized and immediately stained with 50 nM TMRE for 30 min. Cells were washed twice with PBS after staining and suspended in 1 mL of PBS. CCCP-treated cells were treated for 15 min to replicate conditions during live-cell PWS imaging. At least 20,000 cells were selected by forward- and side-scattering channels for each group, with a double elimination of doublets from the final analysis. Mean TMRE intensity from each replicate population was used for representative comparison between treated and untreated groups.
Supplementary Material
Acknowledgments
MDA-MB-231 cells were provided by the O’Halloran Laboratory at Northwestern University Evanston, IL. TEM was performed at the Biological Imaging Facility at Northwestern University. Flow cytometry was performed by the Northwestern University Flow Cytometry Facility, which received support from National Cancer Institute Grant CA060553. This material was based on work supported by a National Science Foundation Graduate Research Fellowship under Grant DGE-082416; National Science Foundation Grants CBET-1249311 and CBET-1240416; National Institutes of Health (NIH) Grants U54CA193419, R01CA200064, R01CA155284, and R01CA165309; NIH T32 Training Grants T32GM008152 and T32HL076139; and Chicago Biomedical Consortium Lever Award L-006 for the Chicago Center for Physical Science Oncology Innovation and Translation.
Footnotes
Conflict of interest statement: V.B., H.S., and H.K.R. are cofounders of Nanocytomics, LLC.
This article is a PNAS Direct Submission.
This article contains supporting information online at www.pnas.org/lookup/suppl/doi:10.1073/pnas.1608198113/-/DCSupplemental.
References
- 1.Klar TA, Jakobs S, Dyba M, Egner A, Hell SW. Fluorescence microscopy with diffraction resolution barrier broken by stimulated emission. Proc Natl Acad Sci USA. 2000;97(15):8206–8210. doi: 10.1073/pnas.97.15.8206. [DOI] [PMC free article] [PubMed] [Google Scholar]
- 2.Rust MJ, Bates M, Zhuang X. Sub-diffraction-limit imaging by stochastic optical reconstruction microscopy (STORM) Nat Methods. 2006;3(10):793–795. doi: 10.1038/nmeth929. [DOI] [PMC free article] [PubMed] [Google Scholar]
- 3.Betzig E, et al. Imaging intracellular fluorescent proteins at nanometer resolution. Science. 2006;313(5793):1642–1645. doi: 10.1126/science.1127344. [DOI] [PubMed] [Google Scholar]
- 4.Jing C, Cornish VW. Chemical tags for labeling proteins inside living cells. Acc Chem Res. 2011;44(9):784–792. doi: 10.1021/ar200099f. [DOI] [PMC free article] [PubMed] [Google Scholar]
- 5.Lelek M, et al. Superresolution imaging of HIV in infected cells with FlAsH-PALM. Proc Natl Acad Sci USA. 2012;109(22):8564–8569. doi: 10.1073/pnas.1013267109. [DOI] [PMC free article] [PubMed] [Google Scholar]
- 6.Mirny LA. The fractal globule as a model of chromatin architecture in the cell. Chromosome Res. 2011;19(1):37–51. doi: 10.1007/s10577-010-9177-0. [DOI] [PMC free article] [PubMed] [Google Scholar]
- 7.Cremer T, et al. Chromosome territories, interchromatin domain compartment, and nuclear matrix: An integrated view of the functional nuclear architecture. Crit Rev Eukaryot Gene Expr. 2000;10(2):179–212. [PubMed] [Google Scholar]
- 8.Eltsov M, Maclellan KM, Maeshima K, Frangakis AS, Dubochet J. Analysis of cryo-electron microscopy images does not support the existence of 30-nm chromatin fibers in mitotic chromosomes in situ. Proc Natl Acad Sci USA. 2008;105(50):19732–19737. doi: 10.1073/pnas.0810057105. [DOI] [PMC free article] [PubMed] [Google Scholar]
- 9.Joti Y, et al. Chromosomes without a 30-nm chromatin fiber. Nucleus. 2012;3(5):404–410. doi: 10.4161/nucl.21222. [DOI] [PMC free article] [PubMed] [Google Scholar]
- 10.Maeshima K, Imai R, Tamura S, Nozaki T. Chromatin as dynamic 10-nm fibers. Chromosoma. 2014;123(3):225–237. doi: 10.1007/s00412-014-0460-2. [DOI] [PMC free article] [PubMed] [Google Scholar]
- 11.Boettiger AN, et al. Super-resolution imaging reveals distinct chromatin folding for different epigenetic states. Nature. 2016;529(7586):418–422. doi: 10.1038/nature16496. [DOI] [PMC free article] [PubMed] [Google Scholar]
- 12.Bedin V, Adam RL, de Sá BC, Landman G, Metze K. Fractal dimension of chromatin is an independent prognostic factor for survival in melanoma. BMC Cancer. 2010;10:260. doi: 10.1186/1471-2407-10-260. [DOI] [PMC free article] [PubMed] [Google Scholar]
- 13.Lebedev DV, et al. Fractal nature of chromatin organization in interphase chicken erythrocyte nuclei: DNA structure exhibits biphasic fractal properties. FEBS Lett. 2005;579(6):1465–1468. doi: 10.1016/j.febslet.2005.01.052. [DOI] [PubMed] [Google Scholar]
- 14.Fudenberg G, Getz G, Meyerson M, Mirny LA. High order chromatin architecture shapes the landscape of chromosomal alterations in cancer. Nat Biotechnol. 2011;29(12):1109–1113. doi: 10.1038/nbt.2049. [DOI] [PMC free article] [PubMed] [Google Scholar]
- 15.Bancaud A, Lavelle C, Huet S, Ellenberg J. A fractal model for nuclear organization: Current evidence and biological implications. Nucleic Acids Res. 2012;40(18):8783–8792. doi: 10.1093/nar/gks586. [DOI] [PMC free article] [PubMed] [Google Scholar]
- 16.Lieberman-Aiden E, et al. Comprehensive mapping of long-range interactions reveals folding principles of the human genome. Science. 2009;326(5950):289–293. doi: 10.1126/science.1181369. [DOI] [PMC free article] [PubMed] [Google Scholar]
- 17.Dekker J, Marti-Renom MA, Mirny LA. Exploring the three-dimensional organization of genomes: Interpreting chromatin interaction data. Nat Rev Genet. 2013;14(6):390–403. doi: 10.1038/nrg3454. [DOI] [PMC free article] [PubMed] [Google Scholar]
- 18.Botta M, Haider S, Leung IXY, Lio P, Mozziconacci J. Intra- and inter-chromosomal interactions correlate with CTCF binding genome wide. Mol Syst Biol. 2010;6:426. doi: 10.1038/msb.2010.79. [DOI] [PMC free article] [PubMed] [Google Scholar]
- 19.Li L, et al. Widespread rearrangement of 3D chromatin organization underlies polycomb-mediated stress-induced silencing. Mol Cell. 2015;58(2):216–231. doi: 10.1016/j.molcel.2015.02.023. [DOI] [PMC free article] [PubMed] [Google Scholar]
- 20.Hnisz D, et al. Activation of proto-oncogenes by disruption of chromosome neighborhoods. Science. 2016;351(6280):1454–1458. doi: 10.1126/science.aad9024. [DOI] [PMC free article] [PubMed] [Google Scholar]
- 21.Cherkezyan L, et al. Nanoscale changes in chromatin organization represent the initial steps of tumorigenesis: A transmission electron microscopy study. BMC Cancer. 2014;14:189. doi: 10.1186/1471-2407-14-189. [DOI] [PMC free article] [PubMed] [Google Scholar]
- 22.Cherkezyan L, et al. Interferometric spectroscopy of scattered light can quantify the statistics of subdiffractional refractive-index fluctuations. Phys Rev Lett. 2013;111(3):033903. doi: 10.1103/PhysRevLett.111.033903. [DOI] [PMC free article] [PubMed] [Google Scholar]
- 23.Cherkezyan L, Subramanian H, Backman V. What structural length scales can be detected by the spectral variance of a microscope image? Opt Lett. 2014;39(15):4290–4293. doi: 10.1364/OL.39.004290. [DOI] [PMC free article] [PubMed] [Google Scholar]
- 24.Chandler JE, et al. Colocalization of cellular nanostructure using confocal fluorescence and partial wave spectroscopy. J Biophotonics. April 25, 2016 doi: 10.1002/jbio.201500298. [DOI] [PMC free article] [PubMed] [Google Scholar]
- 25.Stypula-Cyrus Y, et al. HDAC up-regulation in early colon field carcinogenesis is involved in cell tumorigenicity through regulation of chromatin structure. PLoS One. 2013;8(5):e64600. doi: 10.1371/journal.pone.0064600. [DOI] [PMC free article] [PubMed] [Google Scholar]
- 26.Kim JS, Pradhan P, Backman V, Szleifer I. The influence of chromosome density variations on the increase in nuclear disorder strength in carcinogenesis. Phys Biol. 2011;8(1):015004. doi: 10.1088/1478-3975/8/1/015004. [DOI] [PubMed] [Google Scholar]
- 27.Chandler JE, Cherkezyan L, Subramanian H, Backman V. Nanoscale refractive index fluctuations detected via sparse spectral microscopy. Biomed Opt Express. 2016;7(3):883–893. doi: 10.1364/BOE.7.000883. [DOI] [PMC free article] [PubMed] [Google Scholar]
- 28.Rogakou EP, Pilch DR, Orr AH, Ivanova VS, Bonner WM. DNA double-stranded breaks induce histone H2AX phosphorylation on serine 139. J Biol Chem. 1998;273(10):5858–5868. doi: 10.1074/jbc.273.10.5858. [DOI] [PubMed] [Google Scholar]
- 29.Burma S, Chen BP, Murphy M, Kurimasa A, Chen DJ. ATM phosphorylates histone H2AX in response to DNA double-strand breaks. J Biol Chem. 2001;276(45):42462–42467. doi: 10.1074/jbc.C100466200. [DOI] [PubMed] [Google Scholar]
- 30.Olive PL. Detection of DNA damage in individual cells by analysis of histone H2AX phosphorylation. Methods Cell Biol. 2004;75:355–373. doi: 10.1016/s0091-679x(04)75014-1. [DOI] [PubMed] [Google Scholar]
- 31.Banáth JP, Olive PL. Expression of phosphorylated histone H2AX as a surrogate of cell killing by drugs that create DNA double-strand breaks. Cancer Res. 2003;63(15):4347–4350. [PubMed] [Google Scholar]
- 32.Cohen SM, Lippard SJ. Cisplatin: From DNA damage to cancer chemotherapy. Prog Nucleic Acid Res Mol Biol. 2001;67:93–130. doi: 10.1016/s0079-6603(01)67026-0. [DOI] [PubMed] [Google Scholar]
- 33.Burgess RC, Burman B, Kruhlak MJ, Misteli T. Activation of DNA damage response signaling by condensed chromatin. Cell Rep. 2014;9(5):1703–1717. doi: 10.1016/j.celrep.2014.10.060. [DOI] [PMC free article] [PubMed] [Google Scholar]
- 34.Johnson SA, You Z, Hunter T. Monitoring ATM kinase activity in living cells. DNA Repair (Amst) 2007;6(9):1277–1284. doi: 10.1016/j.dnarep.2007.02.025. [DOI] [PubMed] [Google Scholar]
- 35.Beerman TA, et al. Effects of analogs of the DNA minor groove binder Hoechst 33258 on topoisomerase II and I mediated activities. Biochim Biophys Acta. 1992;1131(1):53–61. doi: 10.1016/0167-4781(92)90098-k. [DOI] [PubMed] [Google Scholar]
- 36.Zhang X, Chen J, Davis B, Kiechle F. Hoechst 33342 induces apoptosis in HL-60 cells and inhibits topoisomerase I in vivo. Arch Pathol Lab Med. 1999;123(10):921–927. doi: 10.5858/1999-123-0921-HIAIHC. [DOI] [PubMed] [Google Scholar]
- 37.Kruhlak MJ, et al. Changes in chromatin structure and mobility in living cells at sites of DNA double-strand breaks. J Cell Biol. 2006;172(6):823–834. doi: 10.1083/jcb.200510015. [DOI] [PMC free article] [PubMed] [Google Scholar]
- 38.Daugas E, et al. Mitochondrio-nuclear translocation of AIF in apoptosis and necrosis. FASEB J. 2000;14(5):729–739. [PubMed] [Google Scholar]
- 39.Lakhani SA, et al. Caspases 3 and 7: Key mediators of mitochondrial events of apoptosis. Science. 2006;311(5762):847–851. doi: 10.1126/science.1115035. [DOI] [PMC free article] [PubMed] [Google Scholar]
- 40.Martinez-Pastor B, Cosentino C, Mostoslavsky R. A tale of metabolites: The cross-talk between chromatin and energy metabolism. Cancer Discov. 2013;3(5):497–501. doi: 10.1158/2159-8290.CD-13-0059. [DOI] [PMC free article] [PubMed] [Google Scholar]
- 41.Lum JJ, et al. The transcription factor HIF-1alpha plays a critical role in the growth factor-dependent regulation of both aerobic and anaerobic glycolysis. Genes Dev. 2007;21(9):1037–1049. doi: 10.1101/gad.1529107. [DOI] [PMC free article] [PubMed] [Google Scholar]
- 42.Liu XS, Little JB, Yuan ZM. Glycolytic metabolism influences global chromatin structure. Oncotarget. 2015;6(6):4214–4225. doi: 10.18632/oncotarget.2929. [DOI] [PMC free article] [PubMed] [Google Scholar]
- 43.Visvanathan A, et al. Modulation of higher order chromatin conformation in mammalian cell nuclei can be mediated by polyamines and divalent cations. PLoS One. 2013;8(6):e67689. doi: 10.1371/journal.pone.0067689. [DOI] [PMC free article] [PubMed] [Google Scholar]
- 44.Tice RR, Hook GG, Donner M, McRee DI, Guy AW. Genotoxicity of radiofrequency signals. I. Investigation of DNA damage and micronuclei induction in cultured human blood cells. Bioelectromagnetics. 2002;23(2):113–126. doi: 10.1002/bem.104. [DOI] [PubMed] [Google Scholar]
- 45.Bancaud A, et al. Molecular crowding affects diffusion and binding of nuclear proteins in heterochromatin and reveals the fractal organization of chromatin. EMBO J. 2009;28(24):3785–3798. doi: 10.1038/emboj.2009.340. [DOI] [PMC free article] [PubMed] [Google Scholar]
- 46.Papantonis A, Cook PR. Genome architecture and the role of transcription. Curr Opin Cell Biol. 2010;22(3):271–276. doi: 10.1016/j.ceb.2010.03.004. [DOI] [PMC free article] [PubMed] [Google Scholar]
- 47.Papantonis A, et al. Active RNA polymerases: Mobile or immobile molecular machines? PLoS Biol. 2010;8(7):e1000419. doi: 10.1371/journal.pbio.1000419. [DOI] [PMC free article] [PubMed] [Google Scholar]
- 48.Williamson I, et al. Spatial genome organization: Contrasting views from chromosome conformation capture and fluorescence in situ hybridization. Genes Dev. 2014;28(24):2778–2791. doi: 10.1101/gad.251694.114. [DOI] [PMC free article] [PubMed] [Google Scholar]
- 49.Katada S, Imhof A, Sassone-Corsi P. Connecting threads: Epigenetics and metabolism. Cell. 2012;148(1-2):24–28. doi: 10.1016/j.cell.2012.01.001. [DOI] [PubMed] [Google Scholar]
- 50.Azuara V, et al. Chromatin signatures of pluripotent cell lines. Nat Cell Biol. 2006;8(5):532–538. doi: 10.1038/ncb1403. [DOI] [PubMed] [Google Scholar]
- 51.Hajkova P, et al. Chromatin dynamics during epigenetic reprogramming in the mouse germ line. Nature. 2008;452(7189):877–881. doi: 10.1038/nature06714. [DOI] [PMC free article] [PubMed] [Google Scholar]
- 52.Taflove A, Hagness SC. Computational Electrodynamics. Artech House; Boston: 2005. [Google Scholar]
- 53.Capoglu İR, Rogers JD, Taflove A, Backman V. 2012. The microscope in a computer: Image synthesis from three-dimensional full-vector solutions of Maxwell’s equations at the nanometer scale. Progress in Optics, ed Wolf E (Elsevier, Amsterdam), Vol 57, Chap 1.
- 54.Capoglu IR, Taflove A, Backman V. Angora: A free software package for finite-difference time-domain electromagnetic simulation. IEEE Antennas Propag Mag. 2013;55(4):80–93. [Google Scholar]
- 55.Liang X, Liu A, Lim C, Ayi T, Yap P. Determining refractive index of single living cell using an integrated microchip. Sens Actuators A Phys. 2007;133(2):349–354. [Google Scholar]
- 56.Schmitt JM, Kumar G. Optical scattering properties of soft tissue: A discrete particle model. Appl Opt. 1998;37(13):2788–2797. doi: 10.1364/ao.37.002788. [DOI] [PubMed] [Google Scholar]
- 57.Khintchine A. Korrelationstheorie der stationären stochastischen Prozesse. Math Ann. 1934;109(1):604–615. [Google Scholar]
- 58.Wiener N. Generalized harmonic analysis. Acta Math-Djursholm. 1930;55(1):117–258. [Google Scholar]
Associated Data
This section collects any data citations, data availability statements, or supplementary materials included in this article.


