Significance
Calorie restriction (CR) or methionine (Met) restriction extends the lifespan of diverse model organisms. Here we carefully examined how Met metabolites influenced aging in yeast. We showed that stimulating S-adenosyl-l-methionine (AdoMet) synthesis, which consumes both ATP and Met, resulted in an extended lifespan and was epistatic to CR. Indeed, stimulating AdoMet synthesis led to AMP-activated protein kinase activation and increased lifespan. Furthermore, we revealed an effect of S-adenosyl-l-homocysteine that contributed to longevity with a higher accumulation of AdoMet. The most common CR regimen involves reducing caloric intake, an unpopular trade-off. We have shown that stimulating AdoMet synthesis per se in yeast could produce physiological conditions that mimicked CR.
Keywords: S-adenosyl-l-methionine, S-adenosyl-l-homocysteine, calorie restriction, AMP-activated protein kinase, yeast
Abstract
Dietary restriction (DR), such as calorie restriction (CR) or methionine (Met) restriction, extends the lifespan of diverse model organisms. Although studies have identified several metabolites that contribute to the beneficial effects of DR, the molecular mechanism underlying the key metabolites responsible for DR regimens is not fully understood. Here we show that stimulating S-adenosyl-l-methionine (AdoMet) synthesis extended the lifespan of the budding yeast Saccharomyces cerevisiae. The AdoMet synthesis-mediated beneficial metabolic effects, which resulted from consuming both Met and ATP, mimicked CR. Indeed, stimulating AdoMet synthesis activated the universal energy-sensing regulator Snf1, which is the S. cerevisiae ortholog of AMP-activated protein kinase (AMPK), resulting in lifespan extension. Furthermore, our findings revealed that S-adenosyl-l-homocysteine contributed to longevity with a higher accumulation of AdoMet only under the severe CR (0.05% glucose) conditions. Thus, our data uncovered molecular links between Met metabolites and lifespan, suggesting a unique function of AdoMet as a reservoir of Met and ATP for cell survival.
The two metabolic intermediates, S-adenosyl-l-methionine (AdoMet) and S-adenosyl-l-homocysteine (AdoHcy), are key intermediates of methionine (Met) metabolism (1). AdoMet-dependent transmethylation is central to the regulation of numerous biological processes, including metabolism, signal transduction, and gene expression (1). Recent studies have documented the contribution of AdoMet-dependent transmethylation to the modulation of the lifespan in yeasts, worms, and flies (2, 3). In transmethylation reactions, AdoMet is converted to AdoHcy, an inhibitor of methyltransferases (1).
There has been considerable interest in the ability of dietary restriction (DR) to both improve health and increase longevity (4–6). DR, such as calorie restriction (CR) or Met restriction, extends the lifespan of a wide range of species (4–9). Although we have knowledge of several metabolites that contribute to the beneficial effects of DR (10–12), the molecular mechanism underlying the key metabolites responsible for DR regimens is far from complete.
In this study, we examined how Met metabolites influenced the lifespan of yeast. We found that stimulating AdoMet synthesis, which consumes both Met and ATP, resulted in extended lifespan and was epistatic to CR. Indeed, stimulating AdoMet synthesis led to AMP-activated protein kinase (AMPK) activation and increased lifespan. Unexpectedly, we discovered a unique effect of AdoHcy: that is, that stimulation of AdoMet synthesis resulted in lifespan extension and was epistatic to CR.
Results
Identification of SSG1-1 Mutants That Extended Lifespan.
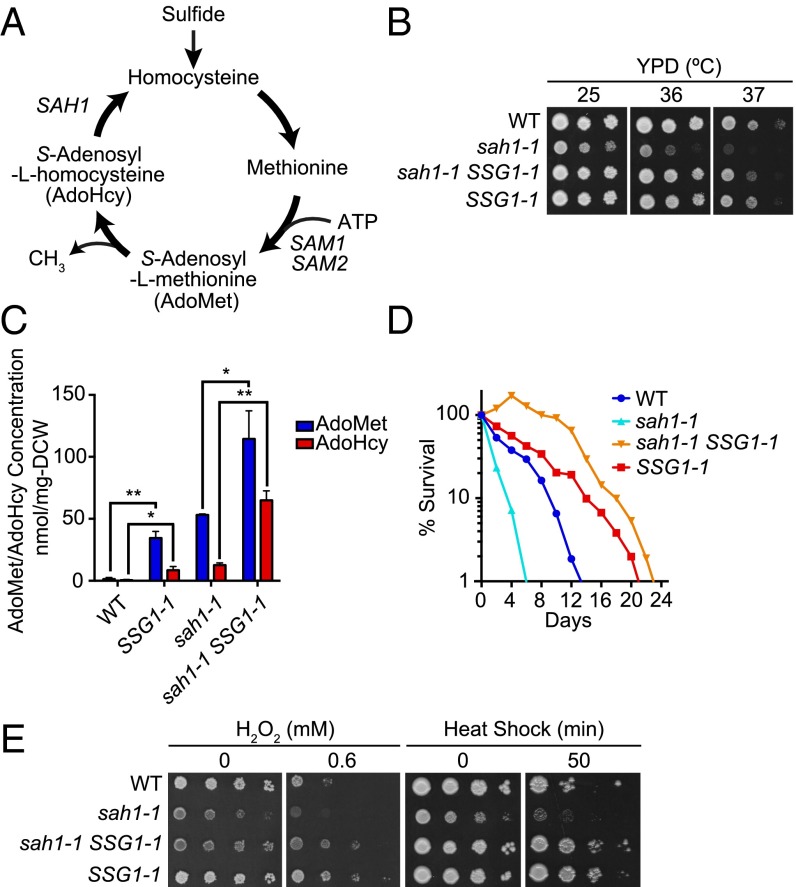
AdoMet is a central coenzyme in the metabolism that occurs in the majority of biological methylation reactions (1). AdoHcy is a competitive inhibitor of the methylation reactions catalyzed by the AdoMet-dependent methyltransferases. Therefore, the Saccharomyces cerevisiae SAH1, encoding AdoHcy hydrolase and hydrolyzing AdoHcy to adenosine and homocysteine (Fig. 1A), is an essential gene for cell growth. Previously we found that mutation of sah1-1 slowed growth at all temperatures examined (25∼37 °C) and led to the accumulation of AdoHcy and AdoMet (13) (Fig. 1 B and C). Because the homeostasis of cellular metabolism is closely linked to lifespan (14), we measured the chronological lifespan (CLS) by monitoring the survival periods of nondividing yeast cells that had passed the postdiauxic phase (15). As shown in Fig. 1D, the sah1-1 mutant had a shortened CLS.
Fig. 1.
SSG1-1, a dominant mutation, suppressed slow growth of the sah1-1 strain and extended CLS. (A) Schematic diagram of methionine metabolism. (B) Growth of various strains on solid YPD medium. Serial dilutions of cells were spotted onto the plates, which were then incubated for 2∼3 d at 25 °C, 36 °C, or 37 °C. (C) Intracellular AdoMet and AdoHcy levels. Mean ± SD (n = 3); *P < 0.05; **P < 0.01 (t test, two-tailed, parametric unequal variance). (D) CLS curve. (E) Hydrogen peroxide stress and heat-shock stress tests. Tenfold serially diluted cells were spotted onto solid medium containing 0.6 mM hydrogen peroxide (SDC plates at 25 °C) or were subjected to heat-shock treatment at 55 °C in YPD plates, which were then transferred to 25 °C and incubated for 3 d.
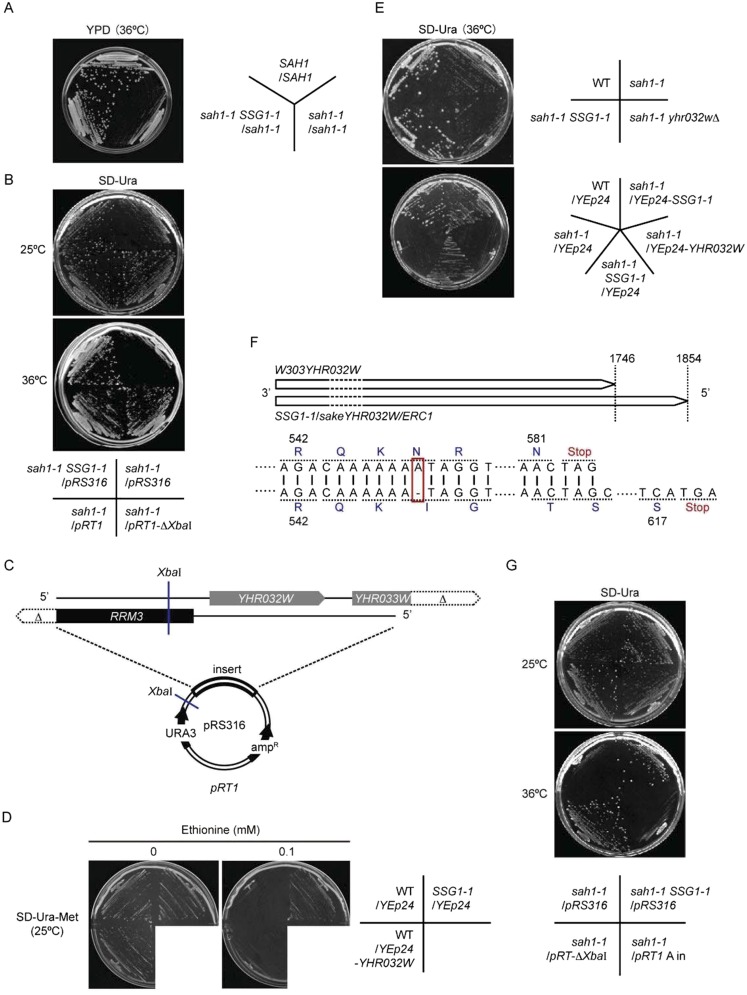
To obtain a new regulator of lifespan, we screened for suppression of the sah1-1 growth defect at elevated temperatures (36–37 °C). In this screening, 15 intragenic suppressors in the sah1-1 gene were obtained. The remaining 101 suppressor mutants had dominant mutations that could be classified into one complementation group, designated SSG1, for the spontaneous suppression of growth-delay in sah1-1 (Fig. S1A). One of these mutants, designated SSG1-1, was chosen for further study. Cloning and sequencing of the gene that suppressed the slow-growth of the sah1-1 strain suggested that the SSG1-1 mutation was an allele of the YHR032W (Fig. S1 B and C). YHR032W has high sequence similarity with the multidrug and toxin extrusion family of transporters, and overexpression of the YHR032W (designated as ERC1) in the S. cerevisiae DKD-5D-H strain background confers ethionine resistance and AdoMet accumulation. However, the details of its function are unknown (16, 17). Although the SSG1-1 mutants showed resistance to ethionine, overexpression of the YHR032W (W303YHR032W) in our strain background (W303-1A) failed to increase ethionine resistance (Fig. S1D). Moreover, neither deletion nor overexpression of W303YHR032W could suppress the slow growth of the sah1-1 mutant (Fig. S1E). A comparison of the SSG1-1 and W303YHR032W sequences revealed the presence of a single-base deletion at any one of the seven adenine nucleotide (A) repeats at a position between +1628 and +1634 of the coding region (Fig. S1F). This frameshift mutation was predicted to yield a protein with its C-terminal sequences altered from position 545, resulting in a protein that was 36 amino acids longer relative to Yhr032w. Because the insertion of an A at the same position failed to suppress the slow growth of the sah1-1 strain (Fig. S1G), the A-deletion mutation was suggested to be responsible for the observed phenotypes. Interestingly, we found that the SSG1-1 had the identical sequences with the ERC1 gene (Fig. S1F). The nature of the SSG1-1 may explain the gain-of-function in these phenotypes over the W303YHR032W allele. For this reason, we used the SSG1-1 mutant allele in most of the subsequent experiments.
Fig. S1.
The SSG1-1 is a dominant mutation in the YHR032W. (A) SSG1-1 is a dominant mutation. Diploid strains were spotted on YPD plates and grown at 36 °C (2 d). (B) Ability of low-copy plasmids to restore the sah1-1 phenotype. Cells harboring the indicated plasmid were spotted on SD-Ura plates and grown at 25 °C (3 d) or 36 °C (2 d). (C) Map of the ORFs inserted in plasmid pRT1. (D) Ethionine resistance test. Cells harboring the indicated plasmids were streaked onto SD-Ura-Met plates with or without 0.1 mM ethionine and grown at 25 °C (3 d). (E) Effect of deletion (Upper) or overexpression (Lower) of YHR032W in sah1-1 strain. Cells were grown on SD-Ura plates at 36 °C (2 d). (F) Diagrams of YHR032 and SSG1-1 sequences showing the mutation site. (G) Effect of insertion of an A in the SSG1-1. Cells harboring the indicated plasmids were spotted on SD-Ura plates and grown at 25 °C (3 d) or 36 °C (2 d).
The growth defect of sah1-1 can be suppressed by exogenous AdoMet but not AdoHcy (13), and overexpression of the ERC1 results in the accumulation of AdoMet (16, 17). Therefore, the ability of the SSG1-1 mutation to suppress the slow growth of the sah1-1 strain led us to hypothesize that AdoMet levels might be increased in the sah1-1 SSG1-1 cells. To test this possibility, we measured AdoMet levels in cell extracts by performing capillary liquid electrophoresis analysis. As anticipated, the sah1-1 SSG1-1 and SSG1-1 mutants contained higher levels of AdoMet than sah1-1 and WT, respectively (Fig. 1C). We found that the AdoHcy levels were also increased in the presence of an SSG1-1 mutation (Fig. 1C). To investigate whether the SSG1-1 mutation could suppress the short-lived characteristic of sah1-1 cells, we measured the CLS (Fig. 1D). Indeed, not only sah1-1 SSG1-1 cells but also SSG1-1 single mutants were shown to have a longer CLS, suggesting that the Ssg1-1 protein might play a role in longevity. Because long-lived mutants are occasionally more resistant to oxidative and thermal stress (18), we examined the stress resistance of the mutant strains and found that SSG1-1 cells showed increased stress resistance (Fig. 1E). Therefore, we speculated that SSG1-1 and AdoMet might be linked to longevity.
Stimulating AdoMet Synthesis Resulted in Extended Lifespan.
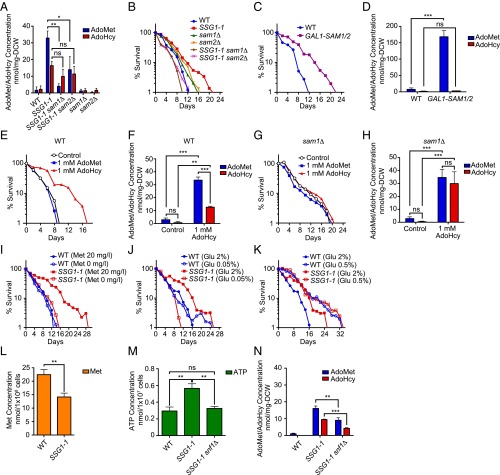
The AdoMet synthetase genes (SAM1 and SAM2) of S. cerevisiae catalyze the biosynthesis of AdoMet (1) (Fig. 1A). Because AdoMet levels were elevated in SSG1-1 cells, we determined if CLS extension by SSG1-1 was mediated by AdoMet synthesis in the strains deleted for the SAM1 and SAM2 encoding AdoMet synthetase. As the growth of sam1Δ sam2Δ cells is synthetic lethal (1), we constructed SSG1-1 sam1Δ and SSG1-1 sam2Δ double-mutant strains. The AdoMet levels were lower in both the SSG1-1 sam1Δ and SSG1-1 sam2Δ compared with the level in the SSG1-1 cells (Fig. 2A). Indeed, the extended CLS of SSG1-1 was eliminated by the deletion of either SAM1 or SAM2 (Fig. 2B). We next tested whether indeed AdoMet synthesis extended yeast CLS. We performed aging experiments using WT cells carrying an extra copy of the SAM1 and SAM2 genes from the GAL1 promoter integrated into its genome. Strikingly, overexpressing SAM1 and SAM2 in WT cells significantly extended their CLS (Fig. 2C), concomitant with a high accumulation of AdoMet (Fig. 2D).
Fig. 2.
Increased AdoMet production by AdoMet synthetase extended CLS. (A) The AdoMet and AdoHcy contents were measured. Mean ± SD (n = 3); ns, not significant; *P < 0.05; **P < 0.01 (t test, two-tailed, parametric unequal variance). (B) CLS curve. (C and D) Effect of overexpression of SAM1 and SAM2 in WT on CLS (C) and on AdoMet and AdoHcy levels (D). Cells in SGC medium (+ 2% galactose medium, GAL1 promoter turned on) were measured. ns, not significant; ***P < 0.001 (t test, two-tailed, parametric unequal variance). (E–H) Effect of AdoMet or AdoHcy administration on CLS (E and G) and on AdoMet and AdoHcy levels (F and H) of WT or sam1Δ cells. Intracellular AdoMet and AdoHcy levels were quantified. Mean ± SD (n = 3); ns, not significant; **P < 0.01; ***P < 0.001 (two-way ANOVA with Tukey’s multiple comparisons test, F and H). (I–K) SSG1-1 cells required Met or glucose for longevity. CLS curves are shown. Met (L) and ATP levels (M) of cells are shown. ns, not significant; **P < 0.01 (t test, two-tailed, parametric unequal variance). (N) The AdoMet and AdoHcy contents were measured. Mean ± SD (n = 3); **P < 0.01; ***P < 0.001 (t test, two-tailed, parametric unequal variance).
On the other hand, supplementing the medium with AdoMet was unable to extend the CLS of the WT cells (Fig. 2E). In contrast, extracellular AdoHcy contributed to an extended CLS with a higher accumulation of AdoMet than of AdoHcy (Fig. 2 E and F). It should be noted that we could not detect the AdoMet or AdoHcy levels in the culture medium in this experiment. In contrast, externally added AdoHcy had no effect on the CLS of sam1Δ (Fig. 2G), in which the increase in their AdoMet level was not more than that of AdoHcy (Fig. 2H). Taken together, these data showed that CLS extension by SSG1-1 was dependent on AdoMet synthesis and suggested that stimulating AdoMet synthesis per se could promote longevity.
Stimulating AdoMet Synthesis-Mediated Longevity Is Epistatic to CR.
AdoMet synthesis requires both Met and ATP (Fig. 1A). In SSG1-1 cells, which can consume Met and ATP during chronological aging, higher amounts of AdoMet accumulated (Fig. 1C). All organisms produce ATP by glycolysis through the degradation of glucose. Met or glucose restriction was reported to cause lifespan extension in many eukaryotes (4–9). Thus, we assumed that consumption of Met and glucose for AdoMet synthesis was required for extended CLS in SSG1-1 and that the CLS of SSG1-1 would be diminished by limiting either the Met or glucose concentration in the medium. Indeed, we found that with Met-depletion or when the glucose concentration was limited to 0.05%, the CLS of SSG1-1 could not be extended (Fig. 2 I and J). On the other hand, we found that treatment with 0.05% glucose slightly but reproducibly increased the maximum CLS of the WT (Fig. 2J). These results support the idea that consumption of Met and ATP in the SSG1-1 cells contributed to the extended CLS. It should be noted that whereas SSG1-1 is a methionine-prototrophic strain, the CLS of SSG1-1 was not extended when Met was depleted from the medium, suggesting that the intake of extracellular Met was required for lifespan extension. We asked whether Met and ATP levels were decreased in the SSG1-1. Indeed, Met levels in the SSG1-1 cells were lower than those in the WT cells (Fig. 2L). Unexpectedly, however, SSG1-1 cells showed increased ATP levels (Fig. 2M), suggesting that SSG1-1 might act to stimulate AdoMet synthesis by amplifying ATP levels.
A 0.5% glucose concentration has been used for CR studies in yeast, resulting in an extended CLS (15). We noted that the CLS of the SSG1-1 strain, when grown on 0.5% glucose, was equivalent to that of the WT strain (Fig. 2K), suggesting that a common pathway may underlie the regulatory mechanism for longevity between CR and the SSG1-1–mediated mechanism.
To investigate the basis for stimulating AdoMet synthesis-mediated longevity, we conducted DNA microarray analysis using SSG1-1 and WT cells (Table S1). We identified genes whose expression was increased more than twofold in the SSG1-1 cells. In total, 21 genes were induced more than twofold, which included those involved in Met biosynthesis and inorganic phosphate metabolism, consistent with the high production of AdoMet (19) in the SSG1-1 cells (Table S1). In addition, we found that high-affinity glucose-transporter HXT genes and glucose-metabolism genes, which are associated with CR (20) (0.5% glucose), were significantly up-regulated (Table S1). Thus, these data provide further evidence that SSG1-1 and CR shared a common pathway to confer longevity.
Table S1.
Significant up-regulated genes in the SSG1-1 strains relative to WT strains
| Systematic name | Standard name | Ratio (SSG1-1 vs. WT) | P value | Description |
| YLR301W | HRI1 | 9.58 | 0.0216 | Protein of unknown function |
| YFR053C | HXK1 | 7.97 | 0.0522 | Hexokinase isoenzyme 1 |
| YLR327C | TMA10 | 5.88 | 0.0616 | Protein of unknown function |
| YHR092C | HXT4 | 4.07 | 0.0130 | High-affinity glucose transporter |
| YDR277C | MTH1 | 3.47 | 0.0012 | Negative regulator of the glucose-sensing signal transduction pathway |
| YLR312C | ATG39 | 3.34 | 0.0070 | Autophagy receptor with a role in degradation of the endoplasmic reticulum and nucleus |
| YBR296C | PHO89 | 2.83 | 0.0603 | Plasma membrane Na+/Pi cotransporter |
| YLL062C | MHT1 | 2.72 | 0.0283 | S-methylmethionine-homocysteine methyltransferase |
| YMR251W | GTO3 | 2.72 | 0.0068 | ω-Class glutathione transferase |
| YMR280C | CAT8 | 2.43 | 0.0059 | Zinc cluster transcriptional activator |
| YFR023W | PES4 | 2.37 | 0.0447 | Poly(A) binding protein |
| YKL001C | MET14 | 2.27 | 0.0177 | Adenylylsulfate kinase |
| YLR092W | SUL2 | 2.25 | 0.0019 | High-affinity sulfate permease |
| YJR010W | MET3 | 2.24 | 0.0383 | ATP sulfurylase |
| YMR303C | ADH2 | 2.21 | 0.0237 | Glucose-repressible alcohol dehydrogenase II |
| YBR285W | — | 2.18 | 0.0008 | Putative protein of unknown function |
| YAL067C | SEO1 | 2.15 | 0.0013 | Putative permease |
| YOR382W | FIT2 | 2.08 | 0.0025 | Mannoprotein that is incorporated into the cell wall |
| YML054C | CYB2 | 2.06 | 0.0270 | Cytochrome b2 (l-lactate cytochrome-c oxidoreductase) |
| YDL181W | INH1 | 2.04 | 0.0041 | Protein that inhibits ATP hydrolysis by the F1F0-ATP synthase |
| YKL217W | JEN1 | 2.03 | 0.0060 | Monocarboxylate/proton symporter of the plasma membrane |
Genes are listed with twofold expression differences between SSG1-1 and WT. Genes with adjusted P values for the expression difference larger than 0.1 are discarded (unpaired t test).
Stimulating AdoMet Synthesis Led to AMPK Activation.
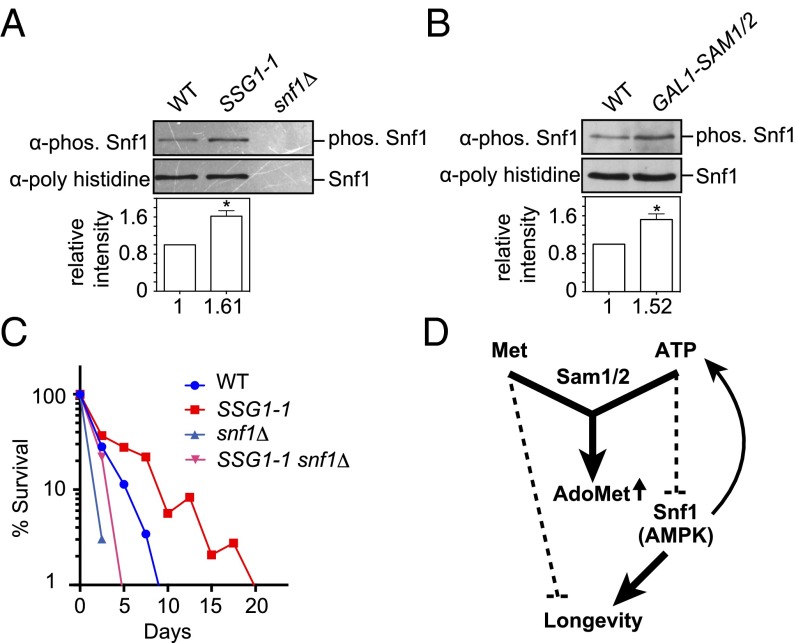
Snf1 is the central component of the glucose-repression pathway and is orthologous to the mammalian AMPK (21). Thus, we anticipated that Snf1 would be activated in the SSG1-1 cells. Snf1 activity can be monitored by the phosphorylation of residue Thr210 of Snf1 (22). Compared with that in WT cells, phosphorylation of Thr210 was increased in SSG1-1 cells (Fig. 3A), supporting the hypothesis that Snf1 was indeed activated. We confirmed that stimulating AdoMet synthesis modulated the activity of Snf1. We found that overexpression of SAM1 and SAM2 did cause an increase in Snf1 phosphorylation (Fig. 3B).
Fig. 3.
SSG1-1- or stimulated AdoMet synthesis-mediated longevity associated with activation of AMPK. (A) Phosphorylation levels of Snf1 residue Thr210. Phosphorylation levels were quantified by ImageJ, and relative intensity normalized to total Snf1 is indicated below each band. Mean ± SD (n = 3); *P < 0.05 (t test, two-tailed, parametric unequal variance). (B) Effect of overexpression of SAM1 and SAM2 on Snf1 phosphorylation levels. Phosphorylation levels were quantified by ImageJ, and relative values normalized to total Snf1 are indicated below each band. Mean ± SD (n = 3); *P < 0.05 (t test, two-tailed, parametric unequal variance). (C) CLS curve is shown. (D) Model for stimulated AdoMet synthesis-mediated longevity in yeast.
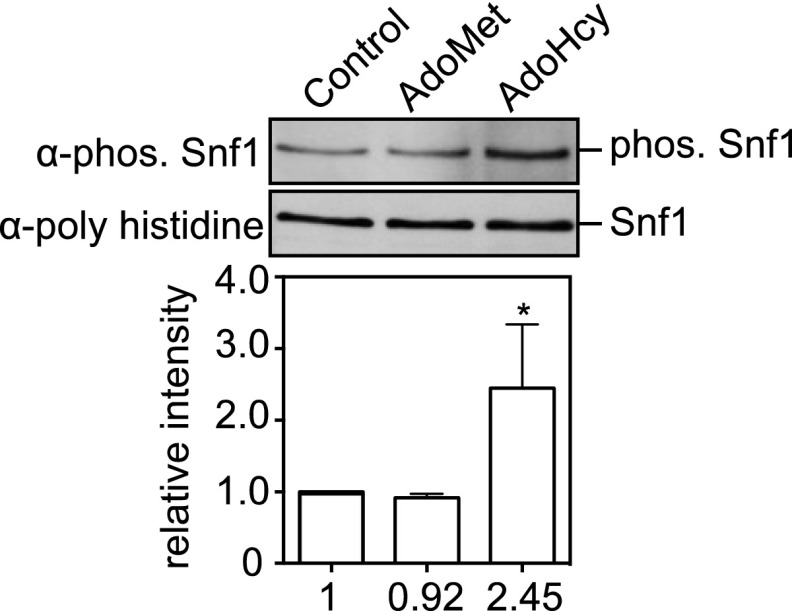
Snf1 activity correlates with a high ADP:ATP ratio (23); however, Snf1 was activated in the SSG1-1 cells even though the ATP level was increased (Fig. 2M). These seemingly paradoxical results led us to examine the effect of SNF1 deletion on ATP levels in the SSG1-1 cells. We found that ATP levels were decreased in the SSG1-1 snf1Δ mutants (Fig. 2M), suggesting that Snf1 enhanced processes that generate ATP or inhibit others that consume ATP when cells are stimulate to have higher AdoMet levels, as in the SSG1-1 cells. Interestingly, we found that AdoMet levels were reduced in the SSG1-1 snf1Δ mutants (Fig. 2N). Together, these data suggest that Snf1 was activated by stimulating AdoMet synthesis, which contributed to sustaining AdoMet levels by amplifying ATP (Fig. 3D). This mechanism of action is the subject of future investigations.
To test the role of SNF1 in CLS, we generated SSG1-1 snf1Δ mutants. The CLS of the double mutant was decreased compared with that of the SSG1-1 (Fig. 3C), suggesting that Snf1 might have been required for extending the CLS of SSG1-1. However, because the SNF1 single-deletion mutants showed a shortened CLS (Fig. 3C), it is difficult to conclude that Snf1 mediated the CLS extension in SSG1-1. These results suggest that the beneficial effect of stimulating AdoMet synthesis was exerted, at least in part, through the activation of Snf1 (Fig. 3D).
Physiological Roles of AdoMet and AdoHcy in Lifespan.
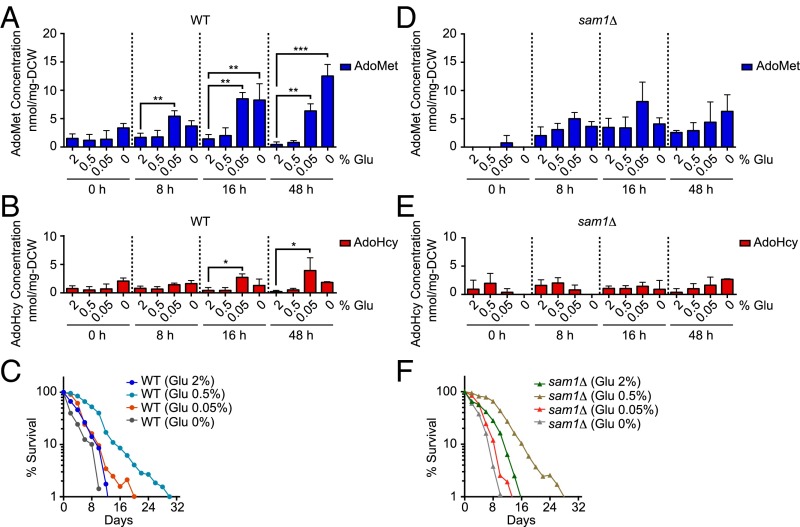
What is a physiologically relevant stimulus for AdoMet synthesis? Schizosaccharomyces pombe cells growing in medium containing a low glucose concentration of around 2.2 mM (about 0.04%) accumulate AdoMet (24); and Snf1 activity positively correlates with severe CR (0.05% glucose) (22). Thus, we hypothesized that cells faced with severe CR are channeled into AdoMet synthesis, which would be beneficial for longevity. We therefore checked whether the amount of AdoMet would be increased in the case of severe CR. Consistent with the previous report on S. pombe, S. cerevisiae WT cells also showed a significantly increased AdoMet level upon severe CR (0.05% glucose) (Fig. 4A). This severe CR increased the maximum CLS of WT cells compared with that for the control cells (2% glucose) (Fig. 4C). We further found that the AdoHcy level was also increased upon severe CR (Fig. 4B), which contributed to the accumulation of AdoMet as observed in Fig. 2E. In contrast, the amount of AdoMet and AdoHcy in sam1Δ cells upon severe CR remained unchanged (Fig. 4 D and E), and these cells showed a CLS similar to that of the controls (2% glucose) (Fig. 4F). Taken together, these data indicate that stimulation of AdoMet synthesis in cells under severe CR contributed to the maintenance of cell viability. Because SSG1-1 mutants and severe CR-treated cells contained AdoHcy, these results further suggested that AdoHcy triggered the stimulation of AdoMet synthesis, leading to an extended CLS under these physiological conditions.
Fig. 4.
Severe CR (0.05% glucose) promoted AdoMet production dependent on AdoMet synthetase, leading to extended maximum CLS. Intracellular AdoMet (A and D) and AdoHcy levels (B and E) or CLS (C and F) under several glucose-limited conditions are shown. Intracellular AdoMet and AdoHcy levels were quantified. Mean ± SD (n = 3). *P < 0.05; **P < 0.01; ***P < 0.001 (one-way ANOVA with Tukey’s multiple comparisons test; A, B, D, and E).
Although, glucose starvation (0% glucose) caused a significantly increased AdoMet level in WT cells (Fig. 4A), no beneficial effect of this increase on CLS was observed (Fig. 4C). Furthermore, CR (0.5% glucose) caused the most beneficial effect on longevity in WT and sam1Δ cells (Fig. 4 C and F), although AdoMet and AdoHcy synthesis was not stimulated (Fig. 4 A, B, D, and E). Thus, the contribution of stimulation of AdoMet synthesis to the longevity appears to be specific to the severe CR condition.
Discussion
Recent studies have documented that AdoMet-dependent transmethylation modulates the lifespan in yeasts, worms, and flies (2, 3). Here, we presented evidence that stimulating AdoMet synthesis turned on a metabolic switch that led to enhanced stress resistance and longevity. We identified a dominant mutation, SSG1-1, in the YHR032W as an allele for longevity. Interestingly, as far as we have examined, we found that every industrial yeast (e.g., sakeYHR032W in the sake yeast Kyokai no. 7 strain and ERC1 in the DKD-5D-H, which is a hybrid strain between sake and laboratory yeast) has the same sequence of SSG1-1 (16, 25), whereas laboratory yeasts (e.g., W303, S288C, and FL100, except for Σ1278b) do not have an adenine nucleotide deletion (Fig. S1F). Sake yeasts accumulate AdoMet at higher levels than laboratory yeasts (26), suggesting that it might be advantageous to reserve Met and ATP in the form of AdoMet to confer stress resistance and longevity to overcome periods of excess glucose/ATP that occur during fermentation. We speculate that yeasts in their natural environment are faced with variable carbon supplies and, therefore, accumulate AdoMet as a stable energy and nutrient source. In contrast, we propose that the laboratory yeast YHR032W locus lost its function during evolution because of the proper/controlled amount of nutrients that promoted cell growth. In this regard, it would be worth noting that the SSG1-1 mutation could be readily generated by a single-base deletion at any one of the seven repeats of the adenine nucleotide and, conversely, that the reverse mutations would be facilitated by the insertion of a single adenine nucleotide to the repeated sequences in response to environment changes.
Christopher et al. proposed that the AdoMet:AdoHcy ratio is important, and if the ratio exceeded a threshold value, there was no growth inhibitory effect (27). Consistent with their observations, we found that the inhibitory effect of AdoHcy was abrogated in the simultaneous presence of AdoMet (13). However, it seems difficult to explain the negative or positive physiological effects because of cellular accumulation of AdoMet and AdoHcy simply in terms of the AdoMet:AdoHcy ratio. The accumulation of AdoHcy per se appears to inhibit cell growth and increases stress sensitivity in the sah1-1 strain (13). In contrast, although the AdoMet:AdoHcy ratio in the SSG1-1 strain is apparently similar to that of the sah1-1 strain, the cell growth was WT level (stress resistance was better than WT).
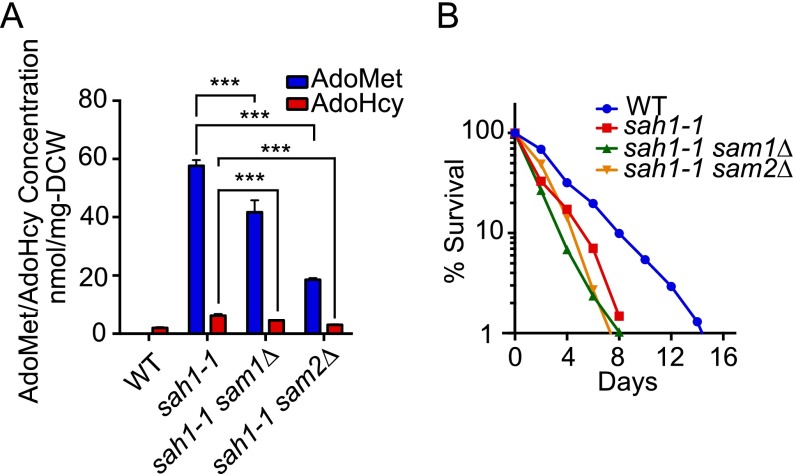
Why does SSG1-1 but not the sah1-1 mutant extended CLS, despite the accumulation of AdoMet and AdoHcy in both strains (Fig. 1 C and D)? We demonstrated that deletion of SAM1 or SAM2 in SSG1-1 reduced the AdoMet levels, leading to a loss of the beneficial effect on CLS (Fig. 2 A and B). The sah1-1 strain also showed a reduced level of AdoMet when the SAM1 or SAM2 was deleted (Fig. S2A), suggesting that sah1-1 and SSG1-1 accumulated AdoMet by the same mechanism. However, the CLS of sah1-1 cells was unaffected by the deletion of SAM1 or SAM2 (Fig. S2B). Therefore, some additional mechanisms appeared to exist on the effects of AdoMet/AdoHcy on lifespan extension. It was reported that elevated levels of AdoMet are detrimental to yeast if the excess AdoMet cannot be sequestered in their vacuole (28). Thus, the benefical effect of SSG1-1 on lifespan may be explained by the accumulation of AdoMet and AdoHcy in the yeast vacuole. This possibility warrants further study.
Fig. S2.
AdoMet synthetase had no effect on the CLS of sah1-1. (A) The AdoMet and AdoHcy contents were measured. Mean ± SD (n = 3); ***P < 0.001 (t test, two-tailed, parametric unequal variance). (B) CLS curve.
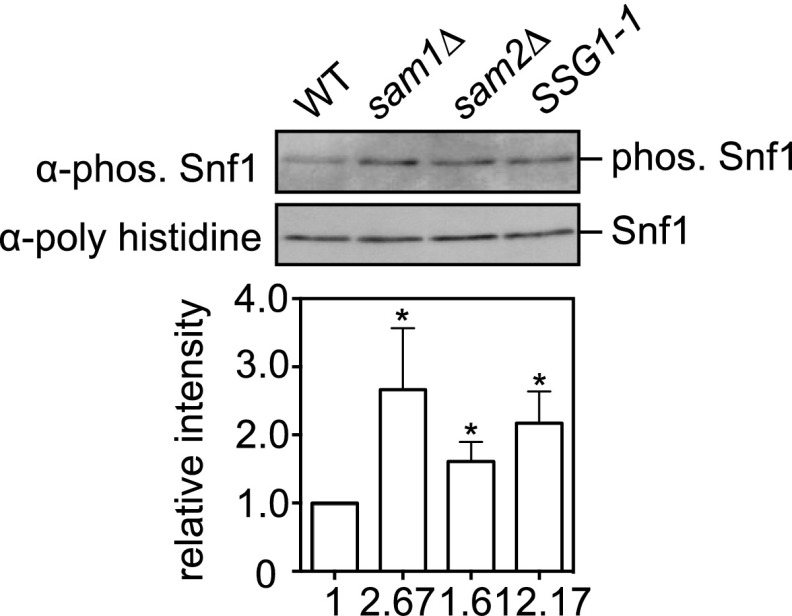
We noted that deleting SAM1 or SAM2 slightly extended the maximum CLS compared with that of the WT (Fig. 2B), consistent with the observations that knocking down sams-1 (AdoMet synthetase of Caenorhabditis elegans) by RNA interference in adults increases the lifespan of C. elegans and sams-1 loss-of-function mutants have an increased lifespan (29, 30). Because Sam1/2 is required for Met and ATP to synthesize AdoMet and sam1Δ sam2Δ double-mutant cells show AdoMet auxotrophy (1), decreased methylation capacity (sam1Δ or sam2Δ) may allow a cell to sense a Met or ATP restriction. Indeed, we found that Snf1 activity was elevated in the sam1Δ or sam2Δ cells (Fig. S3).
Fig. S3.
Snf1 activity was elevated in the sam1Δ or sam2Δ cells. Phosphorylation levels of Snf1 residue Thr210. Phosphorylation levels were quantified by ImageJ, and relative intensity normalized to total Snf1 is indicated below each band. Mean ± SD (n = 3); *P < 0.05 (t test, two-tailed, parametric unequal variance).
At this point, it is unknown why CR (0.5% glucose) caused the most beneficial effect on longevity, although glucose starvation (0% glucose) had the detrimental effect on CLS (Fig. 4C). Previous study showed that CR maintains consistent ATP levels by enhanced mitochondrial metabolism during the chronological aging (31). Consistent with this finding, we found that SSG1-1 cells showed increased ATP levels during the exponential growth phase (Fig. 2M). By contrast, acute glucose starvation may not be able to maintain ATP levels. It is possible that there may be a certain threshold of concentrations of glucose that maintained mitochondrial function contributing to extend CLS of yeast.
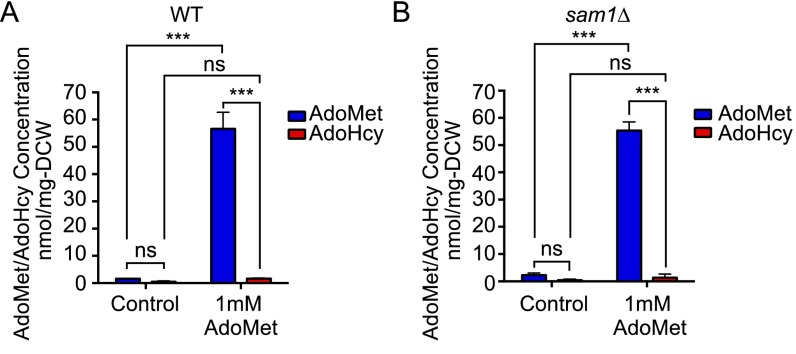
Our previous study proposed that the elevation of the cellular AdoMet level in sah1-1 cells would seem to be the result of the activation of an unidentified compensatory mechanism to alleviate the inhibitory effect of AdoHcy on cell growth (13). In the work reported here, we shed additional light on the effect of AdoHcy in yeast. We noted that when SAM1/2 was overexpressed or AdoMet was administered, the cells did not accumulate AdoHcy (Fig. 2D and Fig. S4). In contrast, administration of AdoHcy caused stimulation of AdoMet synthesis in WT (Fig. 2F), as in the sah1-1 cells. Moreover, externally added AdoHcy, but not AdoMet, activated Snf1 (Fig. S5), resulting in lifespan extension (Fig. 2E). Thus, an unidentified compensatory mechanism—along with Snf1-activation—to alleviate the inhibitory effect of AdoHcy on cell growth will be important for this lifespan extension.
Fig. S4.
Administration of AdoMet had no effect on AdoHcy levels of WT or sam1Δ cells. Quantification of intracellular AdoMet and AdoHcy levels of WT (A) or sam1Δ cells (B). Mean ± SD (n = 3); ns, not significant; ***P < 0.001 (two-way ANOVA with Tukey’s multiple comparisons test).
Fig. S5.
Externally added AdoHcy, but not AdoMet, activated Snf1. Phosphorylation levels of Snf1 residue Thr210. Phosphorylation levels were quantified by ImageJ, and relative intensity normalized to total Snf1 is indicated below each band. Mean ± SD (n = 3); *P < 0.05 (t test, two-tailed, parametric unequal variance).
AdoHcy has received much attention as a risk factor for many diseases, including vascular and neurodegenerative diseases (32). Our present findings of this recently recognized effect of AdoHcy may provide new insights into the role played by AdoHcy in our health. Many of the effects of DR on longevity in model organisms have been linked to reduced protein and amino acid intake (4–6). We have shown here that stimulating AdoMet synthesis per se in yeast could produce physiological conditions that mimicked CR. In mammals, the CR benefits include reduced morbidity of a host of diseases, such as cancer and diabetes (5). Thus, developing new interventions that stimulate AdoMet synthesis could delay age-related disorders and may even have therapeutic potential in the treatment of Alzheimer’s disease.
Materials and Methods
Details on materials and methods are in SI Materials and Methods. See Table S2 for P values for CLS analysis.
Table S2.
P values for chronological lifespan analysis
| Figure | Strain A | Strain B | P value against B |
| Fig. 1D | WT | sah1-1 | <0.0001 |
| WT | sah1-1 SSG1-1 | <0.0001 | |
| WT | SSG1-1 | <0.0001 | |
| sah1-1 | sah1-1 SSG1-1 | <0.0001 | |
| Fig. 2B | WT | sam1Δ | 0.4655 |
| WT | sam2Δ | 0.0612 | |
| WT | SSG1-1 sam1Δ | <0.0001 | |
| WT | SSG1-1 sam2Δ | <0.0001 | |
| SSG1-1 | SSG1-1 sam1Δ | <0.0001 | |
| SSG1-1 | SSG1-1 sam2Δ | <0.0001 | |
| Fig. 2D | WT | GAL1-SAM1/2 | <0.0001 |
| Fig. 2E | WT (Control) | WT (+ 1 mM AdoMet) | 0.8140 |
| WT (Control) | WT (+ 1 mM AdoHcy) | <0.0001 | |
| Fig. 2G | sam1Δ (Control) | sam1Δ (+ 1 mM AdoMet) | 0.0141 |
| sam1Δ (Control) | sam1Δ (+ 1 mM AdoHcy) | 0.8812 | |
| Fig. 2I | WT (Met-20 mg/L) | SSG1-1 (Met-20 mg/L) | <0.0001 |
| WT (Met-20 mg/L) | WT (Met-0 mg/L) | 0.0490 | |
| SSG1-1 (Met-20 mg/L) | SSG1-1 (Met-0 mg/L) | <0.0001 | |
| WT (Met-0 mg/L) | SSG1-1 (Met-0 mg/L) | 0.0002 | |
| Fig. 2J | WT (Glu-2%) | SSG1-1 (Glu-2%) | <0.0001 |
| WT (Glu-2%) | WT (Glu-0.05%) | 0.9974 | |
| SSG1-1 (Glu-2%) | SSG1-1 (Glu-0.05%) | <0.0001 | |
| WT (Glu-0.05%) | SSG1-1 (Glu-0.05%) | 0.9764 | |
| Fig. 2K | WT (Glu-2%) | SSG1-1 (Glu-2%) | <0.0001 |
| WT (Glu-2%) | WT (Glu-0.5%) | <0.0001 | |
| SSG1-1 (Glu-2%) | SSG1-1 (Glu-0.5%) | <0.0001 | |
| WT (Glu-0.5%) | SSG1-1 (Glu-0.5%) | 0.2026 | |
| Fig. 3C | WT | snf1Δ | <0.0001 |
| WT | SSG1-1 snf1Δ | 0.0671 | |
| SSG1-1 | SSG1-1 snf1Δ | <0.0001 | |
| Fig. 4C | WT (Glu-2%) | WT (Glu-0.5%) | <0.0001 |
| WT (Glu-2%) | WT (Glu-0.05%) | 0.0023 | |
| WT (Glu-2%) | WT (Glu-0%) | <0.0001 | |
| WT (Glu-0.5%) | WT (Glu-0.05%) | <0.0001 | |
| WT (Glu-0.05%) | WT (Glu-0%) | <0.0001 | |
| Fig. 4F | sam1Δ (Glu-2%) | sam1Δ (Glu-0.5%) | <0.0001 |
| sam1Δ (Glu-2%) | sam1Δ (Glu-0.05%) | 0.4930 | |
| sam1Δ (Glu-2%) | sam1Δ (Glu-0%) | 0.0002 | |
| sam1Δ (Glu-0.5%) | sam1Δ (Glu-0.05%) | <0.0001 | |
| sam1Δ (Glu-0.05%) | sam1Δ (Glu-0%) | 0.0289 | |
| Fig. S2B | WT | sah1-1 sam1Δ | <0.0001 |
| WT | sah1-1 sam2Δ | <0.0001 | |
| sah1-1 | sah1-1 sam1Δ | 0.1231 | |
| sah1-1 | sah1-1 sam2Δ | 0.8611 |
P values were derived from a two-way ANOVA with time and strain used as independent factors.
Yeast Strains and Media.
The following yeast strains used in this study were all derivatives of W303: W303-1A (WT; MATa trp1-1 leu2-3 ade2-1 ura3-1 his3-11 can1-100), YMM222 (MATa sah1-1), YRT15 (MATa SSG1-1), YRT3 (MATa sah1-1 SSG1-1), YTO29 (MATa sam1Δ::kanMX4), YTO35 (MATa sam2Δ::kanMX4), YTO33 (MATa SSG1-1 sam1Δ::kanMX4), YTO39 (MATa SSG1-1 sam2Δ::kanMX4), YTO66 (MATa sah1-1 sam1Δ::kanMX4), YTO67 (MATa sah1-1 sam2Δ::kanMX4), YTO78 (MATa GAL-SAM1 GAL-SAM2), YTK22 (MATa snf1Δ::kanMX6), YTK23 (MATa SSG1-1 snf1Δ::kanMX6), YRT1 (MATa/α), YRT2 (MATa/α sah1-1/sah1-1), and YRT12 (MATa/α sah1-1 SSG1-1/sah1-1). Gene disruption was performed by a standard PCR-based method (33). Media used were as described previously (34).
CLS Assay.
Yeast CLS analysis was performed in liquid SDC or SGC media (defined below), as previously described (35). Briefly, SDC or SGC cultures grown overnight were diluted (2 × 10⁶ cells/mL) in fresh SDC or SGC media and incubated at 28 °C with shaking at 180 rpm. Viability was measured by plating aging cells onto YPD plates and monitoring CFUs starting from day 3, which was considered to be the initial survival (100%). All data were represented as the average of three independent experiments conducted at the same time. At least two sets of CLS experiments were performed with similar outcomes. CLS assays were performed with SDC medium [0.17% yeast nitrogen base without amino acids and ammonium sulfate (Difco); 0.5% (wt/vol) ammonium sulfate; 2% (wt/vol) glucose; amino acids to a final concentration of 20 mg/L (adenine, arginine, histidine, methionine, tryptophan, and uracil), 30 mg/L (isoleucine, leucine, lysine, and tyrosine), 60 mg/L (phenylalanine), and 150 mg/L (valine)]. SGC medium had the same composition as SDC, but contained 2% (wt/vol) galactose instead of glucose.
Microarray Analysis.
RNA isolation and microarray profiling analyses were carried out as previously described (19, 36), using the Gene Chip Yeast Genome 2.0 Array (Affymetrix). Cells were grown to early log phase (2 × 10⁶ cells/mL) in liquid SDC medium at 28 °C. A given gene was considered induced when its expression ratio was higher than 2.0. Microarray data have been deposited at the public repository Gene Expression Omnibus (GEO) under accession number GSE76206.
SI Materials and Methods
Cloning of the Mutant SSG1-1 Gene.
To identify the SSG1-1 mutated gene, we constructed a genomic library in a single-copy plasmid pRS316 by using chromosomal DNA from the SSG1-1 mutant, because SSG1-1 was a dominant mutant. The centromeric genomic library was introduced into the sah1-1 strain, and one plasmid that suppressed the slow-growth phenotype of the sah1-1 mutant was obtained. The genomic DNA insert in the cloned plasmid pRT1 (pRS316 based plasmid) (Fig. S1C) was subjected further to restriction mapping and complementation analysis. Partial DNA sequencing of the complementing region revealed that it contained the YHR032W gene.
Plasmids.
pRT1-ΔXbaI (used in Fig. S1 B and G), pRT1 A in plasmid (used in Fig. S1G), and YEp24-SSG1-1/YEp24-YHR032W (used in Fig. S1 D and E) were constructed by the following methods. For pRT1-ΔXbaI, the pRT1 plasmid (Fig. S1C) was digested with XbaI, and then self-circularization of linear DNA was performed with DNA Ligation Kit v2.1 (Takara Bio). For pRT1 A in plasmid, the pRT1 A in plasmid containing the WT DNA sequence of YHR032W was constructed by using a QuikChange XL Site-Directed Mutagenesis Kit (STRATAGENE) and the pRT1-ΔXbaI plasmid as a PCR template. The mutagenic primers were 5′-GGTCAAGGGAGACAAAAAAATAGGTGGGTACATC-3′ and 5′-GATGTACCCACCTATTTTTTTGTCTCCCTTGACC-3′. The mutations were confirmed by DNA sequencing. YEp24-SSG1-1 and YEp24-YHR032W, Both the pRT1-ΔXbaI plasmid (for YEp24-SSG1-1) and the pRT1 A in plasmid (for YEp24-YHR032W) were digested with XbaI-SalI, and cloned into the NheI-SalI–digested YEp24 vector.
Isolation of the SSG1-1 Mutants.
The sah1-1 mutants were grown to midlog phase in liquid YPD medium at 25 °C. The cells were plated onto YPD solid medium at a cell density of 1 × 10⁶ cells per plate and then incubated at 36 °C (high temperature) for 3 d. Approximately 2,500 colonies that grew at this high temperature were picked up. Colonies of suppressor mutants with increased tolerance to the high temperature were spotted onto YPD plates, and the plates were incubated at 37 °C for 2 d. In total, 116 mutants that could grow at 37 °C were obtained. Among these mutants, 15 intragenic suppressors in the sah1-1 gene were obtained. The remaining 101 suppressor mutants had a dominant mutation, which was classified into one complementation group designated as SSG1 (for the spontaneous suppression of the growth-delay in sah1-1).
Determination of AdoMet and AdoHcy.
Extraction of AdoMet and AdoHcy was carried out as previously described (13). Cells were grown to log phase (2 × 10⁶ cells/mL) in liquid YPD or SDC medium at 25 °C. The cells were harvested (total OD660 of 15), washed twice with 20 mL of cold water, and then extracted with 1 mL of 10% perchloric acid for 1 h at room temperature. The supernatant was diluted with MilliQ-grade water, and the samples were filtered for capillary electrophoresis. Analysis of AdoMet and AdoHcy was performed by capillary electrophoresis by using an Agilent Capillary Ion Analyzer G1602A (Agilent) with an Agilent HPCE standard capillary (72-cm total length and 75-μm i.d.). The AdoMet and AdoHcy contents were expressed as nanomole per milligram dry weight of cells.
Determination of ATP.
Cells were grown to log phase (5 × 10⁶ cells/mL) in liquid SDC medium at 25 °C. The cells were harvested by centrifugation to 2 × 10⁷ cells (860 × g, 5 min). The cell pellet was washed by MilliQ-grade water three times and stored at −80 °C.
The cell pellet was resuspended in 100 µL MilliQ-garade water and lysed cells by boiling for 10 min to extract intracellular ATP. The lysed sample was centrifuged at 4 °C and 16,200 × g for 5 min. For the ATP measurement, 200 µL of the solution was mixed with 100 µL of ATP assay buffer (Kikkoman Biochemifa) and measured fluorescence using LUMITESTER C-110 (Kikkoman Biochemifa).
Determination of Met.
Cells were grown to log phase (5 × 10⁶ cells/mL) in liquid SDC medium at 25 °C. The cells were harvested by centrifugation to 3 × 10⁸ cells and washed twice with cold MilliQ-grade water. The cell pellet was extracted amino acid with 1.1 mL of 60% methanol by rotation for 15 min at 28 °C. After centrifugation at 21,600 × g for 5 min, the supernatant was store at −80 °C. For the methionine measurement, the amino acid solution was filtered by Ekicrodisc (Pall Corp.) and measured using an amino acid analyzer (JLC-500 amino acid analyzer, JEOL).
Stress-Resistance Assay.
Oxidative stress-resistance assays were measured by spot assays. Cells suspended in water (5 × 10⁷ cells/mL) were spotted onto SDC plates containing various concentrations of hydrogen peroxide. The cells were then grown at 25 °C for 3 d before visualization. For heat-shock–resistance assays, cells were diluted to 5 × 10⁷ cells/mL and spotted onto YPD plates. The plates were then incubated at 55 °C (heat-shocked) or 25 °C (control) for various times. After the heat-shock, the plates were transferred to 25 °C and incubated for 3 d.
Detection of Snf1 Activation.
Protein extraction was carried out as described previously (22). An exponentially grown cell culture (5 × 10⁶ cells/mL) in SDC or SGC liquid medium was boiled for 5 min and then cooled to room temperature. The cells were harvested by centrifugation, and the pellets were resuspended in 150 µL 1× TE buffer [10 mM Tris⋅HCl, 1 mM EDTA (pH 7.5)] following the addition of 150 µL of 0.2 M NaOH. After incubation for 5 min at room temperature, the pellets were collected, gently resuspended in SDS/PAGE sample buffer, and boiled for 5 min. The eluted proteins were resolved by SDS/PAGE and detected with Phospho-AMPKα (Thr172) antibody (Cell Signaling). For detection of total Snf1 protein, polyhistidine antibody H1029 (Sigma-Aldrich) was used.
Statistical Analysis.
All experiments were repeated at least twice with similar results each time. Data represent biological replicates. Appropriate statistical tests were used for every figure. GraphPad Prism 6 (GraphPad Software) was used for comparison of CLS, and P values were derived from a two-way ANOVA with time and strain used as independent factors. The AdoMet/AdoHcy data were analyzed by appropriate statistical tests (GraphPad Prism 6) as indicated in the figure legends. ImageJ was used to quantify signals for Western blotting results, and GraphPad Prism 6 was used for statistical analysis. P values were derived from the two-tailed t test, with parametric unequal variance. A P value less than 0.05 was defined as statistically significant except for microarray data (P < 0.1, unpaired t test).
Acknowledgments
We thank Drs. Hitoshi Shimoi and Atsuko Isogai for technical advice regarding the construction of the genomic library for cloning of the SSG1-1; Dr. Satoshi Harashima for communicating about the Saccharomyces cerevisiae DKD-5D-H strain background; Mr. Fuminori Ueno for performing some of the chronological lifespan experiments; and Dr. T. Keith Blackwell for critical reading of the manuscript. This work was supported by the program Grants-in-Aid for Scientific Research from the Japan Society for the Promotion of Science for Scientific Research from JSPS KAKENHI Grants 24580142 and 16H04898 (to M.M.). T.O. is the recipient of the Research Fellowship of the Japan Society for the Promotion of Science for Young Scientists (DC2).
Footnotes
The authors declare no conflict of interest.
This article is a PNAS Direct Submission.
Data deposition: The data reported in this paper have been deposited in the Gene Expression Omnibus (GEO) database, www.ncbi.nlm.nih.gov/geo (accession no. GSE76206).
This article contains supporting information online at www.pnas.org/lookup/suppl/doi:10.1073/pnas.1604047113/-/DCSupplemental.
References
- 1.Thomas D, Surdin-Kerjan Y. Metabolism of sulfur amino acids in Saccharomyces cerevisiae. Microbiol Mol Biol Rev. 1997;61(4):503–532. doi: 10.1128/mmbr.61.4.503-532.1997. [DOI] [PMC free article] [PubMed] [Google Scholar]
- 2.Obata F, Miura M. Enhancing S-adenosyl-methionine catabolism extends Drosophila lifespan. Nat Commun. 2015;6:8332. doi: 10.1038/ncomms9332. [DOI] [PMC free article] [PubMed] [Google Scholar]
- 3.Schosserer M, et al. Methylation of ribosomal RNA by NSUN5 is a conserved mechanism modulating organismal lifespan. Nat Commun. 2015;6:6158. doi: 10.1038/ncomms7158. [DOI] [PMC free article] [PubMed] [Google Scholar]
- 4.Mair W, Dillin A. Aging and survival: The genetics of life span extension by dietary restriction. Annu Rev Biochem. 2008;77:727–754. doi: 10.1146/annurev.biochem.77.061206.171059. [DOI] [PubMed] [Google Scholar]
- 5.Fontana L, Partridge L, Longo VD. Extending healthy life span From yeast to humans. Science. 2010;328(5976):321–326. doi: 10.1126/science.1172539. [DOI] [PMC free article] [PubMed] [Google Scholar]
- 6.Kaeberlein M. Lessons on longevity from budding yeast. Nature. 2010;464(7288):513–519. doi: 10.1038/nature08981. [DOI] [PMC free article] [PubMed] [Google Scholar]
- 7.Orentreich N, Matias JR, DeFelice A, Zimmerman JA. Low methionine ingestion by rats extends life span. J Nutr. 1993;123(2):269–274. doi: 10.1093/jn/123.2.269. [DOI] [PubMed] [Google Scholar]
- 8.Miller RA, et al. Methionine-deficient diet extends mouse lifespan, slows immune and lens aging, alters glucose, T4, IGF-I and insulin levels, and increases hepatocyte MIF levels and stress resistance. Aging Cell. 2005;4(3):119–125. doi: 10.1111/j.1474-9726.2005.00152.x. [DOI] [PMC free article] [PubMed] [Google Scholar]
- 9.Wu Z, Song L, Liu SQ, Huang D. Independent and additive effects of glutamic acid and methionine on yeast longevity. PLoS One. 2013;8(11):e79319. doi: 10.1371/journal.pone.0079319. [DOI] [PMC free article] [PubMed] [Google Scholar]
- 10.Lucanic M, et al. N-acylethanolamine signalling mediates the effect of diet on lifespan in Caenorhabditis elegans. Nature. 2011;473(7346):226–229. doi: 10.1038/nature10007. [DOI] [PMC free article] [PubMed] [Google Scholar]
- 11.Chin RM, et al. The metabolite α-ketoglutarate extends lifespan by inhibiting ATP synthase and TOR. Nature. 2014;510(7505):397–401. doi: 10.1038/nature13264. [DOI] [PMC free article] [PubMed] [Google Scholar]
- 12.Hine C, et al. Endogenous hydrogen sulfide production is essential for dietary restriction benefits. Cell. 2015;160(1-2):132–144. doi: 10.1016/j.cell.2014.11.048. [DOI] [PMC free article] [PubMed] [Google Scholar]
- 13.Mizunuma M, Miyamura K, Hirata D, Yokoyama H, Miyakawa T. Involvement of S-adenosylmethionine in G1 cell-cycle regulation in Saccharomyces cerevisiae. Proc Natl Acad Sci USA. 2004;101(16):6086–6091. doi: 10.1073/pnas.0308314101. [DOI] [PMC free article] [PubMed] [Google Scholar]
- 14.Barzilai N, Huffman DM, Muzumdar RH, Bartke A. The critical role of metabolic pathways in aging. Diabetes. 2012;61(6):1315–1322. doi: 10.2337/db11-1300. [DOI] [PMC free article] [PubMed] [Google Scholar]
- 15.Fabrizio P, Longo VD. The chronological life span of Saccharomyces cerevisiae. Aging Cell. 2003;2(2):73–81. doi: 10.1046/j.1474-9728.2003.00033.x. [DOI] [PubMed] [Google Scholar]
- 16.Shiomi N, Fukuda H, Fukuda Y, Murata K, Kimura A. Nucleotide sequence and characterization of a Gene conferring resistance to ethionine in yeast Saccharomyces cerevisiae. J Ferment Bioeng. 1991;71(4):211–215. [Google Scholar]
- 17.Lee SW, Park BS, Choi ES, Oh MK. Overexpression of ethionine resistance gene for maximized production of S-adenosylmethionine in Saccharomyces cerevisiae sake kyokai No. 6. Korean J Chem Eng. 2010;27(2):587–589. [Google Scholar]
- 18.Lee C, Longo VD. Fasting vs dietary restriction in cellular protection and cancer treatment: From model organisms to patients. Oncogene. 2011;30(30):3305–3316. doi: 10.1038/onc.2011.91. [DOI] [PubMed] [Google Scholar]
- 19.Kanai M, et al. Adenosine kinase-deficient mutant of Saccharomyces cerevisiae accumulates S-adenosylmethionine because of an enhanced methionine biosynthesis pathway. Appl Microbiol Biotechnol. 2013;97(3):1183–1190. doi: 10.1007/s00253-012-4261-3. [DOI] [PubMed] [Google Scholar]
- 20.Lee YL, Lee CK. Transcriptional response according to strength of calorie restriction in Saccharomyces cerevisiae. Mol Cells. 2008;26(3):299–307. [PubMed] [Google Scholar]
- 21.Hedbacker K, Carlson M. SNF1/AMPK pathways in yeast. Front Biosci. 2008;13:2408–2420. doi: 10.2741/2854. [DOI] [PMC free article] [PubMed] [Google Scholar]
- 22.Orlova M, Barrett L, Kuchin S. Detection of endogenous Snf1 and its activation state: Application to Saccharomyces and Candida species. Yeast. 2008;25(10):745–754. doi: 10.1002/yea.1628. [DOI] [PubMed] [Google Scholar]
- 23.Mayer FV, et al. ADP regulates SNF1, the Saccharomyces cerevisiae homolog of AMP-activated protein kinase. Cell Metab. 2011;14(5):707–714. doi: 10.1016/j.cmet.2011.09.009. [DOI] [PMC free article] [PubMed] [Google Scholar]
- 24.Pluskal T, Hayashi T, Saitoh S, Fujisawa A, Yanagida M. Specific biomarkers for stochastic division patterns and starvation-induced quiescence under limited glucose levels in fission yeast. FEBS J. 2011;278(8):1299–1315. doi: 10.1111/j.1742-4658.2011.08050.x. [DOI] [PMC free article] [PubMed] [Google Scholar]
- 25.Akao T, et al. Whole-genome sequencing of sake yeast Saccharomyces cerevisiae Kyokai no. 7. DNA Res. 2011;18(6):423–434. doi: 10.1093/dnares/dsr029. [DOI] [PMC free article] [PubMed] [Google Scholar]
- 26.Shimizu S, Shiozaki S, Ohshiro T, Yamada H. Occurrence of S-adenosylhomocysteine hydrolase in prokaryote cells. Characterization of the enzyme from Alcaligenes faecalis and role of the enzyme in the activated methyl cycle. Eur J Biochem. 1984;141(2):385–392. doi: 10.1111/j.1432-1033.1984.tb08203.x. [DOI] [PubMed] [Google Scholar]
- 27.Christopher SA, Melnyk S, James SJ, Kruger WD. S-adenosylhomocysteine, but not homocysteine, is toxic to yeast lacking cystathionine beta-synthase. Mol Genet Metab. 2002;75(4):335–343. doi: 10.1016/S1096-7192(02)00003-3. [DOI] [PubMed] [Google Scholar]
- 28.Chan SY, Appling DR. Regulation of S-adenosylmethionine levels in Saccharomyces cerevisiae. J Biol Chem. 2003;278(44):43051–43059. doi: 10.1074/jbc.M308696200. [DOI] [PubMed] [Google Scholar]
- 29.Hansen M, Hsu AL, Dillin A, Kenyon C. New genes tied to endocrine, metabolic, and dietary regulation of lifespan from a Caenorhabditis elegans genomic RNAi screen. PLoS Genet. 2005;1(1):119–128. doi: 10.1371/journal.pgen.0010017. [DOI] [PMC free article] [PubMed] [Google Scholar]
- 30.Cabreiro F, et al. Metformin retards aging in C. elegans by altering microbial folate and methionine metabolism. Cell. 2013;153(1):228–239. doi: 10.1016/j.cell.2013.02.035. [DOI] [PMC free article] [PubMed] [Google Scholar]
- 31.Choi JS, Lee CK. Maintenance of cellular ATP level by caloric restriction correlates chronological survival of budding yeast. Biochem Biophys Res Commun. 2013;439(1):126–131. doi: 10.1016/j.bbrc.2013.08.014. [DOI] [PubMed] [Google Scholar]
- 32.Xiao Y, et al. Role of S-adenosylhomocysteine in cardiovascular disease and its potential epigenetic mechanism. Int J Biochem Cell Biol. 2015;67:158–166. doi: 10.1016/j.biocel.2015.06.015. [DOI] [PubMed] [Google Scholar]
- 33.Longtine MS, et al. Additional modules for versatile and economical PCR-based gene deletion and modification in Saccharomyces cerevisiae. Yeast. 1998;14(10):953–961. doi: 10.1002/(SICI)1097-0061(199807)14:10<953::AID-YEA293>3.0.CO;2-U. [DOI] [PubMed] [Google Scholar]
- 34.Mizunuma M, Hirata D, Miyahara K, Tsuchiya E, Miyakawa T. Role of calcineurin and Mpk1 in regulating the onset of mitosis in budding yeast. Nature. 1998;392(6673):303–306. doi: 10.1038/32695. [DOI] [PubMed] [Google Scholar]
- 35.Fabrizio P, et al. SOD2 functions downstream of Sch9 to extend longevity in yeast. Genetics. 2003;163(1):35–46. doi: 10.1093/genetics/163.1.35. [DOI] [PMC free article] [PubMed] [Google Scholar]
- 36.Shobayashi M, Ukena E, Fujii T, Iefuji H. Genome-wide expression profile of sake brewing yeast under shaking and static conditions. Biosci Biotechnol Biochem. 2007;71(2):323–335. doi: 10.1271/bbb.60190. [DOI] [PubMed] [Google Scholar]


