

Abstract
Allergen levels in fresh and processed foods can vary dynamically. As different sources of foods can cause different types of allergic reactions, the food industry and regulatory bodies urgently require reliable detection and absolute quantitation methods for allergen detection in complex food products to effectively safeguard the food-allergic population. Recent advances of targeted proteomic technologies namely multiple-reaction monitoring (MRM) mass spectrometry (MS) coupled with isotope-labeled internal standard, also known as AQUA peptides offers absolute quantitation of food allergens even at 10 ppb level in a multiplex fashion. However, development of successful AQUA-MRM assay relies on a number of pre and post MS criteria. In this review, we briefly describe how allergen levels could potentially change in plant and animal based foods, necessitating the development of a high throughput multiplexed allergen quantification methodology for successful AQUA-MRM assay. We also propose some future strategies that could provide better management of food allergy.
Keywords: Absolute Quantitation, Animal-based Allergen, MRM, Mass Spectrometry, Plant-based Allergen, Tolerance Index
Graphical Abstract
1. Introduction
Food allergens are mainly a group of proteins that trigger allergic reactions to human. Food allergies are rapidly increasing worldwide in the last decades. The cause of this increase is believed to stem from the diversification of foods/food-compositions, diversification of food sources, environmental, varietal, cultural practices and pre or post management of foods [1–6]. It has been estimated, worldwide that around two and four billion people live primarily on a meat- and plant-based diet, respectively [7]. In the US, a person with a meat-based diet typically consumed a total of 114 kg food grain, 124 kg meat, 20.3 kg fish, 14 kg eggs and 256 kg dairy products per year whereas a person with a plant-based diet consumed relatively higher amount of food grain (152 kg), vegetables (286 kg), dairy products (307 kg) and eggs (25 kg) per year [7]. However, it is important to note that ninety percent of food allergies and the responsible allergens are associated with the food group named as “The Big 8” which includes egg, fish, milk, peanut, soybean, tree nuts and wheat [8].
In human diets, the main source for vitamins and minerals are fresh vegetables and fruits. However, a number of publications reported that many of the known regular table fruits such as apple, pear, peach, plum, orange, lime, cherry, strawberry, raspberry, mulberry, blueberry, grape, melons, banana, kiwi, avocado and chestnut, and vegetables such as tomato, lettuce, asparagus, cabbage, celery, fennel, carrots, artichoke, contain significant level of allergens [9] which commonly presents as oral allergy syndrome (OAS). Unfortunately most of these fruits and vegetables are served raw which elevates potential risk for OAS. Due to a lack of definitive routine immunotherapy, avoidance of allergen-containing foods is considered the best practice and/or treatment for people with food allergies. Safety labeling is now mandatory for allergen containing foods particularly “The big 8” foods in many countries including USA [8]. However, the lack of accurate information especially absolute quantitation and threshold doses of food allergens can lead to confusion and potential harm to patients with food allergies [10].
To date, a large number of allergen proteins have been identified and systematically cataloged. A recent update (January 2016) of online database AllergenOnline (http://www.allergenonline.org/) reports 778 allergen protein groups and 1956 sequences [11]. According to the WHO/IUIS Allergen Nomenclature SubCommittee (http://www.allergen.org/), 388 (46%) allergen proteins from plants, 338 (40%) from animals, and 110 (13%) from fungi have been officially named [12]. Structural Database of Allergenic Proteins (SDAP, http://fermi.utmb.edu/) is a web server of online recourses on allergenic proteins and computational tools to assist the structural studies. This server listed a total of 1526 allergens, 92 PDB structures, and 458 3D models of allergens [13]. The allergome (http://www.allergome.org/) database contains over 3066 allergenic molecules, considered as the largest allergen database [14]. However, it is important to note that different databases may be highly redundant, and/or missing many of the recently identified allergens. It is unclear what percentage of proteins of these databases are food allergens; however over 50% of the proteins in SDAP may belong to food allergen category.
Proteomics approaches have been used extensively to detect and quantitate food allergens in the last decades (Figure 1). As shown, only 20% of the studies on allergy focused on food allergens wherein only 5% of proteomic studies on allergy used a targeted proteomic approach (Figure 1A). Targeted proteomics is the hypothesis-driven analysis of absolute quantification (AQUA) of proteins of interest using selected reaction monitoring (SRM), also known as multiple reaction monitoring (MRM) strategy where multiple ions of interest are quantified using mass spectrometry [15, 16]. This technology is supersensitive and highly reproducible therefore, the application of targeted quantitative proteomics approaches have rapidly increased in the last five years (Figure 1B) indicating the emergence of targeted proteomics focused on food allergens. It is also interesting to note, among the allergen proteomic studies so far conducted, over 50% were focused on plant allergen identification and/or quantification wherein less than 25% of them used absolute quantitation with SRM and MRM technologies (Figure 1C). Furthermore a word cloud of over 10,000 paper titles from PubMed for “food allergen” reflects the study on major food allergens such as peanut, milk, wheat, soybean, and egg as expected. However, this cloud failed to highlight quantitative, mass-spectrometry and proteomics indicating that quantitative proteomic approaches applied to the study of food allergens are still in a nascent stage.
Figure 1.

The quantitative proteomics on food allergens. (A) Numerous papers are published on “allergens” and “proteomics” with very strong growth of latter field since year 2000. The proportion of papers in “food allergens” and targeted proteomics is very small (inset pie charts). (B) The proportion of papers on various proteomics approaches and their applications in the area of allergens is very high in the last two to five years indicating the emergence of “quantitative proteomics on food allergens”. (C) Quantitative/ targeted proteomics methods are used (in the 62 papers from PubMed) for precise detection/ quantification of food allergens from various sources such as peanuts, wheat, soybean, milk, crustaceans, etc. Over half of these studies are on plant allergens, and “other” category includes allergens from food in general, including wine, etc. Only 24% of research used SRM/ MRM methodologies and other methods include ELISA, MALDI, LC-MS, stable isotope labeling, etc. (D) A word cloud (http://www.wordle.net/) of around 10,000 paper titles from PubMed for “food allergen” shows associated terms and reveals major food allergens such as peanut, milk, wheat, soybean, egg, etc.
Recent advances in nano-LC system coupled with mass spectrometry, the database for many food species will lead to the identification and analysis of many novel allergens which are essentially uncharacterized as allergens but may contains very similar amino acid sequences and/or have similar domain identical with the known allergens proteins from various foods in a precise way [1, 4,–6, 15]. The importance and challenges of food allergen profiling has been recently reviewed by Ciardiello, et al. [17]. In addition, especially the advantage of absolute quantitative proteomic approaches compared with other commonly used methodologies including ELISA in allergen detection and quantification has been extensively discussed in a number of recent review papers [8, 18–20]. It is obvious that current research in allergenomics in terms of absolute quantitative proteomics is certainly less than adequate. These focused quantitative studies would benefit from optimization and standardization of a number of parameters and/or criteria in the case of many food allergens. In this review, we discuss the current status of targeted proteomics in allergen studies with particular emphasis on how allergen levels could be changed in foods. We also discuss the necessity of multiplexed, reliable, robust quantitative methodologies such as AQUA-MRM assay and point out some critical steps in the AQUA-MRM assay that need to be considered carefully for successful assay development for allergen quantification. In addition, we also propose future research strategies that will result in more detailed knowledge on the allergen contents of foods for a more data-driven strategy for the management of food allergy.
2. Factors change allergen levels in foods
One of the fundamental questions in food industries is whether or not abiotic and/or biotic stresses correlate with allergen levels in fresh and processed foods. Accurate food labelling is considered one of the most effective means of protecting allergic humans. Therefore, it is imperative to know the possible factors that could alter allergen levels in foods and whether or not that change is significant compared to the threshold and/or normal levels of allergens in that particular food. In the following subsections we briefly discuss some of the known factors that alter allergen levels in foods.
2.1. Plant-based food allergens
A high heterogeneity in the distribution and quantification of plant allergens among different cultivars has been reported in many seeds, fruits and vegetables [1,5, 21–24]. For instance, to address the environmental effects and geographical distributions on soybean allergens, a study of four varieties of non-GM soybeans grown in six distinct regions of North America found that some allergen levels were significantly increased among the varieties in response to geographical distribution [1]. Similarly, gene expression analysis of 15 apple varieties in response to three different environmental stresses showed shadowing, elevation, and storage significantly affected the transcription of the allergen-encoding genes [21]. Using AQUA-MRM technology, Houston et al. [23] also demonstrated that the total quantity of allergens among the 20 soybean varieties was mostly similar but with, significant differences in some specific allergens. It is important to note that skin reactivity and in vitro IgE binding potencies of various soybean cultivars are significantly different [25] suggesting plant allergenic potential varies with genotype. Variability in plant allergen expression levels not only result from genetic and/or environmental differences but also from a number of agricultural practices that may play a major role in expression of many allergens or allergen-like proteins [25–27]. It has been reported that most of the omega-gliadins, high molecular weight glutenin subunits, serpins, and some alpha-gliadins were increased in wheat grain in proportion with post anthesis fertilizers [27].
It is also important to note that allergens levels are significantly varied among specific tissues. For instance, apple (Malus domestica) allergens Mal d 3 which is located in the apple peel [28] can induce severe allergic reactions [29], Mal d 1 is located in the flesh [28] and usually induces mild symptoms [30]. A recent study using sera from peanut-allergic patients revealed that proteins extracted from both the blanched seed and skin bound significant levels of IgE. However, no IgE binding was observed when phenolic compounds were present in the skin protein extract, suggesting peanut skins contain potentially allergenic proteins [31].
Another factor, which might modify the allergen levels in many horticultural crops particularly in freshly edible vegetables and fruits, is constant exposure to stress conditions and/or treatment during harvesting, handling and processing for self-life. Controlled atmosphere storage and low temperature are commonly applied to horticultural fruits and vegetables such as apple and pear to extend their shelf lives. It has been reported that several known allergens including major allergen Mal d 1.03 and major allergen Pyrc 1 were consistently up-regulated in air conditions (1ºC with 20% O2 and 80% N2) during the 5-day exposure of pear slices [32]. Using ELISA, Sancho et al. [33, 34], have also demonstrated that postharvest treatments also had significant effects on apple Mal d 1 and Mal d 3 allergens.
Due to very limited information regarding these allergen related issues [27, 28, 33, 34], it is currently unknown whether the mentioned factors might have similar effects on many other crops of fruits and vegetables. Therefore, extensive, systematic quantitative research needs to be conducted on allergens of every edible crop. These studies could potentially reduce allergenicity from plant-based food.
2.2 Animal-based food allergens
Most of the fresh meat, fish, and dairy and/or their bi-products have to be processed at some point for short and/or long-term shelf-life either in the home and/or during production. During food processing, proteins can be denatured and/or hydrolyzed which could produce hypoallergenic products [35]. Thermal treatment is the most common method used for food processing which could potentially affect allergenecity [2, 4, 36, 37].
Recently, Kamath et al. [37] demonstrated that heating increased antibody reactivity to prawn allergens. Similarly, parvalbumin which is the major fish allergen had shown increased IgE binding and novel bands at 30 kDa in smoked haddock, salmon and mackerel whereas chemically processed cod, salmon, trout and pickled herring had reduced or abolished IgE binding suggesting that fish allergen immunogenicity were more dependent on processing rather than species [38]. Now it has also become evident that aqua cultural practices can also regulate allergen levels in fish. For instance, a comparative proteomics analysis of muscle tissues of farmed and wild gilt-head sea bream revealed that parvalbumin content was significantly higher in the farmed fish [3].
Furthermore, very recently Kobayashi et al. [6] profiled the tissue specific parvalbumin content in 22 fish species. As expected parvalbumin content differed considerably (around 50 fold) among the fish species wherein difference between the highest (11.2 mg/g) and lowest (0.234 mg/g) content has been quantified in splendid alfonsino and bigeye tuna, respectively. Together with the inter species difference, parvalbumin content also considerably differs among the intra species muscle parts of the examined fish species [6].
These earlier studies provide a clear message that animal based food allergens are potentially changed by various food processing methods as well as the source and origin. Therefore, modern technologies might be employed to quantify the animal-based allergens under these and/or similar conditions. These studies will provide accurate information of the actual allergen quantity under each condition to confirm whether or not the above-mentioned conditions can significantly alter allergen levels.
3. Necessity for a multiplexed, reliable food allergen detection and quantification method
To determine the types and levels of allergens contained per gram of foods will help to develop more meaningful allergen labeling and management strategies in food industries and thereby improve consumer safety [10]. Therefore, a reliable, versatile, high throughput detection and quantitation method for allergens or allergen-like proteins in foods and ingredients is one of the most important priorities in fresh food industries [8, 10]. Absolute quantitation of allergen and/or allergen-like proteins in foods and ingredients is especially important given the prevalence and severity of food triggered allergies in fresh fruits and vegetables [10]. Antibody-based methods such as enzyme-linked immunosorbent assay (ELISA) are one of the most common approaches for detection and quantification of allergens in food industries. Several commercial ELISA kits are widely used and considered as a reliable method for detection of many common food allergens. However this approach is hampered by unreliable detection and highly variable quantification (~40% variability in quantification for some of the food allergens) [39–41]. A comparative analysis between multiple commercially available ELISA kits versus MRM assay revealed that most of the ELISA kits underperformed in the determination of multiple allergens content of industry-processed bakery products [2]. Additionally ELISA-based methods are restricted to single well-known allergens and less well-characterized allergens are excluded.
A recent review by Koeberl et al. [8] presents a side by side comparison of the advantage and limitations of different allergen detection and quantification methods. The major limitations of the non-mass spectrometry methods are cross reactivity, incapability of standardization, narrow quantitation range [lower limit of quantitation (LLOQ) is 0.3 ppm], and poor reproducibility [8]. Additionally, non-mass spectrometry based methods are unable to detect and quantify isoform specific allergens and/or incapable of being performed as a multiplexed system. Therefore, there is an urgent for development of advanced mass-spectrometry based methods that can analyze food allergens in a multiplexed fashion.
4. Absolute quantification (AQUA) - multiple reaction monitoring (MRM) methodology used for food allergen quantitation
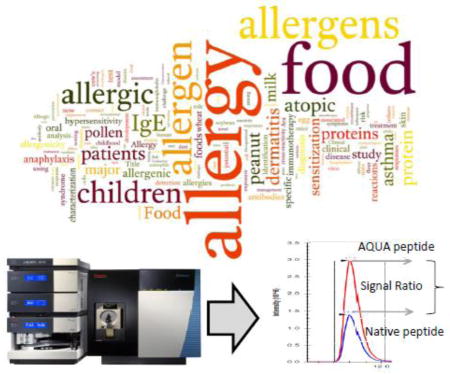
Absolute quantification of proteins can be achieved by triple quadrupole (QQQ) mass spectrometers using a technique called selected reaction monitoring (SRM) in plural multiple reaction monitoring (MRM) [42]. In SRM/MRM method, the QQQ instrument selectively isolates the target precursor ions corresponding to the mass of the targeted peptides and selectively monitors peptide-specific fragment ions [43]. The intensity of the signals from the precursor ion of the endogenous peptide are then compared to the precursor ion of the synthetic isotope-labeled internal standard of known abundance (AQUA peptide) (Figure 2). The MRM technique is a high-throughput, multiplexable, and accurate quantitative approach capable of quantifying hundreds of proteins in a single 30 minute acquisition [43]. Although there are some limitations of high throughput methods such as AQUA-MRM, a number of major advantages including absolute quantification and multiplex approach demands its uses in allergen quantitation (Table 1). Many of the targeted proteins such as allergen levels have been successfully quantified in several seeds such as soybean and maize even in the isoform specific allergens by AQUA-MRM technologies [1, 5, 23].
Figure 2.

Schematic representation of the steps in targeted proteomic approach for absolute quantification of allergen proteins. A known concentration of the labeled AQUA peptides is combined with the digested allergen proteins and subsequently analyzed by a triple quadrupole mass spectrometer. The concentration of the native peptide in relation to the AQUA peptide provides the absolute quantitation of the allergen protein. (Step1) AQUA peptides are selected using bioinformatics approach, (Step 2) Corresponding native peptides are checked in in vivo for suitability, (Step 3) AQUA peptides are synthesized, (Step 4) Mass spectrometry runs are optimized for RT and ionization, (Step 5) LLOQ and LLOD are determined, (Step 6) AQUA peptides are added to sample before or after digestion, (Step 7) Mass spectrometry, and (Step 8) Absolute quantification is done using available software and statistical tools. Optimization is needed in each step.
Table 1.
Advantages and limitations of high throughput technology (AQUA-MRM) for absolute allergen protein quantification.
| Advantages | Limitations |
|---|---|
|
|
5. Critical steps in the AQUA-MRM approach for allergen quantitation
Commercially synthesized isotopically labeled versions of endogenous peptides corresponding to the targeted proteins/allergens have been used frequently as internal standards in the AQUA-MRM based assay for absolute quantitation of many food allergens in the last decades (see Table 2). The reliability and success of the AQUA-MRM assay completely relies on a number of upstream and downstream steps (Figure 2) of the actual mass spectrometry analysis as described in the following subsections. However, it is important to note that, for some cases, the general guidelines discussed below may need to be modified to accurately quantify a target peptide of the allergen [60, 19].
Table 2.
Recent studies of food allergens quantitation using MRM/SRM proteomic approach.
| Source | Allergens | AQUA peptides | LLOQ/LLOD | Ref |
|---|---|---|---|---|
| Plant-based | ||||
|
| ||||
| Hazelnut | Cor a 8.0101 | GIAGLNPNLAAGLPGK | 34.1 μg/g | [44] |
| Cor a 9 | ALPDDVLANAFQISR | 200 μg/g | ||
| QGQVLTIPQNFAVAK | 250 μg/g | |||
| INTVNSNTLPVLR | 397 μg/g | |||
| WLQLSAER | 114 μg/g | |||
| Cor a 11.0101 | AFSWEVLEAALK | 7.1 μg/g | ||
| LLSGIENFR | 5.4 μg/g | |||
| ELAFNLPSR | 4.4 μg/g | |||
|
| ||||
| Maize | Zea m 14 | GQGSGPSAGCCSGVR | 2.03 μg/g | [5] |
| NAAAGVSGLNAGNAASIPSK | 2.03 μg/g | |||
|
| ||||
| Peanuts | Ara h 3 | VYDEELQEGHVLVVPQNFAVAGK | 4 μg/g | [45] |
| WLGLSAEYGNLYR | 4 μg/g | |||
|
| ||||
| Soybean | Gly m 6.0101 | LSAEFGSLR | 0.5–5.7μg/mg | [23] |
| VLIVPQNFVVAAR | - | |||
| Gly m 6.0201 | LSAQYGSLR | - | ||
| NLQGENEEEDSGAIVTVK | - | |||
| Gly m 6.0301 | LSAQFGSLR | - | ||
| FYLAGNQEQEFLQYQPQK | - | |||
| Gly m 6.0401 | VESEGGLIQTWNSQHPELK | - | ||
| Gly m 5 | LITLAIPVNKPGR | - | ||
| Gly m TI | FIAEGHPLSLK | - | ||
| VSDDEFNNYK | - | |||
| DTVDGWFNIER | - | |||
| Gly m Bd28K | DGPLEFFGFSTSAR | - | ||
| Gly m 6 | NGLHLPSYSPYPR | - | ||
|
| ||||
| Soybean | Gly m 6.0101 | VLIVPQNFVVAAR | - | [1] |
| Gly m 6.0201 | NLQGENEEEDSGAIVTVK | - | ||
| Gly m 6.0301 | FYLAGNQEQEFLQYQPQK | - | ||
| Gly m 6.0401 | VESEGGLIQTWNSQHPELK | - | ||
| Gly m 5 | LITLAIPVNKPGR | - | ||
| Gly m TI | FIAEGHPLSLK | - | ||
| DTVDGWFNIER | - | |||
| Gly m Bd28K | DGPLEFFGFSTSAR | - | ||
|
| ||||
| Wheat | Tri a 14 | NVANGASGGPYITR | 1μg/g | [46] |
| Tri a 15 | SVYQELGVR | - | ||
| Tri a 25.0101 | KFPAAVFLK | - | ||
| FPAAVFLK | - | |||
| Tri a 28 | EHGAQEGQAGTGAFPR | - | ||
| Tri a 29.0101 | SDPNSSVLK | - | ||
| Tri a 29.0201 | TSDPNSGVLKDLPGCPR | - | ||
| TSDPNSGVLK | - | |||
| Tri a 30 | YFIALPVPSQPVDPR | - | ||
| Tri a 31.0101 | VAYALAQGLK | - | ||
| TNVSPEVAESTR | - | |||
| Tri a 32 | TLHIVGPDK | - | ||
| AVDSLLTAAK | ||||
| Tri a 33 | LSIAHQTR | |||
| LASTISSNPK | ||||
| GAWTDQFDPR | ||||
| LSAEPEFLEQHIPR | ||||
| Tri a 34.0101 | AASFNIIPSSTGAAK | |||
|
| ||||
| Animal-based | ||||
|
| ||||
| Milk | Bos d 4 | VGINYWLAHK | 11ng/mL | [47] |
| Bos d 5.0102 | IPAVFK | 1ng/mL | ||
| LIVTQTMK | 4ng/mL | |||
| Bos d 9 | YLGYLEQLLR | 1ng/mL | ||
| FFVAPFPEVFGK | - | |||
| Bub b 11 | GPFPIIV | - | ||
| VLPVPQK | - | |||
|
| ||||
| Crustacean (Chionoecetes opilio) | Chi o 2 | LVSAVNEIEK | 3nM | [48] |
| Chi o 4 | VATVSLPR | - | [49] | |
| Chi o 1.0101 | SQLVENELDHAQEQLSAATHK | - | [50] | |
| Chi o 1.0101 | SQLVENELDHAQEQLSAATHK | 1nmol/L | [53] | |
| Chi o 2 | LVSAVNEIEK | - | ||
|
| ||||
| Shrimp | Lit v 1.0101 | ADTLEQQNK | - | [52] |
| IQLLEEDLER | - | |||
| LAEASQAADESER | - | |||
| SLSDEER | - | |||
| FLAEEADR | - | |||
| IVELEEELR | - | |||
| Lit v 2 | VSSTLSSLEGELK | - | ||
| TFLVWVNEEDHLR | - | |||
|
| ||||
| (Pandalus borealis) | Pan b 3 | EGFQLMDR | 0.25nM | [51] |
| Pan b 1.0101 | SEEEVFGLQK | - | ||
|
| ||||
| Processed foods | ||||
|
| ||||
| Baked food | Bub b 11 | VLPVPQK | 500μg/kg | [54] |
|
| ||||
| Baked food | Bos d 9 | FFVAPFPEVFGK | <3ppm | [55] |
| HQGLPQEVLNENLLR | - | |||
| YLGYLEQLLR | - | |||
|
| ||||
| Chocolate | Ara h 1 | VLLEENAGGEQEER | 2ppm | [56] |
| DLAFPGSGEQVEK | - | |||
|
| ||||
| Cookies | Ara h 3 | AHVQVVDSNGNR | 10μg/g | [57] |
| SPDIYNPQAGSLK | - | |||
|
| ||||
| Food | Ana o 2.0101 | VFDGEVR | 46mg/kg | [58] |
| ADIYTPEVGR | - | |||
| Cor a 9 | ADIYTEQVGR | 90mg/kg | ||
| QEWER | - | |||
| Pru du 6 | QQGQQEQQQER | 58mg/kg | ||
| QQEQLQQER | - | |||
| Ara h 3 | SPDIYNPQAGSLK | 37mg/kg | ||
| YQQQSR | - | |||
| Jug r 4.0101 | LDALEPTNR | 180mg/kg | ||
| EFQQDR | - | |||
|
| ||||
| Food | Lup an 1 | IVEFQSKPNTLILPK | 4 mg/kg | [59] |
| Lup a alpha | VIIPPTMRPR | 14 mg/kg | ||
| Lup a delta | ALQQIYENQSEQCQGR | 19 mg/kg | ||
| Lup a gamma | ISGGVPSVDLIMDK | 42 mg/kg | ||
5.1. In silico analysis for designing AQUA peptide standards
One of the most critical steps in the AQUA-MRM analysis is to design the proteotypic peptide [61] that will be used as a standard for quantitation in downstream LC-MS/MS analysis. Standard peptides can be one or more peptides correspond to the target allergen. Peptides that produce the highest ion-current response are expected to provide the best detection sensitivity corresponding to the sequences with the highest ionization efficiency. In case of known allergens for any target species, the amino acid sequence of the target peptide should be BLAST searched against the protein database of that the particular species to confirm that peptide is unique for that particular protein. However, if there is no unique tryptic peptide available for any specific allergen group/class then a common peptide can be used for that group/class of allergenic protein as long as the peptide sequence is not present in the complex matrixes or other food ingredients analyzed for any assay. A sequence alignment of all orthologs and paralogous proteins can potentially help to select the non-redundant unique peptide of a particular allergen across the species. It is also important to note that selection of unique or common peptide is dependent on the experimental design and purpose of the experiment. For example, quantification of tropomyosin likes protein, which is a major allergen not only from the crustacean foods but also from many other invertebrates, is complicated by homology amongst species. In this particular case, a shared peptide can be selected for quantification of the total tropomyosin like protein, which will provide the total amount of that allergen in a complex food mixture.
Online tools such as “ExPasy Peptide Cutter and/or Peptide Mass” can be useful to quickly determine the sequence of peptides from a selected allergen protein amino acid sequence. In addition to the previously mentioned criteria, there are some additional key points that need be considered during selection of the peptide standards. These parameters include: 1) the ideal AQUA peptide length is preferably between eight to twenty amino acids, 2) peptides containing a proline after or before the arginine or lysine should not be selected because the presence of proline before or after Lys and/or Arg occasionally affects the trypsin digestion [62, 63], 3) peptides containing internal tryptic cleavage sites should not be selected as the AQUA standard [5], 4) easily modified amino acids or residues previously established as sites of post translational modification such as glycosylation should be excluded [64, 65]. For each allergen, multiple signature peptides need to be selected to achieve the most accurate quantitation.
5.2. In vivo verification and selection of the target peptides
In addition with the criteria described by Johnson et al [64] for selection of target proteins, it is important to verify the utility of the targeted peptides for quantitative analysis in the trypsin digested actual biological sample. The reproducibility of the trypsin digestion and the detection of the selected precursor and transition ions is an important consideration in the successful implementation of the method. The following parameters are important considerations in the development of this assay: 1) at least five transition ions should be co-eluted together, 2) the MS/MS spectrum of each transition ion must have at least five replicate MS/MS spectrum and 3) the signals measured in the mass spectrum should be at least five times higher than the background noise.
5.3. AQUA peptide synthesis and Optimization of the RT and Collision energy
The AQUA peptides are stable isotope-labeled synthetic tryptic peptides that are identical in sequence to the native peptides. These peptides can be synthesized commercially. The physiochemical and chromatographic properties such as retention time and ionization efficiency of the AQUA standards are nearly identical to the native target peptides except for the inclusion of heavy-isotopes of an amino acid which distinguishes the standards from the native peptides by a mass shift [66]. Particularly the C13/N15 are preferable to deuterium labeled AQUA peptides due to the possible RT shift in deuterated isomers. For each allergen at least two different AQUA peptides need to be synthesized. To achieve the maximal signal of the AQUA peptide, the collision energy and the retention time of each MRM transition ion should be optimized with the triple stage quadrupole (TSQ) instrument as the fragmentation can vary from instrument to instrument thus effecting the signal intensity [8, 40]. Generally 100–200 nmol of AQUA standard can be analyzed in a TSQ instrument to optimize the collision energy and RT and the MRM method files could be generated through open source Skyline software (http://sciex.com/products/software/skyline-software) [67] which is a widely used tool for MRM assay development [16, 18, 19, 68, 69]. There are also a number of other software tools such as mProphet [70], PeptideAtlas, SRMAtlas and PASSEL [71] which are publicly available resources to select the appropriate AQUA peptide and/or transition ions for MRM assay.
The following parameters are important to consider: 1) the precursor ion's charge state should not be over three, and a charge state of two is ideal, as doubly charged peptides are optimal to detect compared to single or multiply charged peptides, 2) at least three transition ions for each precursor ion/AQUA peptide need to be selected for collision energy and RT optimization because the analysis of more transitions can improve accuracy [72], 3) the top three most intense transition ions need to be selected for optimization and 4) the transition ions selected for MRM analysis should also have a higher m/z than the precursor ion to guarantee peptide specificity and to maximize signal to noise of detection of the AQUA standards [40].
5.4. Determination of LLOD and LLOQ of the native and AQUA peptides
The success of absolute quantitation of allergens using an AQUA-MRM assay is completely reliant on the determination of the lower limit of detection (LLOD) and the lower limit of quantification (LLOQ) of the AQUA standards. Therefore, the determination of the LLOQ and LLOD is considered the most crucial step in AQUA-MRM based assay development. Linear ranges of detection of the AQUA standard could be determined by a tenfold dilution series of the AQUA standards wherein a fixed concentration of matrix (the actual biological samples) should be used. At least a six-point dilution series of the AQUA standards from a range of 10.0 amol to 1.0 pmol is necessary to achieve a linear quantitative range. Similarly, the linear quantitative range of each native peptide could also be determined with similar analysis of dilution series of the digested matrix proteins (100 ng to 2 μg) wherein the AQUA standard should be fixed. Plotting the response ratio at each dilution point can access the linearity of the signal versus the concentration. For each precursor ion, at least three calibration curves for three transition ions need to be created to check the linearity in response of the AQUA standard [5].
5.5. Precision and quality control
A lack of quality control and poor precision could potentially provide low quality data in the MRM assay that leads ultimately to improper allergen quantitation. We therefore suggest some critical parameters that may help to develop a successful and precise MRM assay for allergen quantification. 1) AQUA standards are generally quality controlled by the manufacturer for appropriate mass and purity, however it is essential to perform an internal quality control to ensure that both the native and AQUA standard are physico-chemically identical and co-eluted together, 2) each analysis should be conducted within the linear range of quantification for both the AQUA and native peptide within the biological matrix, 3) in the linear range determination assay equal amount of internal control such as BSA peptide may be included in each dilution point to evaluate the carry over and the slope and regression values need to be calculated, 4) the accuracy of quantification can also be altered by the timing of addition of the internal AQUA standard to the matrix (e.g., before or after the trypsin digestion step), 5) physico-chemical modification such as carbamylation or methionine oxidation could also alter the mass of the endogenous peptide and thereby affect its measurement during the MRM assay. It is important to note that the peptide loss due to breakdown or modification is highly dependent on the peptide sequence, however certain combinations of amino acids are more prone to internal or external chemistry [5]. Therefore, it has been suggested to use multiple peptides to achieve more precise quantitation results for MRM assay [5, 23, 43, 65, 73].
6. Clinical importance of absolute quantitation of food allergens
The food allergen labeling and consumer protection act of 2004 (www.fda.gov/Food/GuidanceRegulation) required that food labels declare the presence of the allergen if the product that contains a "major food allergen" or contains an ingredient that may be a source of a major food allergen. A food ingredient may be exempt from these labeling requirements if it has been shown to not cause an allergic response in humans. Application of these criteria led to the establishment in 2006 of an FDA working group to consider approaches to identifying thresholds for food allergens and for gluten (www.fda.gov/Food/GuidanceRegulation). Among the four approaches to establish thresholds, the first was analytical methods-based. The working group noted that this approach could only be applied to those major food allergens for which validated analytical methods are available.
Such an analytical approach offers consumers and care-givers an objective basis for the avoidance of specific foods. The importance of developing reference doses for allergens to which only the most sensitive subjects might react is illustrated by a recent study [10]. This study found that doses that elicited reactions in 10% of the allergic population (ED10) were statistically indistinguishable for major allergens from four food sources namely hazelnut, peanut, celery and fish (a range of 2 to 27 mg of protein). However, the ED10 value for shrimp was about 100-fold higher than those for the other foods [10]. They further noted that this extreme degree of variance among the foods tested might be affected by the difference between raw and cooked shrimp. Furthermore, the authors point out that their data support the view that ED5 or ED1 values might constitute a more appropriate basis for recommendations, but that there are challenges in using low-dose exposures in a double-blind, placebo-controlled paradigm to establish such thresholds.
Targeted proteomics for the quantification of food allergens offers the opportunity to more accurately assess risks associated with specific foods [10]. Meaningful, quantitative food labeling based on allergen levels above or below designated thresholds can only be achieved if appropriate analytical methods are developed. Thus, targeted proteomics can enhance the impact of research on factors (such as the threshold and actual quantity of allergens) that determine the allergenicity of specific foods.
7. Future strategies
Certainly research in the recent decades improved our understanding about the variability of allergen levels in foods caused by several abiotic factors. In addition, it has become evident that small changes of allergen levels in foods can lead to variations in allergenicity with potential life-threatening implications for allergic patients [10]. These findings motivate development of new reliable standardization methods such as AQUA-MRM for absolute quantitation of food allergens. However, to date, very limited information is available for system wide allergen profiling and/or absolute quantitation data for commonly used foods. Therefore, a great deal of work remains to be done in the enormous and nebulous field of allergenomics particularly on absolute quantitation of allergens.
Here we propose the expanded analysis of:
Profiling and absolute quantitation of the varietal/germplasm specific allergens and/or allergen-like proteins in foods
Determination of the effect of geographical distributions on allergen levels in foods particularly in fish, cereals, nuts, fruits and vegetables
Determination of the effect of cultural practices (eg., application of fertilizers, chemicals to the crop plants/vegetables/fruits before or/after post anthesis) on food allergen levels
Tissue specific allergen quantifications of commonly used cereals, nuts, vegetables, fruits and fishes
Effects of pre and post processing of shelf-life on food allergens
These investigations will lead to better understanding in terms of tolerance index and threshold levels for particular food allergens. Furthermore, these studies will ultimately help to develop new immunotherapeutic strategies. Consequently, development of a publicly accessible database will allow other researchers, farmers, and consumers to access and utilize these resources according to their interest.
Biological Significance.
Given the rapid increases of food allergenicity, it has become imperative to know absolute allergen levels in foods. This essential information could be the most effective means of protecting humans suffering from allergies. In this review, we emphasize the significance of the absolute quantitation of food allergens using AQUA-MRM approach and discuss the likely critical steps for successful assay development.
Acknowledgments
This work was supported by NIH P30GM110759 and NIH K24HD080539.
Abbreviations
- AQUA
absolute quantification
- ED
Effective dose
- LC
Liquid chromatography
- LLOD
Lower limit of detection
- LLOQ
Lower limit of quantitation
- MRM
Multiple-reaction monitoring
- OAS
Oral allergy syndrome
- QQQ
Triple quadrupole
- RT
Retention time
- TSQ
Triple stage quadrupole
- SRM
Selected-reaction monitoring
Footnotes
Conflict of Interest
The authors declare no conflict of interest.
Publisher's Disclaimer: This is a PDF file of an unedited manuscript that has been accepted for publication. As a service to our customers we are providing this early version of the manuscript. The manuscript will undergo copyediting, typesetting, and review of the resulting proof before it is published in its final citable form. Please note that during the production process errors may be discovered which could affect the content, and all legal disclaimers that apply to the journal pertain.
References
- 1.Stevenson SE, Woods CA, Hong B, Kong X, Thelen JJ, Ladics GS. Environmental effects on allergen levels in commercially grown non-genetically modified soybeans: assessing variation across north america. Front Plant Sci. 2012;3:196. doi: 10.3389/fpls.2012.00196. [DOI] [PMC free article] [PubMed] [Google Scholar]
- 2.Parker CH, Khuda SE, Pereira M, Ross MM, Fu TJ, Fan X, Wu Y, Williams KM, DeVries J, Pulvermacher B, Bedford B, Zhang X, Jackson LS. Multi-allergen Quantitation and the Impact of Thermal Treatment in Industry-Processed Baked Goods by ELISA and Liquid Chromatography-Tandem Mass Spectrometry. J Agric Food Chem. 2015;63:10669–10680. doi: 10.1021/acs.jafc.5b04287. [DOI] [PubMed] [Google Scholar]
- 3.Piovesana S, Capriotti AL, Caruso G, Cavaliere C, La Barbera G, Zenezini Chiozzi R, Laganà A. Labeling and label free shotgun proteomics approaches tocharacterize muscle tissue from farmed and wild gilthead sea bream (Sparus aurata) J Chromatogr A. 2015 doi: 10.1016/j.chroma.2015.07.049. [DOI] [PubMed] [Google Scholar]
- 4.Renzone G, Arena S, Scaloni A. Proteomic characterization of intermediate and advanced glycation end-products in commercial milk samples. J Proteomics. 2015;117:12–23. doi: 10.1016/j.jprot.2014.12.021. [DOI] [PubMed] [Google Scholar]
- 5.Stevenson SE, McClain S, Thelen JJ. Development of an isoform-specific tandem mass spectrometry assay for absolute quantitation of maize lipid transfer proteins. J Agric Food Chem. 2015;63:821–828. doi: 10.1021/jf504708u. [DOI] [PubMed] [Google Scholar]
- 6.Kobayashi Y, Yang T, Yu CT, Ume C, Kubota H, Shimakura K, Shiomi K, Hamada-Sato N. Quantification of major allergen parvalbumin in 22 species of fish by SDS-PAGE. Food Chem. 2016;194:345–353. doi: 10.1016/j.foodchem.2015.08.037. [DOI] [PubMed] [Google Scholar]
- 7.Pimentel D, Pimentel M. Sustainability of meat-based and plant-based diets and the environment. Am J Clin Nutr. 2003;78:660S–663S. doi: 10.1093/ajcn/78.3.660S. [DOI] [PubMed] [Google Scholar]
- 8.Koeberl M, Clarke D, Lopata AL. Next generation of food allergen quantification using mass spectrometric systems. J Proteome Res. 2014;13:3499–3509. doi: 10.1021/pr500247r. [DOI] [PubMed] [Google Scholar]
- 9.Nakamura R, Teshima R. Proteomics-based allergen analysis in plants. J Proteomics. 2013;93:40–49. doi: 10.1016/j.jprot.2013.03.018. [DOI] [PubMed] [Google Scholar]
- 10.Ballmer-Weber BK, Fernandez-Rivas M, Beyer K, Defernez M, Sperrin M, Mackie AR, Salt LJ, Hourihane JO, Asero R, Belohlavkova S, Kowalski M, de Blay F, Papadopoulos NG, Clausen M, Knulst AC, Roberts G, Popov T, Sprikkelman AB, Dubakiene R, Vieths S, van Ree R, Crevel R, Mills EN. How much is too much? Threshold dose distributions for 5 food allergens. J Allergy Clin Immunol. 2015;135:964–971. doi: 10.1016/j.jaci.2014.10.047. [DOI] [PubMed] [Google Scholar]
- 11.Goodman R, van Ree R, Vieths S, Ferreira F, Ebisawa M, Sampson HA, Baumert J, Wise J, Taylor SL. Criteria used to categorise proteins as allergens for inclusion in allergenonline.org: a curated database for risk assessment. Clin Transl Allergy. 2014;4:P12. [Google Scholar]
- 12.Radauer C, Nandy A, Ferreira F, Goodman RE, Larsen JN, Lidholm J, Pomés A, Raulf-Heimsoth M, Rozynek P, Thomas WR, Breiteneder H. Update of the WHO/IUIS Allergen Nomenclature Database based on analysis of allergen sequences. Allergy. 2014;69:413–419. doi: 10.1111/all.12348. [DOI] [PubMed] [Google Scholar]
- 13.Ivanciuc O, Schein CH, Braun W. SDAP: database and computational tools for allergenic proteins. Nucleic Acids Res. 2003;31:359–362. doi: 10.1093/nar/gkg010. [DOI] [PMC free article] [PubMed] [Google Scholar]
- 14.Mari A, Rasi C, Palazzo P, Scala E. Allergen databases: current status and perspectives. Curr Allergy Asthma Rep. 2009;9:376–383. doi: 10.1007/s11882-009-0055-9. [DOI] [PubMed] [Google Scholar]
- 15.Doerr A. Mass spectrometry-based targeted proteomics. Nat Methods. 2013;10:23. doi: 10.1038/nmeth.2286. [DOI] [PubMed] [Google Scholar]
- 16.Marx V. Targeted proteomics. Nat Methods. 2013;10:19–22. doi: 10.1038/nmeth.2285. [DOI] [PubMed] [Google Scholar]
- 17.Ciardiello MA, Tamburrini M, Liso M, Crescenzo R, Rafaiani C, Mari A. Food allergen profiling: A big challenge. Food Research International. 2013;54:1033–1041. [Google Scholar]; Codina R, Ardusso L, Lockey RF, Crisci C, Medina I. Allergenicity of varieties of soybean. Allergy. 2003;58:1293–298. doi: 10.1046/j.1398-9995.2003.00301.x. [DOI] [PubMed] [Google Scholar]
- 18.Stevenson SE, Chu Y, Ozias-Akins P, Thelen JJ. Validation of gel-free, label-free quantitative proteomics approaches: applications for seed allergen profiling. J Proteomics. 2009;72:555–566. doi: 10.1016/j.jprot.2008.11.005. [DOI] [PubMed] [Google Scholar]
- 19.Stevenson SE, Houston NL, Thelen JJ. Evolution of seed allergen quantification--from antibodies to mass spectrometry. Regul Toxicol Pharmacol. 2010;58:S36–S41. doi: 10.1016/j.yrtph.2010.07.001. [DOI] [PubMed] [Google Scholar]
- 20.Di Girolamo F, Muraca M, Mazzina O, Lante I, Dahdah L. Proteomic applications in food allergy: food allergenomics. Curr Opin Allergy Clin Immunol. 2015;15:259–266. doi: 10.1097/ACI.0000000000000160. [DOI] [PubMed] [Google Scholar]
- 21.Botton A, Lezzer P, Dorigoni A, Barcaccia G, Ruperti B, Ramina A. Genetic and environmental factors affecting allergen-related gene expression in apple fruit (Malus domestica L. Borkh) J Agric Food Chem. 2008;56:6707–6716. doi: 10.1021/jf800813d. [DOI] [PubMed] [Google Scholar]
- 22.Matthes A, Schmitz-Eiberger M. Apple (Malus domestica L. Borkh. ) allergen Mal d 1: effect of cultivar, cultivation system, and storage conditions. J Agric Food Chem. 2009;57:10548–10553. doi: 10.1021/jf901938q. [DOI] [PubMed] [Google Scholar]
- 23.Houston NL, Lee DG, Stevenson SE, Ladics GS, Bannon GA, McClain S, Privalle L, Stagg N, Herouet-Guicheney C, MacIntosh SC, Thelen JJ. Quantitation of soybean allergens using tandem mass spectrometry. J Proteome Res. 2011;10:763–773. doi: 10.1021/pr100913w. [DOI] [PubMed] [Google Scholar]
- 24.Fonseca C, Planchon S, Pinheiro C, Renaut J, Ricardo CP, Oliveira MM, Batista R. Maize IgE binding proteins: each plant a different profile. Proteome Sci. 2014;12:17. doi: 10.1186/1477-5956-12-17. [DOI] [PMC free article] [PubMed] [Google Scholar]
- 25.Codina R, Ardusso L, Lockey RF, Crisci C, Medina I. Allergenicity of varieties of soybean. Allergy. 2003;58:1293–1298. doi: 10.1046/j.1398-9995.2003.00301.x. [DOI] [PubMed] [Google Scholar]
- 26.Krishnan HB, Natarajan SS, Mahmoud AA, Nelson RL. Identification of glycinin and beta-conglycinin subunits that contribute to the increased protein content of high-protein soybean lines. J Agric Food Chem. 2007;55:1839–1845. doi: 10.1021/jf062497n. [DOI] [PubMed] [Google Scholar]
- 27.Altenbach SB, Tanaka CK, Hurkman WJ, Whitehand LC, Vensel WH, Dupont FM. Differential effects of a post-anthesis fertilizer regimen on the wheat flour proteome determined by quantitative 2-DE. Proteome Sci. 2011;9:46. doi: 10.1186/1477-5956-9-46. [DOI] [PMC free article] [PubMed] [Google Scholar]
- 28.Marzban G, Mansfeld A, Hemmer W, Stoyanova E, Katinger H, da Câmara Machado ML. Fruit cross-reactive allergens: a theme of uprising interest for consumers' health. Biofactors. 2005;23:235–241. doi: 10.1002/biof.5520230409. [DOI] [PubMed] [Google Scholar]
- 29.Fernández-Rivas M, van Ree R, Cuevas M. Allergy to Rosaceae fruits without related pollinosis. J Allergy Clin Immunol. 1997;100:728–733. doi: 10.1016/s0091-6749(97)70265-3. [DOI] [PubMed] [Google Scholar]
- 30.Amlot PL, Kemeny DM, Zachary C, Parkes P, Lessof MH. Oral allergy syndrome (OAS): symptoms of IgE-mediated hypersensitivity to foods. Clin Allergy. 1987;17:33–42. doi: 10.1111/j.1365-2222.1987.tb02317.x. [DOI] [PubMed] [Google Scholar]
- 31.White BL, Gökce E, Nepomuceno AI, Muddiman DC, Sanders TH, Davis JP. Comparative proteomic analysis and IgE binding properties of peanut seed and testa (skin) J Agric Food Chem. 2013;61:3957–3968. doi: 10.1021/jf400184y. [DOI] [PubMed] [Google Scholar]
- 32.Pedreschi R, Hertog M, Robben J, Lilley KS, Karp NA, Baggerman G, Vanderleyden J, Nicolaï B. Gel-based proteomics approach to the study of metabolic changes in pear tissue during storage. J Agric Food Chem. 2009;57:6997–7004. doi: 10.1021/jf901432h. [DOI] [PubMed] [Google Scholar]
- 33.Sancho AI, Foxall R, Browne T, Dey R, Zuidmeer L, Marzban G, Waldron KW, van Ree R, Hoffmann-Sommergruber K, Laimer M, Mills EN. Effect of postharvest storage on the expression of the apple allergen Mal d 1. J Agric Food Chem. 2006;54:5917–5923. doi: 10.1021/jf060880m. [DOI] [PubMed] [Google Scholar]
- 34.Sancho AI, Foxall R, Rigby NM, Browne T, Zuidmeer L, van Ree R, Waldron KW, Mills EN. Maturity and storage influence on the apple (Malus domestica) allergen Mal d 3, a nonspecific lipid transfer protein. J Agric Food Chem. 2006;54:5098–50104. doi: 10.1021/jf0530446. [DOI] [PubMed] [Google Scholar]
- 35.Sathe SK, Sharma GM. Effects of food processing on food allergens. Mol Nutr Food Res. 2009;53:970–978. doi: 10.1002/mnfr.200800194. [DOI] [PubMed] [Google Scholar]
- 36.Sathe SK, Teuber SS, Roux KH. Effects of food processing on the stability of food allergens. Biotechnol Adv. 2005;23:423–429. doi: 10.1016/j.biotechadv.2005.05.008. [DOI] [PubMed] [Google Scholar]
- 37.Kamath SD, Rahman AM, Voskamp A, Komoda T, Rolland JM, O'Hehir RE, Lopata AL. Effect of heat processing on antibody reactivity to allergen variants and fragments of black tiger prawn: A comprehensive allergenomic approach. Mol Nutr Food Res. 2014;58:1144–1155. doi: 10.1002/mnfr.201300584. [DOI] [PubMed] [Google Scholar]
- 38.Sletten G, Van Do T, Lindvik H, Egaas E, Florvaag E. Effects of Industrial Processing on the Immunogenicity of Commonly Ingested Fish Species. Int Arch Allergy Immunol. 2010;151:223–236. doi: 10.1159/000242360. [DOI] [PubMed] [Google Scholar]
- 39.Cucu T, Platteau C, Taverniers I, Devreese B, De Loose M, De Meulenaer B. ELISA detection of hazelnut proteins: effect of protein glycation in the presence or absence of wheat proteins. Food Addit Contam Part A. 2011;28:1–10. doi: 10.1080/19440049.2010.535026. [DOI] [PubMed] [Google Scholar]
- 40.Heick J, Fischer M, Kerbach S, Tamm U, Popping B. Application of a Liquid Chromatography Tandem Mass Spectrometry Method for the Simultaneous Detection of Seven Allergenic Foods in Flour and Bread and Comparison of the Method with Commercially Available ELISA Test Kits. J AOAC Int. 2011;94:1060–1068. [PubMed] [Google Scholar]
- 41.Stelk T, Niemann L, Lambrecht DM, Baumert JL, Taylor SL. False positive detection of peanut residue in liquid caramel coloring using commercial ELISA kits. J Food Sci. 2013;78:T1091–T1093. doi: 10.1111/1750-3841.12146. [DOI] [PubMed] [Google Scholar]
- 42.Picotti P, Bodenmiller B, Mueller LN, Domon B, Aebersold R. Full dynamic range proteome analysis of S. cerevisiae by targeted proteomics. Cell. 2009;138:795–806. doi: 10.1016/j.cell.2009.05.051. [DOI] [PMC free article] [PubMed] [Google Scholar]
- 43.Picotti P, Rinner O, Stallmach R, Dautel F, Farrah T, Domon B, Wenschuh H, Aebersold R. High-throughput generation of selected reaction-monitoring assays for proteins and proteomes. Nat Methods. 2010;7:43–46. doi: 10.1038/nmeth.1408. [DOI] [PubMed] [Google Scholar]
- 44.Ansari P, Stoppacher N, Baumgartner S. Marker peptide selection for the determination of hazelnut by LC-MS/MS and occurrence in other nuts. Anal Bioanal Chem. 2012;402:2607–2615. doi: 10.1007/s00216-011-5218-6. [DOI] [PubMed] [Google Scholar]
- 45.Monaci L, De Angelis E, Bavaro SL, Pilolli R. High-resolution OrbitrapTM-based mass spectrometry for rapid detection of peanuts in nuts. Food Addit Contam Part A Chem Anal Control Expo Risk Assess. 2015;32:1607–1616. doi: 10.1080/19440049.2015.1070235. [DOI] [PubMed] [Google Scholar]
- 46.Rogniaux H, Pavlovic M, Lupi R, Lollier V, Joint M, Mameri H, Denery S, Larré C. Allergen relative abundance in several wheat varieties as revealed via a targeted quantitative approach using MS. Proteomics. 2015;15:1736–1745. doi: 10.1002/pmic.201400416. [DOI] [PubMed] [Google Scholar]
- 47.Ansari P, Stoppacher N, Rudolf J, Schuhmacher R, Baumgartner S. Selection of possible marker peptides for the detection of major ruminant milk proteins in food by liquid chromatography-tandem mass spectrometry. Anal Bioanal Chem. 2011;399:1105–1115. doi: 10.1007/s00216-010-4422-0. [DOI] [PubMed] [Google Scholar]
- 48.Rahman AMA, Kamath SD, Lopata AL, Robinson JJ, Helleur RJ. Biomolecular characterization of allergenic proteins in snow crab (Chionoecetes opilio) and de novo sequencing of the second allergen arginine kinase using tandem mass spectrometry. J Proteomics. 2011;74:231–241. doi: 10.1016/j.jprot.2010.10.010. [DOI] [PubMed] [Google Scholar]
- 49.Rahman AMA, Lopata AL, O'Hehir RE, Robinson JJ, Banoub JH, Helleur RJ. Characterization and de novo sequencing of snow crab tropomyosin enzymatic peptides by both electrospray ionization and matrix-assisted laser desorption ionization QqToF tandem mass spectrometry. J Mass Spectrom. 2010a;45:372–381. doi: 10.1002/jms.1721. [DOI] [PubMed] [Google Scholar]
- 50.Rahman AMA, Lopata AL, Randell EW, Helleur RJ. Absolute quantification method and validation of airborne snow crab allergen tropomyosin using tandem mass spectrometry. Anal Chim Acta. 2010b;681:49–55. doi: 10.1016/j.aca.2010.09.040. [DOI] [PubMed] [Google Scholar]
- 51.Rahman AMA, Kamath SD, Gagné S, Lopata AL, Helleur R. Comprehensive proteomics approach in characterizing and quantifying allergenic proteins from northern shrimp: Toward better occupational asthma prevention. J Proteome Res. 2013;12:647–656. doi: 10.1021/pr300755p. [DOI] [PubMed] [Google Scholar]
- 52.Nagai H, Minatani T, Goto K. Development of a method for crustacean allergens using liquid chromatography/tandem mass spectrometry. J AOAC Int. 2015;98:1355–1365. doi: 10.5740/jaoacint.14-248. [DOI] [PubMed] [Google Scholar]
- 53.Rahman AMA, Gagné S, Helleur RJ. Simultaneous determination of two major snow crab aeroallergens in processing plants by use of isotopic dilution tandem mass spectrometry. Anal Bioanal Chem. 2012;403:821–831. doi: 10.1007/s00216-012-5873-2. [DOI] [PubMed] [Google Scholar]
- 54.Chen Q, Zhang J, Ke X, Lai S, Tao B, Yang J, Mo W, Ren Y. Quantification of bovine β-casein allergen in baked foodstuffs based on ultra-performance liquid chromatography with tandem mass spectrometry. Food Addit Contam Part A Chem Anal Control Expo Risk Assess. 2015;32:25–34. doi: 10.1080/19440049.2014.990994. [DOI] [PMC free article] [PubMed] [Google Scholar]
- 55.Newsome GA, Scholl PF. Quantification of allergenic bovine milk α (S1)-casein in baked goods using an intact 15N-labeled protein internal standard. J Agric Food Chem. 2013;61:5659–5668. doi: 10.1021/jf3015238. [DOI] [PubMed] [Google Scholar]
- 56.Shefcheck KJ, Callahan JH, Musser SM. Confirmation of peanut protein using peptide markers in dark chocolate using liquid chromatography-tandem mass spectrometry (LC-MS/MS) J Agric Food Chem. 2006;54:7953–7959. doi: 10.1021/jf060714e. [DOI] [PubMed] [Google Scholar]
- 57.Pedreschi R, Nørgaard J, Maquet A. Current challenges in detecting food allergens by shotgun and targeted proteomic approaches: a case study on traces of peanut allergens in baked cookies. Nutrients. 2012;4:132–150. doi: 10.3390/nu4020132. [DOI] [PMC free article] [PubMed] [Google Scholar]
- 58.Bignardi C, Elviri L, Penna A, Careri M, Mangia A. Particle-packed column versus silica-based monolithic column for liquid chromatography-electrospray-linear ion trap-tandem mass spectrometry multiallergen trace analysis in foods. J Chromatogr A. 2010;1217:7579–7585. doi: 10.1016/j.chroma.2010.10.037. [DOI] [PubMed] [Google Scholar]
- 59.Mattarozzi M, Bignardi C, Elviri L, Careri M. Rapid shotgun proteomic liquid chromatography-electrospray ionization-tandem mass spectrometry-based method for the lupin (Lupinus albus L) multi-allergen determination in foods. J Agric Food Chem. 2012;60:5841–5846. doi: 10.1021/jf302105r. [DOI] [PubMed] [Google Scholar]
- 60.Gygi SP. The AQUA strategy for quantitative proteomics. 57th ASMS Conference on Mass Spectrometry and Allied Topics; 2009. [Google Scholar]
- 61.Mallick P, Schirle M, Chen SS, Flory MR, Lee H, Martin D, Ranish J, Raught B, Schmitt R, Werner T, Kuster B, Aebersold R. Computational prediction of proteotypic peptides for quantitative proteomics. Nature Biotechnol. 2007;25:125–131. doi: 10.1038/nbt1275. [DOI] [PubMed] [Google Scholar]
- 62.Keil B. Specificity of Proteolysis. Berlin: Springer-Verlag; 1992. [Google Scholar]
- 63.Rodriguez J, Gupta N, Smith RD, Pevzner PA. Does trypsin cut before proline. J Proteome Res. 2007;7:300–305. doi: 10.1021/pr0705035. [DOI] [PubMed] [Google Scholar]
- 64.Johnson PE, Baumgartner S, Aldick T, Bessant C, Giosafatto V, Heick J, Mamone G, O'Connor G, Poms R, Popping B, Reuter A, Ulberth F, Watson A, Monaci L, Mills EN. Current perspectives and recommendations for the development of mass spectrometry methods for the determination of allergens in foods. J AOAC Int. 2011;94:1026–1033. [PubMed] [Google Scholar]
- 65.Meng ZJ, Veenstra TD. Targeted mass spectrometry approaches for protein biomarker verification. J Proteomics. 2011;74:2650–2659. doi: 10.1016/j.jprot.2011.04.011. [DOI] [PubMed] [Google Scholar]
- 66.Gerber SA, Rush J, Stemman O, Kirschner MW, Gygi SP. Absolute quantification of proteins and phosphoproteins from cell lysates by tandem MS. Proc Natl Acad Sci USA. 2003;100:6940–6945. doi: 10.1073/pnas.0832254100. [DOI] [PMC free article] [PubMed] [Google Scholar]
- 67.MacLean B, Tomazela DM, Shulman N, Chambers M, Finney GL, Frewen B, Kern R, Tabb DL, Liebler DC, MacCoss MJ. Skyline: an open source document editor for creating and analyzing targeted proteomics experiments. Bioinformatics. 2010;26:966–968. doi: 10.1093/bioinformatics/btq054. [DOI] [PMC free article] [PubMed] [Google Scholar]
- 68.Liebler DC, Zimmerman LJ. Targeted quantitation of proteins by mass spectrometry. Biochemistry. 2013;52:3797–3806. doi: 10.1021/bi400110b. [DOI] [PMC free article] [PubMed] [Google Scholar]
- 69.Egertson JD, MacLean B, Johnson R, Xuan Y, MacCoss MJ. Multiplexed peptide analysis using data-independent acquisition and Skyline. Nat Protoc. 2015;10:887–903. doi: 10.1038/nprot.2015.055. [DOI] [PMC free article] [PubMed] [Google Scholar]
- 70.Reiter L, Rinner O, Picotti P, Hüttenhain R, Beck M, Brusniak MY, Hengartner MO, Aebersold R. mProphet: automated data processing and statistical validation for large-scale SRM experiments. Nat Methods. 2011;8:430–435. doi: 10.1038/nmeth.1584. [DOI] [PubMed] [Google Scholar]
- 71.Kusebauch U, Deutsch EW, Campbell DS, Sun Z, Farrah T, Moritz RL. Using PeptideAtlas, SRMAtlas, and PASSEL: Comprehensive Resources for Discovery and Targeted Proteomics. Curr Protoc Bioinformatics. 2014;46:13.25.1–13.25.28. doi: 10.1002/0471250953.bi1325s46. [DOI] [PMC free article] [PubMed] [Google Scholar]
- 72.Kitteringham NR, Jenkins RE, Lane CS, Elliott VL, Park BK. Multiple reaction monitoring for quantitative biomarker analysis in proteomics and metabolomics. J Chromatogr B Analyt Technol Biomed Life Sci. 2009;877:1229–1239. doi: 10.1016/j.jchromb.2008.11.013. [DOI] [PubMed] [Google Scholar]
- 73.Rauh M. LC-MS/MS for protein and peptide quantification in clinical chemistry. J Chromatogr B. 2012;883:59–67. doi: 10.1016/j.jchromb.2011.09.030. [DOI] [PubMed] [Google Scholar]