Abstract
Background
Left ventricular remodeling, as commonly measured by left ventricular ejection fraction (LVEF), is associated with clinical outcomes. Although change in LVEF over time should reflect response to therapy and clinical course, serial measurement of LVEF is inconsistently performed in observational settings, and the incremental prognostic value of change in LVEF has not been well characterized.
Methods and Results
The Beta-Blocker Evaluation of Survival Trial (BEST) measured LVEF by radionuclide ventriculography at baseline and at 3 and 12-months after randomization. We built a series of multivariable models with 16 clinical parameters plus change in LVEF for predicting four major clinical endpoints including the trial’s primary endpoint of all-cause mortality (ACM). Among 2,484 patients with at least one follow-up LVEF, change in LVEF was the second most significant predictor (behind baseline creatinine) of ACM [adjusted hazards ratio for improvement in LVEF by ≥5 units (Responder) versus Non-responder (95% confidence intervals) for ACM = 0.62 (0.52–0.73)]. Other endpoints including heart failure (HF) hospitalization or the composite of ACM and HF hospitalization yielded similar results. LVEF change ≥5 units was associated with a modest increase in discrimination when added to traditional predictors, and was predictive of outcomes in both the bucindolol and placebo treatment groups. LVEF change as a predictor of outcomes was affected by sex and race, with evidence that LVEF improvement is associated with less survival benefit in African-Americans and women.
Conclusions
Serial evaluation for LVEF change predicts both survival and HF hospitalization and provides a dynamic/real-time measure of prognosis in HF with reduced LVEF.
Clinical Trial Registration
http://www.clinicaltrials.gov. Unique identifier: NCT00000560.
Keywords: outcomes research, risk stratification, prognosis
Left ventricular ejection fraction (LVEF) is an important predictor of mortality in heart failure (HF) patients and is used to define many drug and device therapeutic indications.1–8 Improvement in LV remodeling by neurohormonal inhibitor pharmacological therapy or cardiac resynchronization (CRT) is associated with improved survival and reduced HF hospitalizations.5,7–19 Clinical practice guidelines recommend repeat measurement of LVEF when there is a clinical change or need to assess response to therapy.1 Understanding the clinical implications of serial changes in LVEF may help guide the frequency of measurement, anticipate individual patient responses to evidence-based therapy and augment existing risk model calculators.
Despite the apparent importance of changes in LVEF, limited data exist on the link to clinical outcomes. A small (n=160) sub-study of the Cardiac Insufficiency Bisoprolol Study revealed that serial improvement in left ventricular fractional shortening was associated with improved survival.19 A small (n=141) device study has shown that incremental LV systolic volume changes of 10% are associated with survival and HF hospitalization.20 While these studies support that serial LV measurements have predictive prognostic value, none of them have been performed in a large patient cohort with an extensive number of clinical events, featured a systematic approach to timing of LVEF measurements, employed a consistent method of LVEF assessment, or investigated changes in LVEF by race or sex.13,20–23
We therefore set out to characterize changes in LVEF and their association with clinical outcomes in the Beta-Blocker Evaluation in Survival Trial (BEST). BEST included 2708 racially diverse patients with advanced [New York Heart Association (NYHA) class III or IV] HF in whom LVEF measurements were obtained at regular intervals by a single modality, radionuclide ventriculograms (RVG), that included core laboratory oversight, and adjudication of etiology of mortality etiology by an independent clinical events committee (CEC). Based on the degree of RVG LVEF change that is accompanied by favorable molecular phenotypic changes,24,25 we hypothesized that improvement in LVEF and specifically an increase by ≥5 units would be a strong predictor of reduction in major HF clinical endpoints.
METHODS
The design and primary findings of BEST have been published previously.26,27 Briefly, BEST was a randomized, placebo-controlled Phase 3 mortality trial conducted between 1995–1999 to test the efficacy of bucindolol for preventing ACM in patients with advanced HF with reduced left ventricular ejection fraction (HFrEF). Eligible patients were 18 years or older with LVEF ≤35%, NYHA functional class III or IV secondary to ischemic or non-ischemic HF.26 All patients were on optimal medical therapy (as defined at that time) for at least one month prior to enrollment, which included an angiotensin converting enzyme inhibitor (ACEI) or an angiotensin receptor blocker (ARB) if ACEI intolerant, diuretics as needed, and during the first 2 years of the trial digoxin (until contemporary literature led to a change in the indication to optional).26 Ninety-two percent of patients were receiving an ACEI with an additional 6% receiving an ARB, 92% were receiving digoxin, and 94% were receiving diuretics. Inclusion/exclusion criteria were typical for a HFrEF trial.26 Patients were followed for a mean of two years, with regular study visits at 3-month, 6-month, 12-month and then every 6 months. Written informed consent was obtained for each patient at each clinical site in the BEST trial, as previously described.26
Sample Size
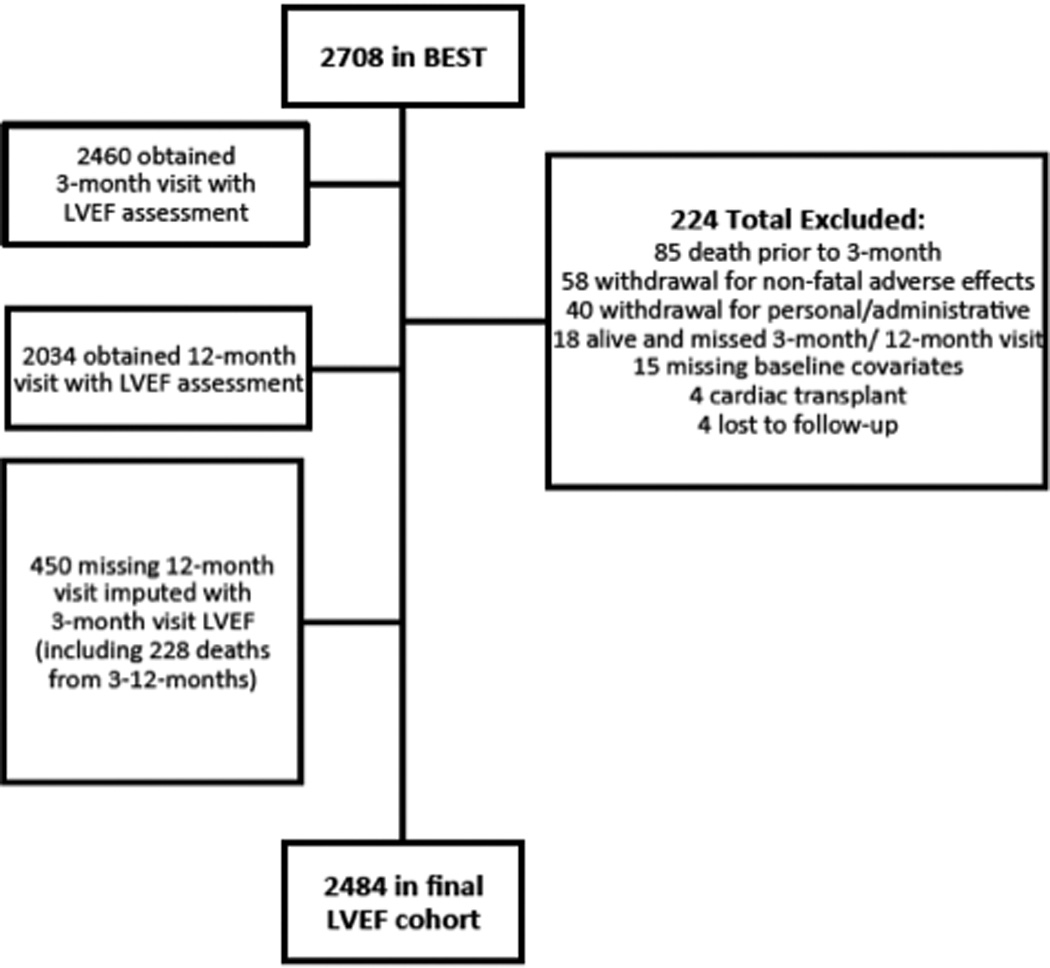
The BEST trial randomized 2708 patients, which defines the entire cohort. Baseline and 3-month RVGs were completed in 2460 patients while a total of 2034 patients had baseline and 12-month RVGs. Missing 12-month LVEF values (n=450) were imputed from 3-month values, including the 228 patients who died between 3-months and 12-months. Thus patients had to have LVEF not available at both the month 3 and month 12 visits to be excluded from the analysis (Figure 1). Reasons for patients’ exclusion were 1) 85 deaths before the month-3 visit, 2) 58 non-fatal adverse effects leading to study withdrawal, 3) 40 withdrawals for personal/administrative reasons, 4) 4 cardiac transplants, and 5) 37 for missed follow-up visits or other reasons. The final study population was 2484 patients, 1226 in the bucindolol group and 1258 in the placebo group, constituting the LVEF analysis cohort.
Figure 1. Flowchart of Patients.
LVEF Measures
Serial LVEF measures were a secondary endpoint in BEST. The patients underwent RVG within the 60 days prior to randomization, with repeat RVG at 3-months (92 ± 8.8 days) and 12-months (366 ± 17.3 days) post-randomization.26 LVEF data were calculated by site personnel using commercially available analytic methods and software. Quality control oversight of the RVG methodology was provided by the trial and performed in the Cardiac Imaging Core Laboratory at Tufts Medical Center in Boston, Massachusetts on the first 2 studies at each site and approximately 5% of the studies thereafter. On the three quality assurance rounds, 73–76% of the studies were assessed as good quality, and 67–76% were reported as having no technical problems. Analysis of the remaining RVGs, i.e. those of fair or poor quality or having a technical problem, was repeated. LVEF values including changes from baseline are given as mean ± Standard Deviation.
Outcomes
The outcomes of interest for the current study were time to first event of all-cause mortality (ACM), the primary endpoint of BEST; cardiovascular mortality (CVM); HF hospitalization; and ACM or HF hospitalization assessed in the total LVEF analysis cohort irrespective of treatment group. HF hospitalization was identified by study investigators on hospitalization case report forms. A post-hoc adjudication by the independent endpoints committee28 revealed similar classification of HF hospitalization events.
Predictors
In order to assess the independent association of changes in LVEF with outcomes, Cox proportional hazards regression models were constructed for each endpoint from a set of eligible predictors in step-wise fashion. The set of eligible HF predictors was selected based on characteristics that could potentially affect the study hypothesis (LVEF change), subgroups predefined in the BEST protocol (presence or absence of coronary artery disease, sex, race, age (years/10), LVEF, (baseline LVEF <20% versus ≥ 20%), serum sodium concentration (milliequivalents/liter (MEq/L)/5), NYHA functional class, creatinine, heart rate (beats per minute/10), heart rhythm (sinus rhythm versus (vs.) atrial fibrillation), systolic blood pressure millimeters of mercury (mmHg)/10, and veterans affairs medical center (VAMC) clinical site vs. non-VAMC site,26,29,30) and additional predictors which have been associated with HF outcomes (volume overload at baseline, HF duration (months/25), and presence of diabetes).2,3 The predefined subgroup variable of baseline norepinephrine was not included in the model because of a large number of missing values.31
Statistical Analysis
Cox models were initially constructed using continuous LVEF change data [change at 12-months with 3-month observation carried forward (LOCF)], and the various baseline input variables were rank-ordered by significance level. Once the models were constructed for each endpoint, the continuous change in LVEF predictor was replaced with an indicator of LVEF Responder (absolute change in LVEF from baseline to 12-month ≥5 units, with LOCF from 3-months) vs. Non-responder (all others) in order to calculate hazard ratios to quantify the impact of LVEF Responder/Non-responder vs. other variables. Baseline patient characteristics for the total study population and the LVEF analysis cohort were analyzed with descriptive statistics. In the stepwise model, new baseline predictors were added for a significance level of 0.25, and predictors were retained for a significance level of 0.20. C-index was calculated for the models with and without the LVEF Responder term.
Supportive secondary analyses were also performed using a Landmark approach32 and a time-dependent covariate approach.33 Since LVEF was assessed at baseline, month 3, and month 12 a natural study interval was created for Landmark analysis at 12-months. This analysis excluded all patients missing 3-month or 12-month LVEF measurements (n=450), which left 2034 patients available for assessment of endpoints starting at the month 12 visit. Baseline predictors were applied to the models as above.
The time-dependent covariate approach used change from baseline LVEF at the time of each event. In this approach, a full study (n=2708) dataset was constructed with estimated month 3 and month 12 values, which were derived via interpolation for subjects with post-baseline LVEF data. LVEF values at month 3 and month 12 were imputed, and interpolation was then used to estimate LVEF at times of events occurring prior to the actual or imputed month 12 visit. For events after this visit, LVEF was estimated via LOCF of the actual or imputed month 12 value. This approach described in more detail in the Supplement enabled all observed study deaths and hospitalization events to be included in the models.
Additional secondary analyses stratifying by self-identified race [African-American (AA), self-identified vs. Non-AA] and sex for each outcome were also performed using the model with an input of LVEF Responder/Non-responder. Statistical analyses were performed using SAS 9.3 (Cary, NC), and the significance level was set at 0.05 for all tests.
RESULTS
In the LVEF analysis cohort of 2484 patients, the mean ± SD baseline LVEF was 23.1% ± 7.3%. The average age was 60 years, 78% were men, 22% were AA, 58% had ischemic etiology, and 92% were NYHA functional Class III (Table 1). At 3-months, the mean LVEF change was 3.8 units ± standard error (SE) 0.2 with 39% of patients showing ≥5 units improvement; at 12-months, the mean LVEF change was 4.5 units ± SE 0.2 with 42% of patients showing ≥5 units improvement (Table 2, Figures 2a–2b). When patients were subdivided into Responders (LVEF improvement ≥5 units) or Non-responders (all others), there were more responders in the bucindolol treatment group vs. placebo group (52% vs. 33%, p<0.0001). All clinical events occurred more commonly in patients who did not have ≥5 units LVEF improvement (Non-responders, Table 3, Figure 2c).
Table 1.
Baseline Characteristics
| Characteristic | LVEF Change Cohort1 n = 2484 |
Entire BEST Cohort n = 2708 |
|---|---|---|
| Age (year) | 60.3 ± 12.2 | 60.3 ± 12.4 |
| Male (%) | 1951 (78%) | 2115 (78%) |
| Non-African-American (%) | 1925 (78%) | 2081 (77%) |
| Caucasian (%) | 1756 (71%) | 1896 (70%) |
| African-American (%) | 559 (22%) | 627 (23%) |
| Heart Failure History | ||
| Left ventricular ejection fraction (%) at baseline |
23.1 ± 7.3 | 23.0 ± 7.3 |
| Ischemic etiology (%) | 1444 (58%) | 1587 (59%) |
| Heart failure duration, months | 48.9 ± 48.0 | 49.4 ± 48.4 |
| NYHA III (%) | 2292 (92%) | 2482 (92%) |
| Fluid Overload (%) | 878 (35%) | 976 (36%) |
| Digoxin (%) | 2292 (92%) | 2495 (92%) |
| Comorbidities | ||
| Active atrial fibrillation (%) | 277 (12%) | 303 (11%) |
| Diabetes (%) | 901 (36%) | 964 (36%) |
| Hypertension (%) | 1464 (59%) | 1596 (59%) |
| Vital Signs | ||
| Resting heart rate (bpm) | 82.0 ± 13.4 | 82.2 ± 13.4 |
| Systolic blood pressure (mmHg) |
117.6 ± 18.1 | 117.1 ± 18.0 |
| Laboratory values | ||
| Creatinine, mg/dL | 1.2 ± 0.4 | 1.2 ± 0.4 |
| Plasma venous norepinephrine, pg/mL |
495.9 ± 298.9 | 515.4 ± 344.3 |
Missing LVEF results at month 12 visits are replaced with month 3 visit results when available, following the last-observation-carried-forward approach.
Mean ± standard deviation is presented for all continuous variables.
BEST indicates Beta-Blocker Evaluation in Survival Trial; Bpm, beats per minute; mg/dL, milligrams/ deciliter; mmHg, millimeters of mercury; pg/mL, picograms/milliliter.
Table 2.
Absolute Change in LVEF
| Interval | LVEF Measured |
Mean Change LVEF (% ± SE) |
≥5 units Decrease |
Unchanged |
≥5 units Increase |
≥10 units Increase |
|---|---|---|---|---|---|---|
| 3-Month | 2460 | 3.8 ± 0.2 | 226 (9%) | 1279 (52%) | 955 (39%) | 444 (18%) |
| Bucindolol | 1216 | 5.5 ± 0.2 | 72 (6%) | 551 (45%) | 593 (49%) | 305 (25%) |
| Placebo | 1244 | 2.1 ± 0.2 | 154 (12%) | 728 (59%) | 362 (29%) | 139 (11%) |
| 12-Month1 | 2484 | 4.5 ± 0.2 | 284 (11%) | 1149 (46%) | 1051 (42%) | 563 (23%) |
| Bucindolol | 1226 | 6.5 ± 0.3 | 94 (8%) | 495 (40%) | 637 (52%) | 369 (30%) |
| Placebo | 1258 | 2.7 ± 0.2 | 190 (15%) | 654 (52%) | 414 (33%) | 194 (15%) |
indicates 12-month values and last carried forward value from 3-month. Number (%) is presented for all population variables; SE indicates standard error. Unchanged represents −4 to 4 units LVEF absolute change.
Note: The dataset created for the time-dependent covariate approach has values for all 2708 patients at protocol-specified month 3 (day 90) and month 12 (day 365) visits. For patients with LVEF collected at those visits, linear interpolation or linear extrapolation was used to calculate LVEF on exactly days 90 and 365 (See Supplement). Then, for patients without these visit results, multiple imputation was used. The mean and standard errors for change from baseline for this dataset is Day 90 = 3.7 ± 0.1 and Day 365 = 4.8 ± 0.2.
Figure 2. Change in 12-Month LVEF and Risk of ACM.
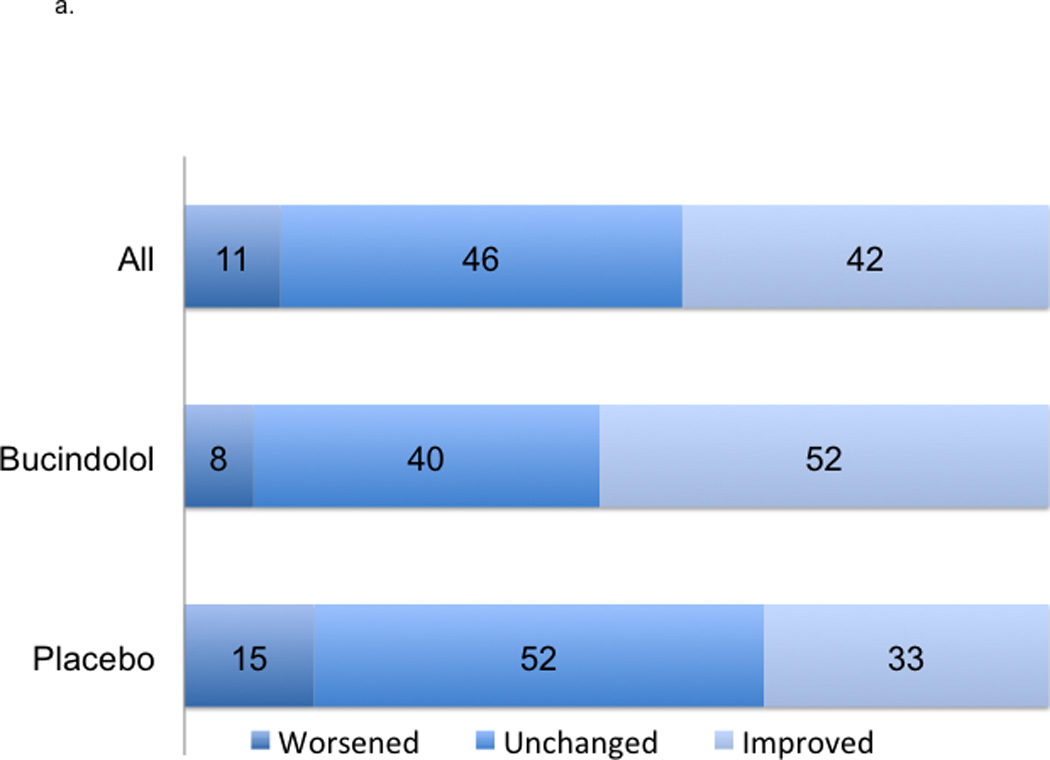
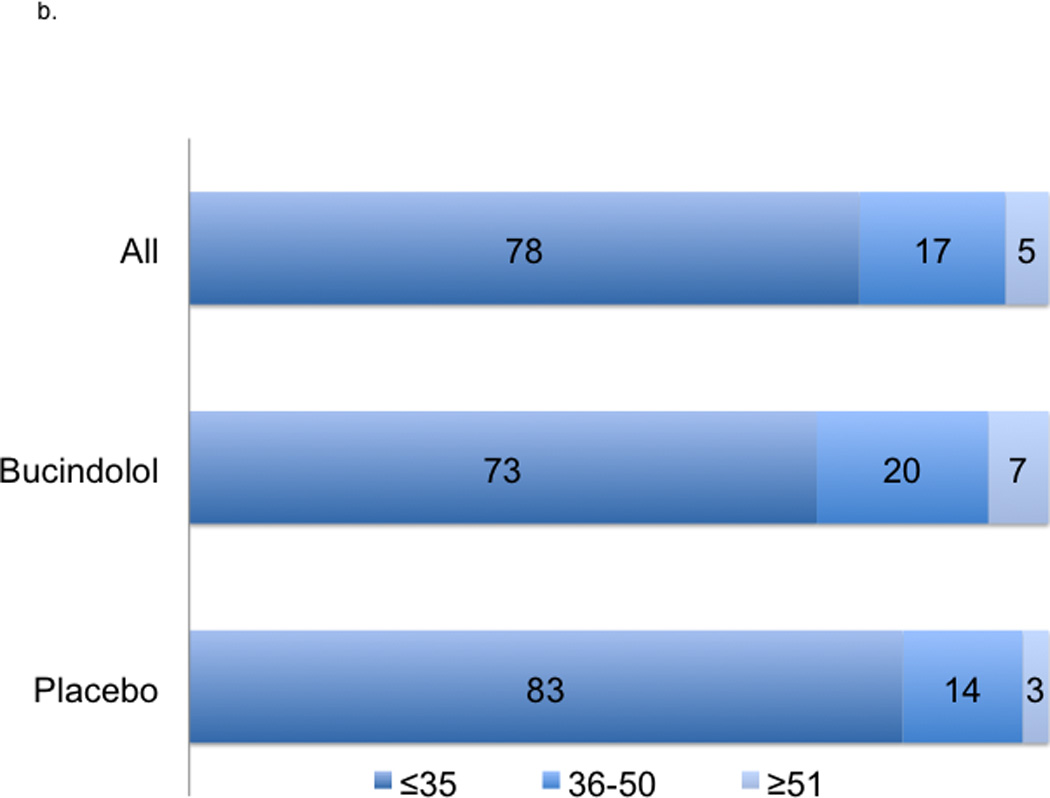
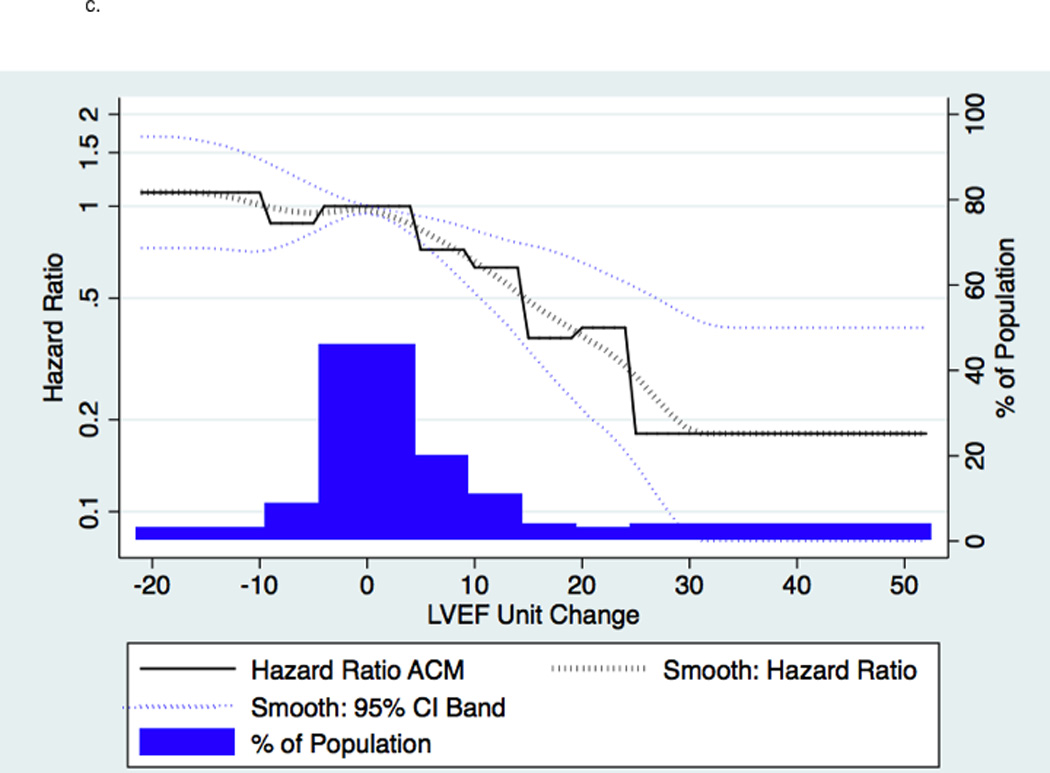
2a indicates absolute changes with treatment at 12-month; worsened, ≤−5 units; unchanged, −4 to 4 units, and improved ≥5 units. 2b indicates LVEF at 12-months. 2c indicates a histogram of absolute units change in histogram and linear plot of hazard ratio of ACM based upon absolute units change in LVEF compared to unchanged LVEF; the dotted black line indicates local polynomial smoothing of the ACM hazard ratio; dotted blue lines, 95% Confidence Interval (CI) band of ACM hazard ratio with local polynomial smoothing.
Table 3.
Event Predicted by ≥5 units LVEF 12-Month Change Over 3-Year Follow-up
|
Event / Modeling Approach |
Responders | Non-responders | Model Without LVEF Response Indicator C-Statistic |
Model With LVEF Response Indicator |
|||
|---|---|---|---|---|---|---|---|
| Patients1 | Event2 | Patients1 | Event2 | HR | C-Statistic | ||
| ACM | |||||||
| LVEF Change at 12 Months / Full Follow-up |
1051 (42%) | 224 (21%) | 1433 (58%) | 463 (32%) | 0.68 | 0.62 (0.52–0.73) |
0.69 |
| LVEF Change at 12 Months / Landmark |
914 (45%) | 148 (16%) | 1120 (55%) | 268 (24%) | 0.64 (0.52–0.78) |
||
| LVEF as Time Dependent Covariate / Full Follow-up |
1162 (43%) | 288 (25%) | 1546 (57%) | 553 (36%) | 0.77 (0.66–0.89) |
||
| CVM | |||||||
| LVEF Change at 12 Months / Full Follow-up |
1051 (42%) | 174 (17%) | 1433 (58%) | 407 (28%) | 0.69 | 0.54 (0.45–0.65) |
0.70 |
| LVEF Change at 12 Months / Landmark |
914 (45%) | 111 (12%) | 1120 (55%) | 235 (21%) | 0.55 (0.43–0.69) |
||
| LVEF as Time Dependent Covariate / Full Follow-up |
1162 (43%) | 229 (20%) | 1546 (57%) | 485 (31%) | 0.70 (0.60–0.83) |
||
| HF Hospitalization | |||||||
| LVEF Change at 12 Months / Full Follow-up |
1022 (41%) | 309 (30%) | 1462 (59%) | 629 (43%) | 0.65 | 0.66 (0.57–0.76) |
0.66 |
| LVEF Change at 12 Months / Landmark |
914 (45%) | 197 (22%) | 1120 (55%) | 335 (30%) | 0.65 (0.55–0.78) |
||
| LVEF as Time Dependent Covariate / Full Follow-up |
1068 (39%) | 285 (27%) | 1640 (61%) | 757 (46%) | 0.66 (0.56–0.78) |
||
| ACM or HF Hospitalization | |||||||
| LVEF Change at 12 Months / Full Follow-up |
1022 (41%) | 418 (41%) | 1462 (59%) | 814 (56%) | 0.65 | 0.67 (0.59–0.76) |
0.66 |
| LVEF Change at 12 Months / Landmark |
914 (45%) | 272 (30%) | 1120 (55%) | 468 (42%) | 0.64 (0.54–0.74) |
||
| LVEF as Time Dependent Covariate / Full Follow-up |
1068 (39%) | 419 (39%) | 1640 (61%) | 997 (61%) | 0.70 (0.62–0.80) |
||
The total number of patients was 2484. Number (%) is presented for all variables. ACM indicates all-cause mortality; CVM, cardiovascular mortality; HFH, heart failure hospitalization; and LVEF, left ventricular ejection fraction. Hazard Ratio (HR) with 95% confidence intervals are shown.
indicates the rate of response/non-response among total patients;
, the rate of events among the Responders or Non-responders.
The baseline values of the following 16 standard heart failure predictors were eligible to be included in each model in a step-wise fashion: active atrial fibrillation on enrollment, age, CAD, creatinine, diabetes, duration of HF, fluid overload on enrollment, heart rate, LVEF baseline (stratified by ≤20% and >20%), NYHA class, race, sex, site type, sodium, study treatment group, and SBP. In addition, the change from baseline to the 12-month visit in LVEF (with replacement of missing values with the 3-month result) was included as an eligible predictor. Once the models were constructed for each endpoint, the continuous change in LVEF predictor was replaced with an indicator of LVEF Responder (change in LVEF from baseline to month 12 ≥5 units) vs. Non-responder (change in LVEF from baseline to month 12 <5 units) in order to calculate hazard ratios to quantify the impact of LVEF response of this magnitude. C-index was calculated for the models with and without the LVEF ≥5 units change term and all were found to be significant at p<0.001. The event counts increase in the time-dependent covariate approach because all study patients are included compared to patients without LVEF at months 3 and 12 being omitted in the original approach.
A ≥5 units LVEF improvement (Responder status) was associated with significant risk reduction in all clinical endpoints, following adjustment and regardless of treatment group. The predictors chosen for the Cox model for each endpoint appear in Figures 3a–3d in the order in which they were statistically selected. For ACM, LVEF Responders/Non-responders had a hazard ratio (95% Confidence Intervals) of 0.62 (0.52–0.73) in the total LVEF analysis cohort (Figure 3a), 0.59 (0.47–0.74) in the bucindolol-treated subgroup (Figure 4a), and 0.65 (0.52–0.82) in the placebo-treated subgroup (interaction p = 0.58, Figure 4a). For CVM, the Responders/Non-responders hazard ratio was 0.54 (0.45–0.65) in the total LVEF analysis cohort (Figure 3b), 0.53 (0.41–0.68) in the bucindolol subgroup (Figure 4a) and 0.55 (0.43–0.72) in the placebo subgroup (interaction p = 0.90, Figure 4a). For HF hospitalization, Responders/Non-responders had a hazard ratio of 0.66 (0.57–0.76) in the total LVEF analysis cohort (Figure 3c), 0.69 (0.56–0.84) in the bucindolol subgroup (Figure 4a) and 0.64 (0.53–0.78) in the placebo subgroup (interaction p = 0.78, Figure 4a). For ACM or HF hospitalization, the Responders/Non-responders had a hazard ratio of 0.67 (0.59–0.76) (Figure 3d) in the total LVEF analysis cohort, 0.67 (0.56–0.79) in the bucindolol subgroup (Figure 4a), and 0.68 (0.58–0.81) in the placebo subgroup (interaction p = 0.57, Figure 4a). Of all clinical predictors, LVEF change and serum creatinine demonstrated the most consistent relationship to risk of ACM, CVM, HF hospitalization, and ACM or HF hospitalization. LVEF responder ≥5 units resulted in a modest increase in C-index when added to the models with the other selected predictors compared to traditional predictor models (Table 3 and Figure 4). In addition, the risk for ACM declines with greater serial change in LVEF (Table 4).
Figure 3. Hazard Ratio of Outcome Based Upon Predictors of ACM, CVM, HF Hospitalization, and ACM or HF Hospitalization.
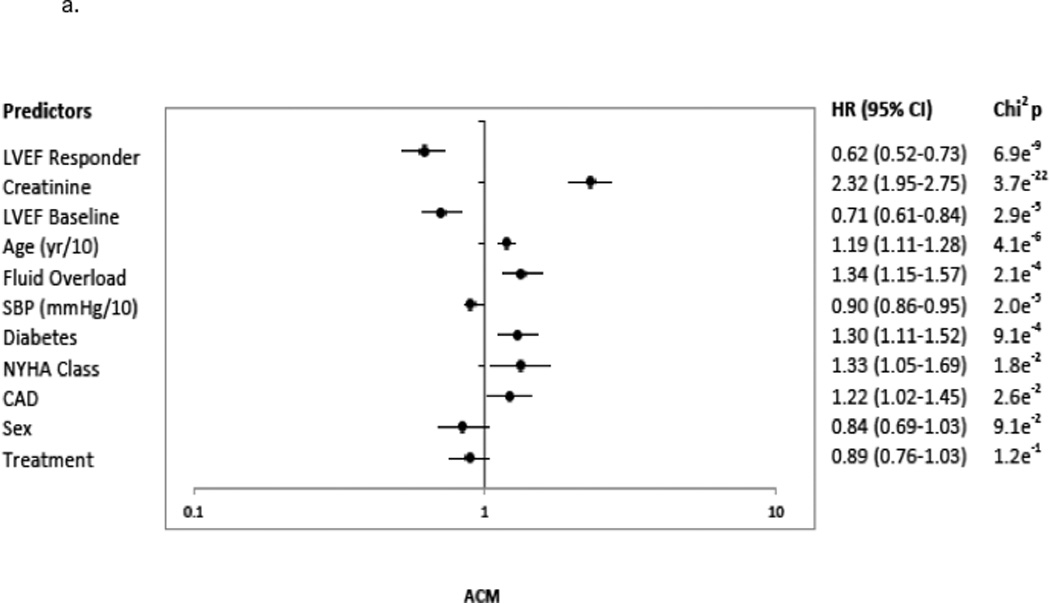
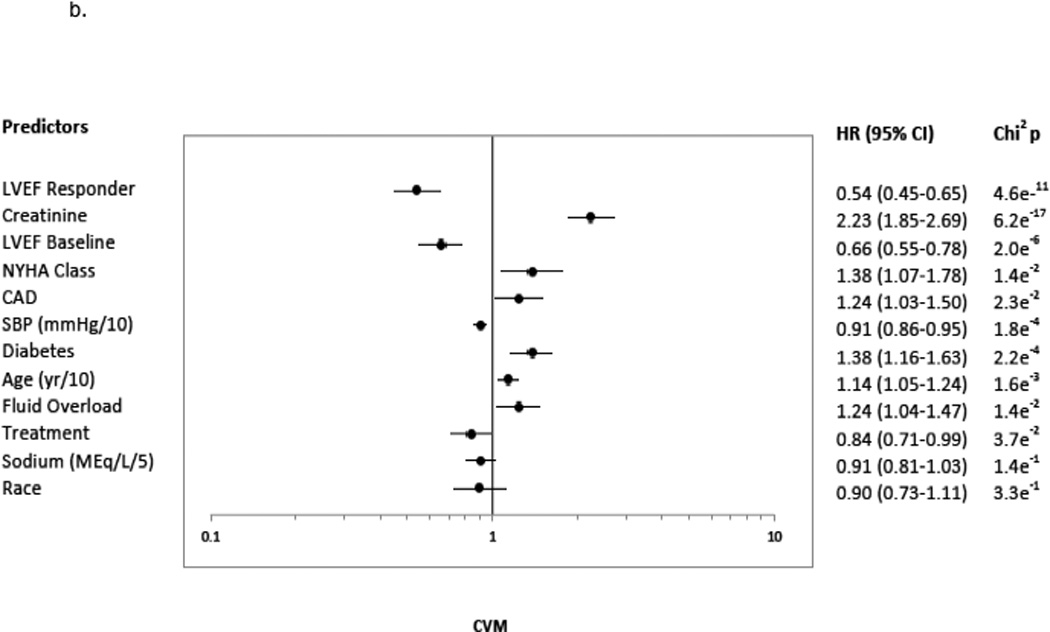
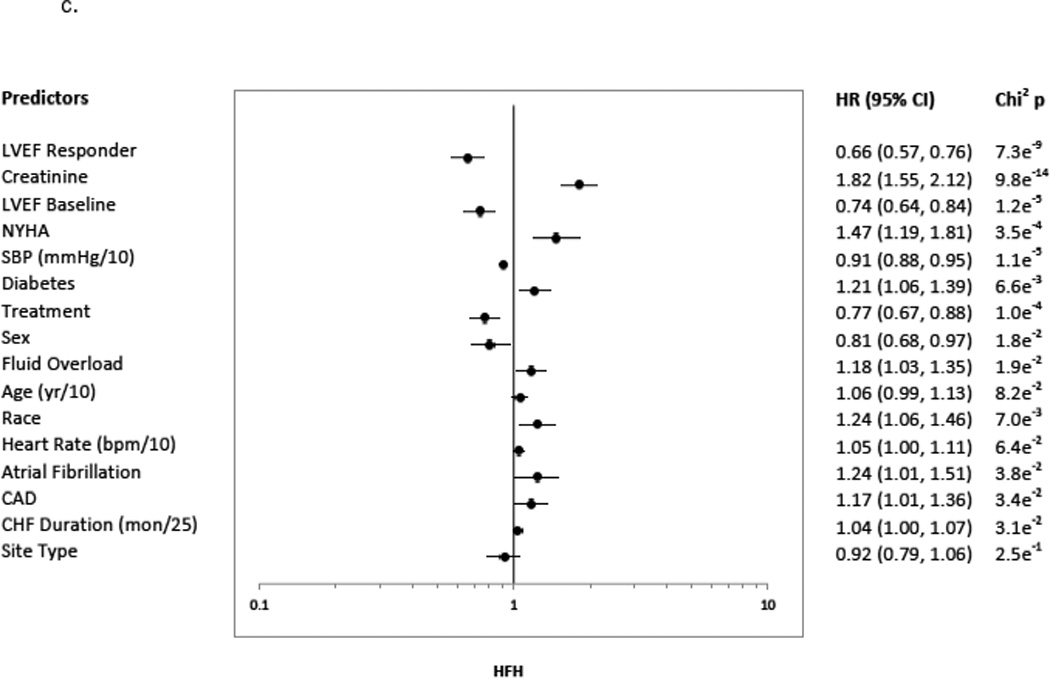
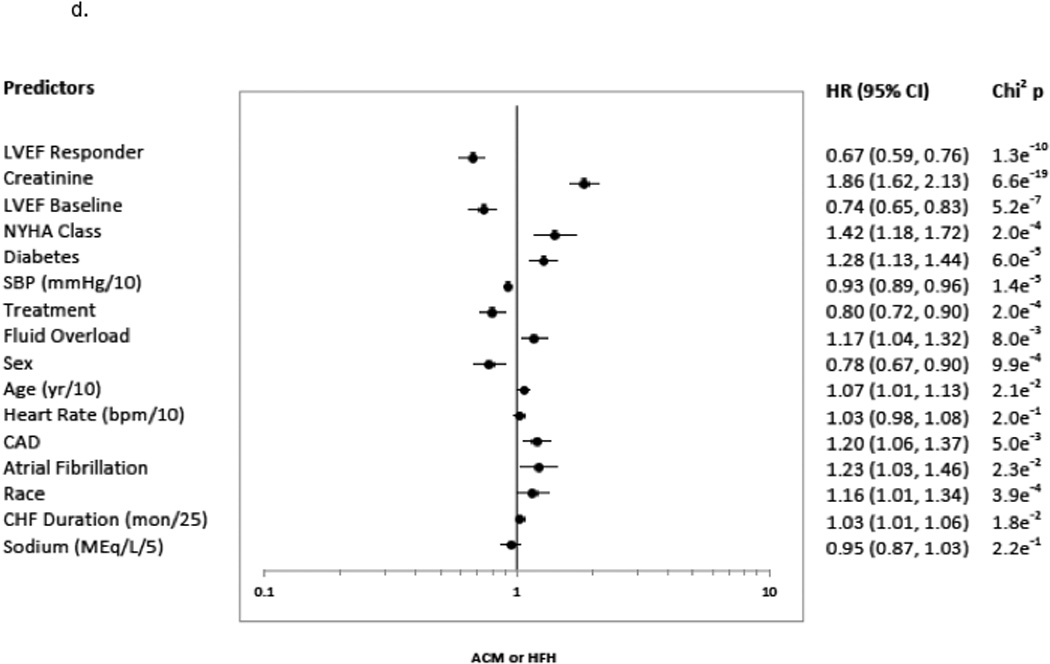
3a indicates ACM; 3b, CVM; 3c, HFH, HF Hospitalization; and 3d, ACM or HFH. The predictors included the presence versus absence of disease in binary fashion unless noted otherwise: age (continuous: years (yr)/10); atrial fibrillation; CAD, coronary artery disease; CHF, congestive heart failure duration (continuous variable in months (mon)/25); creatinine (continuous: mg/dL); diabetes; LVEF, baseline left ventricular ejection fraction <20% versus ≥ 20%; fluid overload; heart rate (continuous: beats per minute (bpm)/10); LVEF Responder, change in LVEF from baseline to month 12 ≥5 units; NYHA, New York Heart Association class 3 versus 4; race, African-American versus Non-African-American; SBP, systolic blood pressure (continuous: millimeters of mercury (mmHg)/10); Sex, males versus females; Site type, Veteran Affairs Medical Center vs. non-veteran affairs medical center; Sodium (continuous: milliequivalents/liter (MEq/L)/5); and Treatment, treatment group bucindolol vs. placebo. Chi2p indicates the chi squared p-value.
Figure 4. Risk of Event for ≥5 Units LVEF 12-Month Change Stratified by Subgroup.
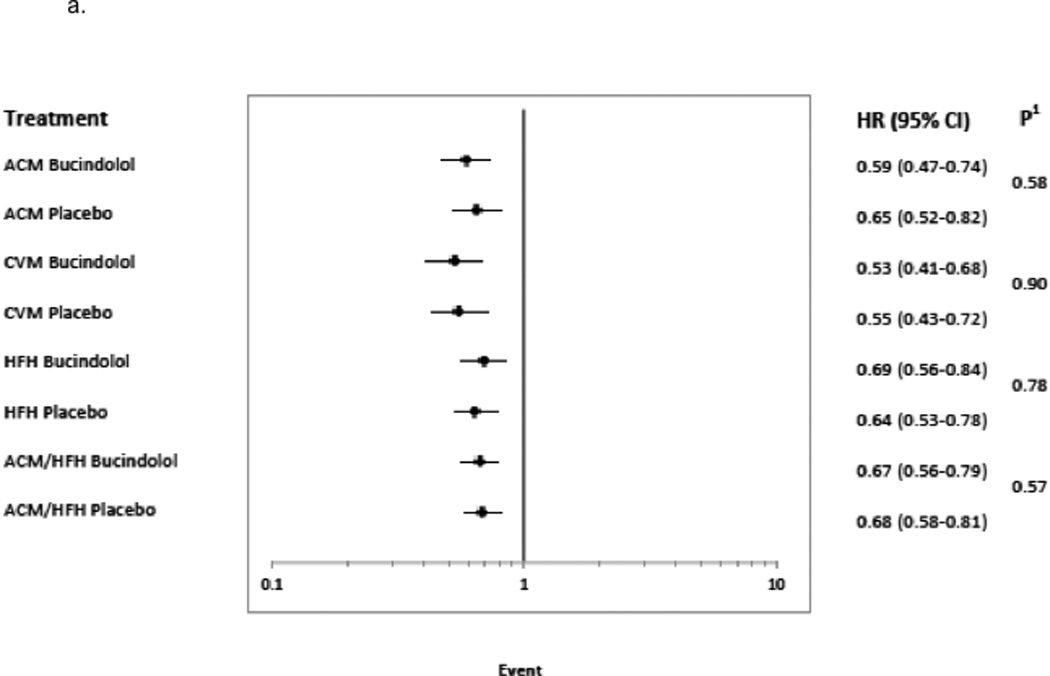
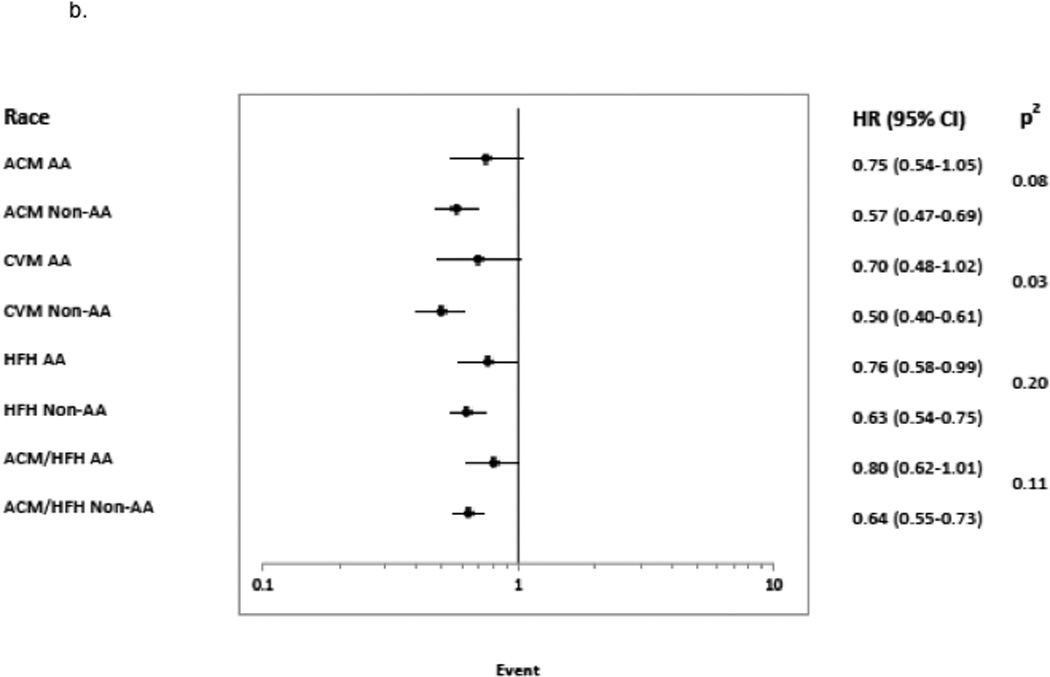
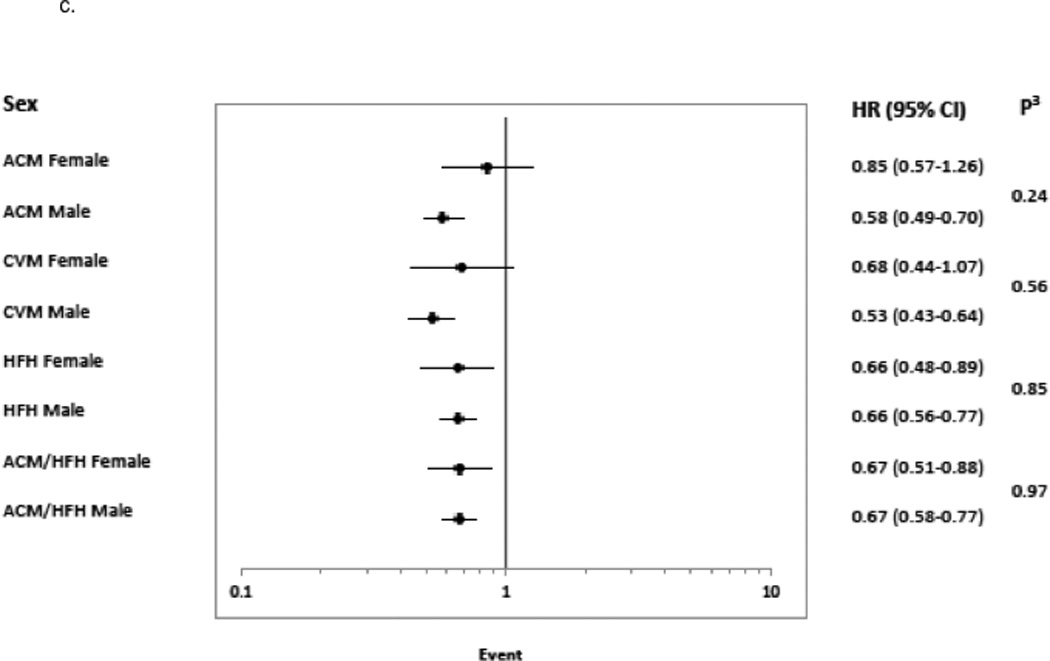
Hazard Ratio with 95% confidence intervals are shown for subgroups 4a. treatment group (bucindolol and placebo), 4b. race (African-American, AA and Non-African-American, Non-AA), and 4c. sex.1 indicates Cox model test for significance of treatment × LVEF response indicator interaction;2, Cox model test for significance of race × LVEF response indicator interaction;3, Cox model test for significance of sex × LVEF response indicator interaction; ACM, all-cause mortality; CVM, cardiovascular mortality; and HFH, heart failure hospitalization.
Table 4.
Risk of ACM Based Upon LVEF Units Change with Different Responder Definitions
| Responder vs. Non-responder |
Responders | Non-responders | Responder HR | ||
|---|---|---|---|---|---|
| Patients1 | ACM2 | Patients1 | ACM2 | ||
| ≥ 10 vs <10 | 563 (23%) | 91 (16%) | 1921 (77%) | 596 (31%) | 0.51 (0.41–0.64) |
| ≥ 5 vs <5 | 1051 (42%) | 224 (21%) | 1433 (58%) | 463 (32%) | 0.60 (0.51–0.71) |
| ≥ 0 vs <0 | 1762 (71%) | 450 (26%) | 722 (29%) | 237 (33%) | 0.69 (0.59–0.81) |
| ≥ −5 vs <−5 | 2263 (91%) | 626 (28%) | 221 (9%) | 61 (28%) | 0.93 (0.71–1.21) |
The total number of patients was 2484. Number (%) is presented for all variables. ACM indicates all-cause mortality. Hazard Ratio (HR) with 95% confidence intervals are shown.
indicates the rate of Response/Non-response among total patients;
, the rate of events among the Responders or Non-responders.
These results were confirmed using a Landmark analysis approach (Table 3). For ACM, the hazard ratio was 0.64 (0.52–0.78) compared to 0.62 (0.52–0.73) for the original approach. Thus the predictive power of the LVEF Response indicator was maintained with the reduced event set.
The results were also confirmed with the models that employed a time-dependent covariate for LVEF (Table 3). These models included an additional 154 deaths and 104 HF hospitalizations that were omitted from the original approach due to missing values of LVEF and other covariates. For ACM, HR = 0.77 (0.66–0.89) compared to 0.62 (0.52–0.73) for the original approach. For HF hospitalization HR = 0.66 (0.56–0.78) compared to 0.66 (0.57–0.76) with the original approach.
By race, the Responder mortality rate was 44% (244/559) in AAs and (42%) 807/1925 in non-AAs (p = 0.47). The ability to predict risk by ≥5 units LVEF change was similar in AAs and non-AAs for HF hospitalization, but not for mortality endpoints (Figure 4b). For ACM and CVM, Responder vs. Non-responder status in AAs yielded non-significant hazard ratios of respectively 0.75 (0.54–1.05) and 0.70 (0.48–1.02), with interaction test p values of 0.08 and p<0.05 compared to non-AAs who had hazard ratios of 0.57 (0.47–0.69) (ACM) and 0.50 (0.40,0.61) (CVM). In contrast, the Responder/Non-responder HF hospitalization hazard ratio was significant for AAs (0.76 (0.58–0.99)) and closer to the non-AA hazard ratio of 0.63 (0.54–0.75), with a non-significant test for interaction (p = 0.20). The composite endpoint of ACM/HF hospitalization, driven by HF hospitalization rates, also had a non-significant interaction test (p = 0.11) between races.
By sex, the Responder ACM rate was 44% (232/533) in women and 42% (819/1951) in men (p = 0.52). For sex (Figure 4c) and ACM or CVM endpoints, Responder/Non-responder status yielded non-significant hazard ratios in women and statistically significant, lower hazard ratios in men, with non-significant tests for interaction. In contrast, there were no differences between sexes for HF hospitalization or ACM/HF hospitalization, with both women and men exhibiting statistically significant hazard ratios in the 0.66–0.67 range and non-significant tests for interaction.
DISCUSSION
Improvement in LVEF by ≥5 units was a powerful predictor of survival and reduced HF hospitalization, rivaling baseline serum creatinine in predictive value. Importantly, LVEF serial improvement was just as positively predictive in the placebo group as in beta-blocker treated patients with an as expected higher percentage of LVEF improved patients in the bucindolol group. These data provide important information on the meaning of change in LVEF in HFrEF patients. With HF being one of the leading causes of death and rehospitalization in the United States, this information is relevant to health care delivery1,2 inasmuch as change in LVEF provides a dynamic, real-time measure of a patient’s major clinical outcomes risk based on the medical management that is being delivered. Serum creatinine or other risk stratifying static variables measured in this study may provide useful information on prognosis, but do not provide ongoing information relevant to therapeutic management. Other dynamic measures, such as change in B-type natriuretic peptide markers or systemic norepinephrine, could also provide such information, but were not evaluated in the LVEF analysis cohort trial and in addition may have anomalous effects in bucindolol31,34 and other beta-blocker35,36 treated patients.
Despite the limitations of previous investigations of serial changes in LVEF in HFrEF patients, the potential clinical value of such observations has been generally accepted. Repeat LVEF assessment is typically performed per guidelines to assess clinical change and response to beta-blocker or CRT therapy but not in a systematic fashion for prognostic assessment in the outpatient setting.1,37 Multiple validated risk models including the Seattle Heart Failure Model, Heart Failure Survival Score, Meta-analysis Global Group in Chronic Heart Failure Model, and Controlled Rosuvastatin Multinational Trial in Heart Failure Risk Score all have moderate ability to predict mortality but have poor ability to predict risk of HF hospitalization in the ambulatory HF patient.3–6 Each of these models includes LVEF but not serial changes in LVEF. Considering that the current analysis and other smaller studies have consistently shown that serial LVEF change is associated with survival and our data indicate superiority to a single baseline measure, serial LVEF change may provide some incremental predictive performance for existing models.9,13,20–23,38
Several studies have shown that serial LVEF change ≥10 units is associated with mortality, but the lack of standardized methods or small patient population have limited their applicability.13,20–23 A recent study by Zhang et al. showed that a longitudinal 5 units LVEF change had an impact on mortality in HFrEF patients eligible for implantable cardioverter defibrillator.23 The BEST trial had the advantage of routine assessment of LVEF at baseline, 3-month, and 12-month intervals in a large patient population, rather than being performed as clinically indicated in a registry. Furthermore the use of RVG and a Cardiac Imaging Core laboratory providing quality assurance improves the discriminatory ability to identify LVEF and follow longitudinally for change.39 This provides the power to strongly associate change in LVEF ≥5 units with outcomes of survival and HF hospitalization.
We provide the first evidence that race or sex may affect the clinical predictive characteristics of LVEF serial change, with outcomes appearing to differ for mortality vs. HF hospitalization driven endpoints. In contrast to non-AAs, in AAs LVEF Responder status was not predictive for ACM or CVM, but was for HF hospitalization. That the race finding for CVM was meaningful is supported by a test for interaction of p <0.05 endpoint and race. This is an important finding that adds to epidemiological and registry studies that have shown that the magnitude of LVEF change may vary by race and sex, with lower LVEF changes in AA men compared to Caucasian men and women.38,40,41 Our data indicate that even when LVEF improves in AAs there may be less of a mitigating effect on survival compared to non-AAs. As a post-hoc analysis this finding should be considered hypothesis generating, as racial differences in the clinical response to LVEF change could be secondary to differences in baseline characteristics between AAs and non-AAs42 that were not completely adjusted by Cox modeling. However, these findings could also be due to racial genetic differences that influence the response to neurohormonal inhibitors.43 To date, the BEST trial contains one of the largest populations of AA patients, representing 23% of the entire cohort and 22% of the LVEF analysis cohort, but may be underpowered to assess the full benefit of LVEF change by race. The ability to calculate risk in in the AA population is vital, as they may have the greatest benefit given their higher risk for the development and severity of HF.2,40 Further study in this population is indicated.
Sex also appeared to be associated with a differential effect of LVEF change, with higher and non-significant hazard ratios in women vs. men for mortality endpoints, but no difference for HF hospitalization driven endpoints. The data supporting a sex-related difference of LVEF change for mortality endpoints was not as strong as for race, with non-significant tests for interaction. Because of the large contribution of Veterans’ Administration Hospitals as study sites, women were underrepresented (22% of total) in BEST, and as for race the impact of beta-blocker associated reverse remodeling by sex needs further investigation.
Study Limitations
We relied on RVG for LVEF assessment, which delivers reliable data that are consistent across centers but can be impractical given radiation exposure and cost. Although 5 unit change in LVEF has less inter-observer variability by RVG than echocardiogram, intra-observer variability has been less than 5% for echocardiogram and may make serial sonographic measures of LVEF similarly relevant.39,44 This study was performed prior to standard use of the guideline-approved therapies aldosterone antagonists, beta-blockers, and CRT devices. However, contemporaneous studies assessing the value of serial LVEF change have shown findings consistent with this study.9,23 Responder outcome studies have been associated with bias in the absence of Landmark analyses;32 however, in this study Landmark analyses produced similar results to those found with main study methodology. Landmark analyses include risks of misclassification, omitting events, data-driven results, but can be avoided by sensitivity analysis and time-dependent analysis.32 The additional time-dependent covariate approach performed in this study remained supportive of the initial analyses. This was a highly selected trial population with a mean age of 60 years, and thus the findings reported here may not have external validity when applied to large, real-world settings; however, measures of risk tend to have even better discrimination when applied to more homogeneous populations of patients.
CONCLUSIONS
In the BEST study, we found that ≥5 units LVEF change powerfully predicts risk of ACM, CVM, and HF hospitalization in HFrEF. Serial LVEF was performed routinely by a single method in a large diverse patient population and had no deviations in predictability of outcome across treatment groups with the exception of ACM and CVM for AAs and women. Further validation of the incremental prognostic value of change in LVEF for important clinical decisions across various HF populations is needed.
Supplementary Material
Clinical Perspective.
Numerous previous studies have established that in heart failure with reduced ejection fraction (HFrEF) an improvement in left ventricular ejection fraction (LVEF) has a favorable effect on clinical outcomes. However, few of these studies had standardized follow-up surveillance of LVEF change, and in addition information on the relative value of LVEF improvement compared to other predictors of clinical outcome is either lacking or hampered by the lack of standardized protocols. Small observational as well as gene expression studies have suggested that a ≥5 unit LVEF change is meaningful in HFrEF. The BEST study was performed in a large patient cohort with extensive number of clinical events, featured a systematic approach to timing of LVEF measurements, employed a consistent method of LVEF assessment, and investigated changes in LVEF by race or sex. This randomized controlled trial revealed that in the entire cohort (both placebo and bucindolol treated patients) serial assessment for change in cardiac function at 12-month follow-up interval predicts risk in the HFrEF patient, based on improved outcomes including all-cause mortality and heart failure hospitalization driven endpoints being highly statistical significantly with an LVEF improvement of ≥5 units. In multivariate analysis, LVEF change was exceeded only by baseline serum creatinine for predicting outcomes. In addition, the analyses revealed that the magnitude of LVEF change required for improved survival in women and racial/ethnic minorities may by greater than 5 LVEF units, which requires further study. Serial assessment of LVEF should be considered as part of the routine assessment of risk in the HFrEF patient.
Acknowledgments
Sources of Funding: Dr. Breathett received support from a T32 training grant (5T32 HL116276-02) from the National Institute of Health, and the Department of Medicine Health Services Research Development Award Grant from the University of Colorado. Dr. Allen discloses grant funding from NIH (K23 HL105896) and PCORI (CDR-1310-06998). The BEST trial was supported by: the Division of Epidemiology and Clinical Applications of the National Heart, Lung, and Blood Institute; Department of Veteran Affairs Cooperative Studies Program via interagency agreement; and Incara Pharmaceuticals.
Dr. Allen serves as consultant for J&J, Novartis, and St. Jude. Mr. Davis has employment and ownership interest in ARCA Biopharma, which is developing bucindolol for prevention of atrial fibrillation in a genetically defined subpopulation of HFrEF. Dr. Bristow has employment and ownership interest in ARCA Biopharma.
Footnotes
Disclosures: Dr. Udelson has nothing to disclose.
References
- 1.Yancy CW, Jessup M, Bozkurt B, Butler J, Casey DE, Drazner MH, Fonarow GC, Geraci SA, Horwich T, Januzzi JL, Johnson MR, Kasper EK, Levy WC, Masoudi FA, McBride PE, McMurray JJV, Mitchell JE, Peterson PN, Riegel B, Sam F, Stevenson LW, Tang WHW, Tsai EJ, Wilkoff BL. 2013 ACCF/AHA Guideline for the Management of Heart Failure A Report of the American College of Cardiology Foundation/American Heart Association Task Force on Practice Guidelines. Circulation. 2013 doi: 10.1161/CIR.0b013e31829e8776. CIR.0b013e31829e8776. [DOI] [PubMed] [Google Scholar]
- 2.Mozaffarian D, Benjamin EJ, Go AS, Arnett DK, Blaha MJ, Cushman M, Ferranti S de, Després J-P, Fullerton HJ, Howard VJ, Huffman MD, Judd SE, Kissela BM, Lackland DT, Lichtman JH, Lisabeth LD, Liu S, Mackey RH, Matchar DB, McGuire DK, Mohler ER, Moy CS, Muntner P, Mussolino ME, Nasir K, Neumar RW, Nichol G, Palaniappan L, Pandey DK, Reeves MJ, Rodriguez CJ, Sorlie PD, Stein J, Towfighi A, Turan TN, Virani SS, Willey JZ, Woo D, Yeh RW, Turner MB. Heart Disease and Stroke Statistics—2015 Update A Report From the American Heart Association. Circulation. 2014 doi: 10.1161/CIR.0000000000000152. CIR.0000000000000152. [DOI] [PubMed] [Google Scholar]
- 3.Levy WC, Mozaffarian D, Linker DT, Sutradhar SC, Anker SD, Cropp AB, Anand I, Maggioni A, Burton P, Sullivan MD, Pitt B, Poole-Wilson PA, Mann DL, Packer M. The Seattle Heart Failure Model Prediction of Survival in Heart Failure. Circulation. 2006;113:1424–1433. doi: 10.1161/CIRCULATIONAHA.105.584102. [DOI] [PubMed] [Google Scholar]
- 4.Aaronson KD, Schwartz JS, Chen T-M, Wong K-L, Goin JE, Mancini DM. Development and Prospective Validation of a Clinical Index to Predict Survival in Ambulatory Patients Referred for Cardiac Transplant Evaluation. Circulation. 1997;95:2660–2667. doi: 10.1161/01.cir.95.12.2660. [DOI] [PubMed] [Google Scholar]
- 5.Pocock SJ, Ariti CA, McMurray JJV, Maggioni A, Køber L, Squire IB, Swedberg K, Dobson J, Poppe KK, Whalley GA, Doughty RN Meta-Analysis Global Group in Chronic Heart Failure. Predicting survival in heart failure: a risk score based on 39 372 patients from 30 studies. Eur Heart J. 2013;34:1404–1413. doi: 10.1093/eurheartj/ehs337. [DOI] [PubMed] [Google Scholar]
- 6.Wedel H, McMurray JJV, Lindberg M, Wikstrand J, Cleland JGF, Cornel JH, Dunselman P, Hjalmarson Å, Kjekshus J, Komajda M, Kuusi T, Vanhaecke J, Waagstein F on behalf of the CORONA Study Group. Predictors of fatal and non-fatal outcomes in the Controlled Rosuvastatin Multinational Trial in Heart Failure (CORONA): incremental value of apolipoprotein A-1, high-sensitivity C-reactive peptide and N-terminal pro B-type natriuretic peptide. Eur J Heart Fail. 2009;11:281–291. doi: 10.1093/eurjhf/hfn046. [DOI] [PMC free article] [PubMed] [Google Scholar]
- 7.Ouwerkerk W, Voors AA, Zwinderman AH. Factors Influencing the Predictive Power of Models for Predicting Mortality and/or Heart Failure Hospitalization in Patients With Heart Failure. JACC Heart Fail. 2014;2:429–436. doi: 10.1016/j.jchf.2014.04.006. [DOI] [PubMed] [Google Scholar]
- 8.Rahimi K, Bennett D, Conrad N, Williams TM, Basu J, Dwight J, Woodward M, Patel A, McMurray J, MacMahon S. Risk Prediction in Patients With Heart Failure: A Systematic Review and Analysis. JACC Heart Fail. 2014;2:440–446. doi: 10.1016/j.jchf.2014.04.008. [DOI] [PubMed] [Google Scholar]
- 9.Dunlay SM, Roger VL, Weston SA, Jiang R, Redfield MM. Longitudinal Changes in Ejection Fraction in Heart Failure Patients With Preserved and Reduced Ejection Fraction. Circ Heart Fail. 2012;5:720–726. doi: 10.1161/CIRCHEARTFAILURE.111.966366. [DOI] [PMC free article] [PubMed] [Google Scholar]
- 10.Grayburn PA, Appleton CP, DeMaria AN, Greenberg B, Lowes B, Oh J, Plehn JF, Rahko P, St John Sutton M, Eichhorn EJ BEST Trial Echocardiographic Substudy Investigators. Echocardiographic predictors of morbidity and mortality in patients with advanced heart failure: the Beta-blocker Evaluation of Survival Trial (BEST) J Am Coll Cardiol. 2005;45:1064–1071. doi: 10.1016/j.jacc.2004.12.069. [DOI] [PubMed] [Google Scholar]
- 11.Konstam MA, Kramer DG, Patel AR, Maron MS, Udelson JE. Left Ventricular Remodeling in Heart FailureCurrent Concepts in Clinical Significance and Assessment. JACC Cardiovasc Imaging. 2011;4:98–108. doi: 10.1016/j.jcmg.2010.10.008. [DOI] [PubMed] [Google Scholar]
- 12.Lee TH, Hamilton MA, Stevenson LW, Moriguchi JD, Fonarow GC, Child JS, Laks H, Walden JA. Impact of left ventricular cavity size on survival in advanced heart failure. Am J Cardiol. 1993;72:672–676. doi: 10.1016/0002-9149(93)90883-e. [DOI] [PubMed] [Google Scholar]
- 13.Solomon SD, Anavekar N, Skali H, McMurray JJV, Swedberg K, Yusuf S, Granger CB, Michelson EL, Wang D, Pocock S, Pfeffer MA Investigators for the C in HFR in M (CHARM) Influence of Ejection Fraction on Cardiovascular Outcomes in a Broad Spectrum of Heart Failure Patients. Circulation. 2005;112:3738–3744. doi: 10.1161/CIRCULATIONAHA.105.561423. [DOI] [PubMed] [Google Scholar]
- 14.Stanton T, Leano R, Marwick TH. Prediction of All-Cause Mortality From Global Longitudinal Speckle Strain Comparison With Ejection Fraction and Wall Motion Scoring. Circ Cardiovasc Imaging. 2009;2:356–364. doi: 10.1161/CIRCIMAGING.109.862334. [DOI] [PubMed] [Google Scholar]
- 15.St John Sutton M, Pfeffer MA, Plappert T, Rouleau JL, Moyé LA, Dagenais GR, Lamas GA, Klein M, Sussex B, Goldman S. Quantitative two-dimensional echocardiographic measurements are major predictors of adverse cardiovascular events after acute myocardial infarction. The protective effects of captopril. Circulation. 1994;89:68–75. doi: 10.1161/01.cir.89.1.68. [DOI] [PubMed] [Google Scholar]
- 16.Wong M, Staszewsky L, Latini R, Barlera S, Glazer R, Aknay N, Hester A, Anand I, Cohn JN. Severity of left ventricular remodeling defines outcomes and response to therapy in heart failure: Valsartan heart failure trial (Val-HeFT) echocardiographic data. J Am Coll Cardiol. 2004;43:2022–2027. doi: 10.1016/j.jacc.2003.12.053. [DOI] [PubMed] [Google Scholar]
- 17.Schliamser JE, Kadish AH, Subacius H, Shalaby A, Schaechter A, Levine J, Goldberger JJ. Significance of follow-up left ventricular ejection fraction measurements in the Defibrillators in Non-Ischemic Cardiomyopathy Treatment Evaluation trial (DEFINITE) Heart Rhythm. 2013;10:838–846. doi: 10.1016/j.hrthm.2013.02.017. [DOI] [PubMed] [Google Scholar]
- 18.Wilcox JE, Fonarow GC, Yancy CW, Albert NM, Curtis AB, Heywood JT, Inge PJ, McBride ML, Mehra MR, O’Connor CM, Reynolds D, Walsh MN, Gheorghiade M. Factors associated with improvement in ejection fraction in clinical practice among patients with heart failure: findings from IMPROVE HF. Am Heart J. 2012;163:49.e2–56.e2. doi: 10.1016/j.ahj.2011.10.001. [DOI] [PubMed] [Google Scholar]
- 19.Lechat P, Escolano S, Golmard JL, Lardoux H, Witchitz S, Henneman JA, Maisch B, Hetzel M, Jaillon P, Boissel JP, Mallet A. Prognostic value of bisoprolol-induced hemodynamic effects in heart failure during the Cardiac Insufficiency BIsoprolol Study (CIBIS) Circulation. 1997;96:2197–2205. doi: 10.1161/01.cir.96.7.2197. [DOI] [PubMed] [Google Scholar]
- 20.Yu C-M, Bleeker GB, Fung JW-H, Schalij MJ, Zhang Q, Wall EE van der, Chan Y-S, Kong S-L, Bax JJ. Left Ventricular Reverse Remodeling but Not Clinical Improvement Predicts Long-Term Survival After Cardiac Resynchronization Therapy. Circulation. 2005;112:1580–1586. doi: 10.1161/CIRCULATIONAHA.105.538272. [DOI] [PubMed] [Google Scholar]
- 21.Cintron G, Johnson G, Francis G, Cobb F, Cohn JN. Prognostic significance of serial changes in left ventricular ejection fraction in patients with congestive heart failure. The V-HeFT VA Cooperative Studies Group. Circulation. 1993;87:VI17–VI23. [PubMed] [Google Scholar]
- 22.Schelbert HR, Henning H, Ashburn WL, Verba JW, Karliner JS, O’Rourke RA. Serial measurements of left ventricular ejection fraction by radionuclide angiography early and late after myocardial infarction. Am J Cardiol. 1976;38:407–415. doi: 10.1016/0002-9149(76)90455-0. [DOI] [PubMed] [Google Scholar]
- 23.Zhang Y, Guallar E, Blasco-Colmenares E, Butcher B, Norgard S, Nauffal V, Marine JE, Eldadah Z, Dickfeld T, Ellenbogen KA, Tomaselli GF, Cheng A. Changes in Follow-Up Left Ventricular Ejection Fraction Associated With Outcomes in Primary Prevention Implantable Cardioverter-Defibrillator and Cardiac Resynchronization Therapy Device Recipients. J Am Coll Cardiol. 2015;66:524–531. doi: 10.1016/j.jacc.2015.05.057. [DOI] [PMC free article] [PubMed] [Google Scholar]
- 24.Lowes BD, Gilbert EM, Abraham WT, Minobe WA, Larrabee P, Ferguson D, Wolfel EE, Lindenfeld J, Tsvetkova T, Robertson AD, Quaife RA, Bristow MR. Myocardial Gene Expression in Dilated Cardiomyopathy Treated with Beta-Blocking Agents. N Engl J Med. 2002;346:1357–1365. doi: 10.1056/NEJMoa012630. [DOI] [PubMed] [Google Scholar]
- 25.Kao D, Lowes B, Gilbert E, Minobe W, Epperson LE, Meyer L, Ferguson D, Volkman K, Zolty R, Borg D, Quaife R, Bristow M. Therapeutic Molecular Phenotype of β-blocker Associated Reverse-Remodeling in Nonischemic Dilated Cardiomyopathy. Circ Cardiovasc Genet. 2015 doi: 10.1161/CIRCGENETICS.114.000767. CIRCGENETICS.114.000767. [DOI] [PMC free article] [PubMed] [Google Scholar]
- 26.A Trial of the Beta-Blocker Bucindolol in Patients with Advanced Chronic Heart Failure. N Engl J Med. 2001;344:1659–1667. doi: 10.1056/NEJM200105313442202. [DOI] [PubMed] [Google Scholar]
- 27.Design of the Beta-Blocker Evaluation Survival Trial (BEST). The BEST Steering Committee. Am J Cardiol. 1995;75:1220–1223. doi: 10.1016/s0002-9149(99)80766-8. [DOI] [PubMed] [Google Scholar]
- 28.Carson P, Fiuzat M, O’Connor C, Anand I, Plehn J, Lindenfeld JA, Silver M, White M, Miller A, Davis G, Robertson AD, Bristow M, Gottlieb S. Determination of hospitalization type by investigator case report form or adjudication committee in a large heart failure clinical trial (β-Blocker Evaluation of Survival Trial [BEST]) Am Heart J. 2010;160:649–654. doi: 10.1016/j.ahj.2010.07.004. [DOI] [PubMed] [Google Scholar]
- 29.Aleong RG, Sauer WH, Davis G, Murphy GA, Port JD, Anand IS, Fiuzat M, O’Connor CM, Abraham WT, Liggett SB, Bristow MR. Prevention of Atrial Fibrillation by Bucindolol Is Dependent on the Beta1389 Arg/Gly Adrenergic Receptor Polymorphism. JACC Heart Fail. 2013;1:338–344. doi: 10.1016/j.jchf.2013.04.002. [DOI] [PMC free article] [PubMed] [Google Scholar]
- 30.Ghali JK, Krause-Steinrauf HJ, Adams KF, Jr, Khan SS, Rosenberg YD, Yancy CW, Jr, Young JB, Goldman S, Peberdy MA, Lindenfeld J. Gender differences in advanced heart failure: insights from the BEST study. J Am Coll Cardiol. 2003;42:2128–2134. doi: 10.1016/j.jacc.2003.05.012. [DOI] [PubMed] [Google Scholar]
- 31.Bristow MR, Krause-Steinrauf H, Nuzzo R, Liang C-S, Lindenfeld J, Lowes BD, Hattler B, Abraham WT, Olson L, Krueger S, Thaneemit-Chen S, Hare JM, Loeb HS, Domanski MJ, Eichhorn EJ, Zelis R, Lavori P. Effect of baseline or changes in adrenergic activity on clinical outcomes in the beta-blocker evaluation of survival trial. Circulation. 2004;110:1437–1442. doi: 10.1161/01.CIR.0000141297.50027.A4. [DOI] [PubMed] [Google Scholar]
- 32.Dafni U. Landmark Analysis at the 25-Year Landmark Point. Circ Cardiovasc Qual Outcomes. 2011;4:363–371. doi: 10.1161/CIRCOUTCOMES.110.957951. [DOI] [PubMed] [Google Scholar]
- 33.Allison P. Survival Analysis Using SAS®: A Practical Guide, Second Edition [Internet] 2nd. SAS Institute; 2010. [cited 2016 Aug 8]. Available from: https://www.sas.com/store/books/categories/usage-and-reference/survival-analysis-using-sas-a-practical-guide-second-edition/prodBK_61339_en.html. [Google Scholar]
- 34.Frantz RP, Lowes BD, Grayburn PA, White M, Krause-Steinrauf H, Krishnan V, Uyeda L, Burnett JC BEST Neurohumoral Substudy Investigators. Baseline and serial neurohormones in patients with congestive heart failure treated with and without bucindolol: results of the neurohumoral substudy of the Beta-Blocker Evaluation of Survival Study (BEST) J Card Fail. 2007;13:437–444. doi: 10.1016/j.cardfail.2007.03.007. [DOI] [PubMed] [Google Scholar]
- 35.Davis ME, Richards AM, Nicholls MG, Yandle TG, Frampton CM, Troughton RW. Introduction of metoprolol increases plasma B-type cardiac natriuretic peptides in mild, stable heart failure. Circulation. 2006;113:977–985. doi: 10.1161/CIRCULATIONAHA.105.567727. [DOI] [PubMed] [Google Scholar]
- 36.Bristow MR, Abraham WT, Yoshikawa T, White M, Hattler BG, Crisman TS, Lowes BD, Robertson AD, Larrabee P, Gilbert EM. Second- and third-generation beta-blocking drugs in chronic heart failure. Cardiovasc Drugs Ther Spons Int Soc Cardiovasc Pharmacother. 1997;11(Suppl 1):291–296. doi: 10.1023/a:1007748131847. [DOI] [PubMed] [Google Scholar]
- 37.Patel MR, White RD, Abbara S, Bluemke DA, Herfkens RJ, Picard M, Shaw LJ, Silver M, Stillman AE, Udelson J. 2013 ACCF/ACR/ASE/ASNC/SCCT/SCMR Appropriate Utilization of Cardiovascular Imaging in Heart FailureA Joint Report of the American College of Radiology Appropriateness Criteria Committee and the American College of Cardiology Foundation Appropriate Use Criteria Task Force. J Am Coll Cardiol. 2013;61:2207–2231. doi: 10.1016/j.jacc.2013.02.005. [DOI] [PubMed] [Google Scholar]
- 38.Clarke CL, Grunwald GK, Allen LA, Barón AE, Peterson PN, Brand DW, Magid DJ, Masoudi FA. Natural history of left ventricular ejection fraction in patients with heart failure. Circ Cardiovasc Qual Outcomes. 2013;6:680–686. doi: 10.1161/CIRCOUTCOMES.111.000045. [DOI] [PMC free article] [PubMed] [Google Scholar]
- 39.van Royen N, Jaffe CC, Krumholz HM, Johnson KM, Lynch PJ, Natale D, Atkinson P, Deman P, Wackers FJ. Comparison and reproducibility of visual echocardiographic and quantitative radionuclide left ventricular ejection fractions. Am J Cardiol. 1996;77:843–850. doi: 10.1016/s0002-9149(97)89179-5. [DOI] [PubMed] [Google Scholar]
- 40.Kishi S, Reis JP, Venkatesh BA, Gidding SS, Armstrong AC, Jacobs DR, Sidney S, Wu CO, Cook NL, Lewis CE, Schreiner PJ, Isogawa A, Liu K, Lima JAC. Race-ethnic and sex differences in left ventricular structure and function: the Coronary Artery Risk Development in Young Adults (CARDIA) Study. J Am Heart Assoc. 2015;4:e001264. doi: 10.1161/JAHA.114.001264. [DOI] [PMC free article] [PubMed] [Google Scholar]
- 41.Natori S, Lai S, Finn JP, Gomes AS, Hundley WG, Jerosch-Herold M, Pearson G, Sinha S, Arai A, Lima JAC, Bluemke DA. Cardiovascular function in multi-ethnic study of atherosclerosis: normal values by, age, sex, and ethnicity. AJR Am J Roentgenol. 2006;186:S357–S365. doi: 10.2214/AJR.04.1868. [DOI] [PubMed] [Google Scholar]
- 42.Yancy CW, Abraham WT, Albert NM, Clare R, Stough WG, Gheorghiade M, Greenberg BH, O’Connor CM, She L, Sun JL, Young JB, Fonarow GC. Quality of care of and outcomes for African Americans hospitalized with heart failure: findings from the OPTIMIZE-HF (Organized Program to Initiate Lifesaving Treatment in Hospitalized Patients With Heart Failure) registry. J Am Coll Cardiol. 2008;51:1675–1684. doi: 10.1016/j.jacc.2008.01.028. [DOI] [PubMed] [Google Scholar]
- 43.Taylor MR, Sun AY, Davis G, Fiuzat M, Liggett SB, Bristow MR. Race, Common Genetic Variation, and Therapeutic Response Disparities in Heart Failure. JACC Heart Fail. 2014;2:561–572. doi: 10.1016/j.jchf.2014.06.010. [DOI] [PMC free article] [PubMed] [Google Scholar]
- 44.Shahgaldi K, Gudmundsson P, Manouras A, Brodin L-Å, Winter R. Visually estimated ejection fraction by two dimensional and triplane echocardiography is closely correlated with quantitative ejection fraction by real-time three dimensional echocardiography. Cardiovasc Ultrasound. 2009;7:41. doi: 10.1186/1476-7120-7-41. [DOI] [PMC free article] [PubMed] [Google Scholar]
Associated Data
This section collects any data citations, data availability statements, or supplementary materials included in this article.


