Abstract
Recent advances in microscopy imaging and genomics have created an explosion of patient data in the pathology domain. Whole-slide images (WSIs) of tissues can now capture disease processes as they unfold in high resolution, recording the visual cues that have been the basis of pathologic diagnosis for over a century. Each WSI contains billions of pixels and up to a million or more microanatomic objects whose appearances hold important prognostic information. Computational image analysis enables the mining of massive WSI datasets to extract quantitative morphologic features describing the visual qualities of patient tissues. When combined with genomic and clinical variables, this quantitative information provides scientists and clinicians with insights into disease biology and patient outcomes. To facilitate interaction with this rich resource, we have developed a web-based machine-learning framework that enables users to rapidly build classifiers using an intuitive active learning process that minimizes data labeling effort. In this paper we describe the architecture and design of this system, and demonstrate its effectiveness through quantification of glioma brain tumors.
Keywords: machine learning, interactive systems, biomedical image processing, pathology
I. Introduction
Pathology is a medical subspecialty that practices the diagnosis of disease. It is an area of medicine that is rich with data – from comprehensive molecular characterizations of tissues obtained by genomic and sequencing analysis, to high-resolution images of tissues obtained through various forms of microscopy imaging or histology. Pathologists use these data resources in various scenarios to render diagnosis, and often to assess prognosis and stratify patients into risk groups associated with expected outcomes. Microscopic evaluation of tissues is a time-honored practice in pathology, dating back more than a century [1]. The visual properties of tissues carry important information on disease-related processes – like the formation of blood vessels, or immune system response. In cancers, the shapes and types of cells present carry important diagnostic and prognostic information that are used to classify the tumor and assess how advanced a patient’s disease is. Manual evaluation of tissue histology by trained professionals is highly subjective, being prone to both considerable intra-observer and inter-observer variations [2]. The development of more objective quantitative metrics for evaluating pathology images remains a significant barrier in effectively using this resource in research and clinical care.
Recent advances in microscopy imaging now enable the digitization of massive volumes of histology data. Slide scanning microscopes can produce whole slide images (WSIs) that capture the entire histological detail of a tissue specimen in a single high-magnification image pyramid. These images contain billions of pixels each, with image dimensions in the tens-of-thousands of pixels. A single WSI can be digitized in around 2.5 minutes, and a single slide-scanning device can easily produce a terabyte of image data in a single day. These devices are increasingly being adopted in both clinical and research settings, resulting in an explosion of histology image data.
The creation of vast collections of WSIs creates an opportunity to extract information from this content using image analysis algorithms. By segmenting the microanatomy in these images and representing each discrete object with a set of quantitative features, these algorithms can produce objective and repeatable descriptions of the visual properties of patient tissues. When combined with genomic and clinical data, these representations can be used to improve accuracy of diagnosis and prognosis, and to reveal new insights into disease biology. Public repositories such as The Cancer Genome Atlas (TCGA) provide archives of WSIs, genomic and clinical data for more than 10,000 human subjects, spanning more than 20 selected types of cancers. Each WSI can contain hundreds of thousands to more than one million cells – resulting in hundreds of millions of cells for just a single cancer type.
The visualization, management and analysis of this data bring new challenges for human-computer interaction, big data management and machine-learning. For example, one of the most common applications is to apply learning algorithms to develop classification rules for phenotypes of interest, with the goal of quantifying the abundance of a specific type of cell for each patient in a cohort. Building systems that provide analysis capabilities to end-users (pathologists and biologically-oriented researchers) remains a significant barrier the utilization of quantitative histologic features.
In this paper we present a software system developed to facilitate the application of machine-learning algorithms to classify histologic entities in datasets containing hundreds of millions of discrete objects. This system is browser-based, requiring only an Internet browser to access, and enables the visualization and interaction with image analysis features. The backbone of this system is a machine learning framework that enables users to rapidly build phenotype classifiers from massive datasets through an intuitive process called active learning that improves classifier performance while reducing data labeling efforts. This system makes the following contributions:
Scalable browser-based visualization algorithm-derived annotations for WSIs with a million or more discrete objects.
An active learning strategy for intelligent sampling of samples to reduce training effort and batch effects.
Heatmap-based visualization of classifier metrics as feedback of classifier accuracy and to guide labeling efforts.
In the sections that follow we discuss the design and architecture of this system and demonstrate its utility using data from TCGA to quantify angiogenesis in glioma brain tumors in an analysis of over 100 million cells.
A. Related Work
A number of related works have addressed problems related to the analysis and management of data in the digital pathology domain. A data model and spatial database for scalable management of pathology image data was presented in [3]. Several comprehensive reviews of image analysis of WSIs are available [1, 4, 5].
Integrated systems for the visualization, management and analysis of digital pathology data are not common. The FARSIGHT toolkit is a comprehensive software platform for managing and analyzing microscopy images [6, 7]. It provides extensive functionality for the segmentation and classification of microscopy image data, including some active learning capabilities, but is intended for traditional microscopy modalities with limited fields and does not scale to support WSI images. The Bio-Image Semantic Query User Environment (BisQue) is a cloud-based system for the management, visualization and analysis of bioimages. It provides support for whole-slide image formats through OpenSlide and its database can scale to large numbers of annotations, but does not provide fluid visualization when the number of objects/annotations scales to millions per image [8]. The Open Microscopy Environment (OME) is a solution for the storage and analysis of large-scale microscopy data, but has traditionally focused on images generated by traditional microscopy with limited fields of view, with limited WSI functionality added only recently [9]. None of these systems provides the functionality needed for scalable interactive learning on large WSI datasets.
Perhaps the most common analysis task in histology datasets is the classification of cells and other microanatomic entities [10, 11]. Information about disease processes and patient prognosis are often encoded in the types of cells present in a sample and how their shapes vary. The traditional approach to developing machine learning classifiers in any application is through the passive learning [12]. In passive learning, a domain expert first creates a training set of labeled examples containing both positive and negative examples for the phenotype of interest, and the features and labels of this training set are used to develop a classification rule. The trained classifier is then applied to a test set of examples independent of the training set to estimate the generalization error on the problem domain and predict how it will perform on future unseen data. In passive learning, training is a one-time event with no interaction or feedback between the classifier and domain expert.
One issue with passive learning approaches in “big” datasets is selection bias [13]. With an abundance of data, the domain expert will tend to select “text book” training examples that unambiguously represent each class, and can avoid ambiguous examples entirely. This leaves large swaths of the feature space unexplored and does not adequately constrain the classifier, potentially increasing generalization error. Active learning, which involves the strategic selection of training data by an objective algorithm, has been shown to overcome this problem in general machine-learning problems [14–16]. In the active learning paradigm, a sampling strategy is used to select training examples for the expert to label, using a criterion that predicts which examples are most likely to improve classifier performance. This process is iterative, with the expert labeling a small set of objectively selected examples in each round. The classifier is updated with each new round of feedback and then all samples are re-evaluated for their potential to improve the newly updated classifier. Active learning has been shown to achieve a much better generalization performance with fewer labeled examples required [14–16].
Active learning has not been widely employed in biomedical imaging applications due to the complex software infrastructure needed to facilitate visualization and interaction with possibly terabytes of image data, and to collect and manage user feedback. CARTA is an active learning framework aimed at bioimage classification. The main focus of this framework is the ease of interactive annotation [17]. It makes use of self-organizing maps to cluster similar images together for display. Based on the distance from a labeled image, other images can be automatically labeled thereby reducing the amount of effort needed. In [18] , the focus is on improving classification accuracy by using a class balanced active learning strategy. This work involves WSIs but is focused on classification of fields of view with a focus on balancing performance for under-represented target classes. A system for scoring high-content screening image datasets was presented in [19] where the user is queried to correct classification errors, but without active learning metrics used to pr redict impact on classifier performance or to minimize labeling effort.
The infrastructure needed to effectively train and apply machine-learning algorithms on large WSI datasets has been largely overlooked outside of the commercial domain. For active learning and other interactive approaches, the scale and complexity of WSI data requires that significant attention be paid to a variety of considerations including user interface, data management and high performance computing. This motivated us to develop a comprehensive system that could enable end users to effectively build machine-learning classifiers from large WSI datasets using active learning.
II. A Web-Based System for Interactive Classification of Whole-Slide Pathology Data
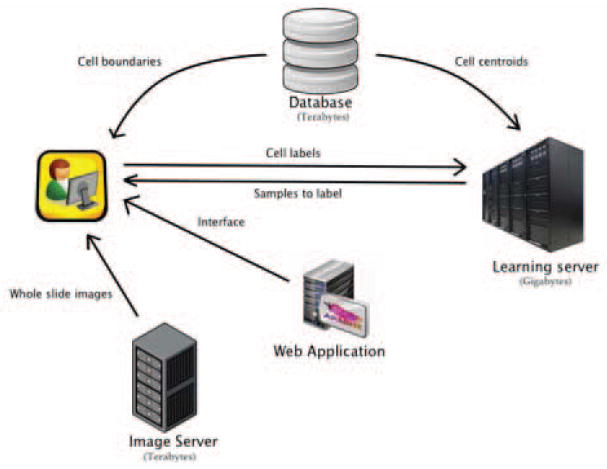
We have created a web-based system for active learning classification on pathology WSI datasets. The system has four major components: 1. The learning server - updates the classifier, selects new samples to be labeled by the user and generates heat maps. 2. The image server - Provides whole slide image pyramids that allow the user to zoom and pan through the whole slide images. 3. Database - Contains the centroids and boundaries of all the segmented cells 4. Web application - User interface to the system. The system architecture is presented in Figure 1. In this section we review the design and implementation of each of these components and their role in creating a functioning WSI active learning system.
Figure 1.
A web-based system for interactive classification of WSI datasets. All components are coordinated by a browser-based user interface and web application. A WSI image server provides image content to the interface to facilitate visualization of results. The database enhances visualization by serving the boundaries of image analysis objects for overlay onto WSI content. The machine-learning server implements the active learning sampling strategy and performs scalable and timely classification.
The interactive nature of our system implies an expected responsiveness - while a hard real-time response is not required, delays measured in more than several seconds will diminish the user experience. As we strove to avoid delays in the system as a whole, there were two areas of particular concern: 1. Scalable visualization of whole-slide images and annotations and 2. Implementing a responsive sampling strategy when possibly hundreds-of-millions of samples are available.
A. Image Analysis Features and Segmentation Boundaries
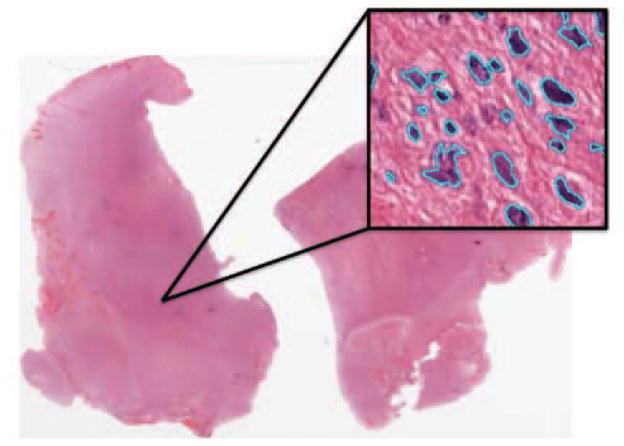
Our system accepts as input a set of WSI images, in any of the vendor formats supported by the OpenSlide library, and a collection of image analysis object boundaries and features in simple text and HD5 formats. The boundaries and features are application specific, and can be generated by any number of algorithms depending on the analysis goals. An example of the data we used in this study is shown in Figure 2 and described in detail in [20]. In short, we segmented cell nuclei and calculated a set of 48 descriptive features describing the nucleus of each individual cell.
Figure 2.
Image analysis algorithms can be applied to delineate and characterize microanatomic objects in WSI images. Each WSI contains billions of pixels and up to a million or more discrete objects. Here, delineated cell nuclei (light blue) from brain tumor tissue are depicted. The test data used for our system characterizes each cell nucleus with a set of 48 features describing their shape, size and texture.
B. Scalable Visualization
Building object classifiers requires that the user be able to visualize and interact with raw WSI data and the objects annotated by image analysis. A single WSI can contain over 108,000 by 86,000 pixels at maximum magnification, and contain a million or more discrete object annotations. Display of this type of content requires a multi scale approach as used in Google satellite maps – users must be able to pan and zoom seamlessly and without delay through pyramidal representations of each slide that can contain well over 10GB of raw pixel data. In addition to the WSI content, each WSI contains up to a million or more objects that must be rendered seamlessly. These annotations not only inform the user about the boundaries and location of each object, their colors can be used to encode dynamic metadata - like object class or membership in the training dataset - that changes as the classifier is updated as the user provides labels for training examples. It is possible that tens of thousands of annotations are to be displayed at once while maintaining the ability to pan smoothly through the image.
For visualization of image data, we used the Cancer Digital Slide Archive (cancer.digitalslidearchive.net) for the visualization of whole-slide images [21]. This system uses OpenSeadragon, a Javascript based open-sourced solution for zoomable pyramid viewing, and OpenSlide, a library to support access to pyramids in proprietary WSI file formats [22]. This provides a basic viewer window which can be sized on any webpage and that enables users to zoom and pan through a WSI at any resolution.
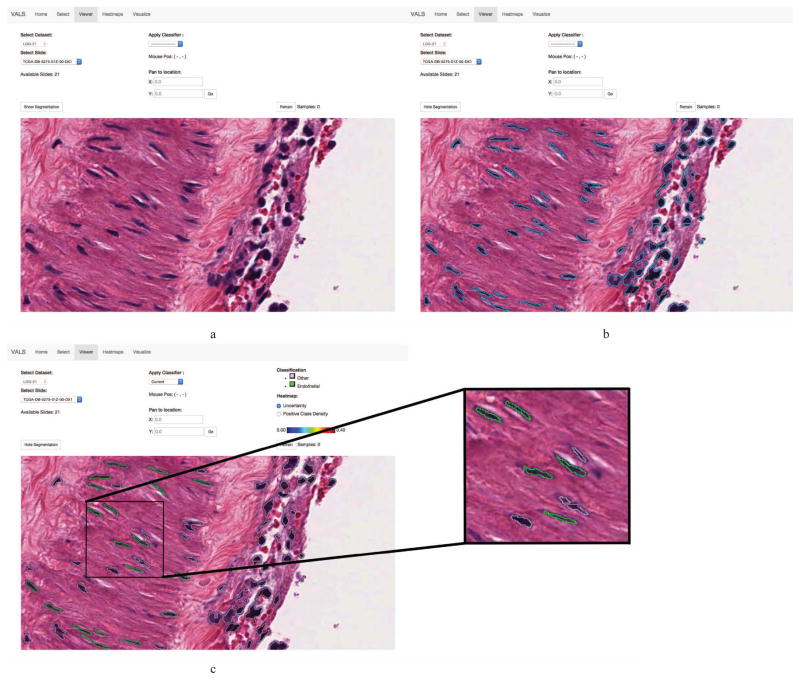
The scalable display of 1+ million annotations has not been implemented previously in any published WSI viewer. We achieved this using a vector graphics (SVG) format combined with spatial caching as illustrated in Figure 3. A dynamic SVG of object boundaries is generated for the view currently displayed in the viewport, as well as the immediately surrounding areas that are not visible. This SVG is populated on the fly with (x,y) boundary coordinates from the database, and color coded to represent each object’s class and inclusion in the training dataset. The most common action in viewing WSIs is a panning event, and so caching objects in the adjacent views that are not yet visible enables smooth rendering of object boundaries as the user pans. Objects that move outside of this cache window are deleted, and the objects are also not displayed at low magnifications where they are not discernable. At this point the system will switch to a heatmap view that is described below to represent the concentration of objects of a given class. Figure 4 shows the slide viewer in various states.
Figure 3.
Spatial caching enables the scalable display of annotations with up to a million or more objects per slide. A database holds the (x,y) coordinates of object boundaries (cell nuclei in this case). A dynamic SVG is created to render the objects within the current viewport, as well as objects in regions adjacent to the viewport (spatial locality). This provides smooth rendering in the event that the user pans to an adjacent region. Object boundaries are color-coded to represent dynamic metadata like the object’s class and membership in the training dataset.
Figure 4.
The browser-based slide viewer used in our active learning system. From left to right, top to bottom: (a) The browser viewport enables the user to select a WSI and to pan and zoom to any region in that image. (b) Object boundaries identified by image analysis algorithms can be displayed. (c) These boundaries are color-coded based on dynamic metadata for each object like predicted class or membership in the training dataset. Here the green boundaries encode cells that are classified as endothelial cells.
C. Responsive Selection Strategy for Training Examples
The interactive nature of active learning imposes computational demands on machine learning algorithms. With the user providing iterative feedback, the sampling strategy must scan through a large number of examples to select the next examples for labeling. A typical dataset for cell nuclei can contain from tens to hundreds of million objects that need to be classified and evaluated by the sampling strategy at each iteration, placing constraints on the choice of classifier and sampling strategy to provide responsiveness.
Our system employs uncertainty sampling as an active learning strategy. The idea is that most classifiers produce not only a class label, but also a measure of certainty when performing classification – by selecting examples that appear ambiguous to the classifier, we can explore uncharted regions of the feature space and improve classifier performance. For histologic datasets, there is a spectrum ranging from the positive to the negative class with those examples lying near the class boundary sometimes very difficult or impossible to differentiate.
We implemented uncertainty sampling using a Random Forest classifier, chosen for their speed and resistance to overfitting. The random forest is a collection of individual tree classifiers that each vote on the label of the sample. In this case, classifier uncertainty is measured as the consistency of votes, with a vote of 50/50 being ambiguous. To calculate the uncertainty score for each sample Ui, the positive class probability from the votes was normalized to be centered at 0 and have a range of −1 to 1. We then adjusted the uncertainty score to reflect the number of samples from each slide in the training dataset:
| (1) |
where N is the training set size, and Ns is the number of examples from image s in the training set. This adjustment is made to balance the training set and to mitigate batch effects by encouraging even representation from each image in the training dataset. For our implementation, we used the random forest implementation from the OpenCV library that is highly parallel and that supports multithreading.
III. User Experience and Workflow
The web application provides a primary interface for the user to access all the functions of our system. From here the user can build a classifier, view WSIs or download data such as a training set or the results of a classifier being applied to a specific WSI or dataset. The viewport allows the user to zoom and pan through a whole slide image from any of the datasets, to display the boundaries of objects identified by image analysis, and to view classification results for these objects. When a learning session is active, the classifier is built from the current training set. When there is no training set, the user can choose to load a classifier built in a previous session.
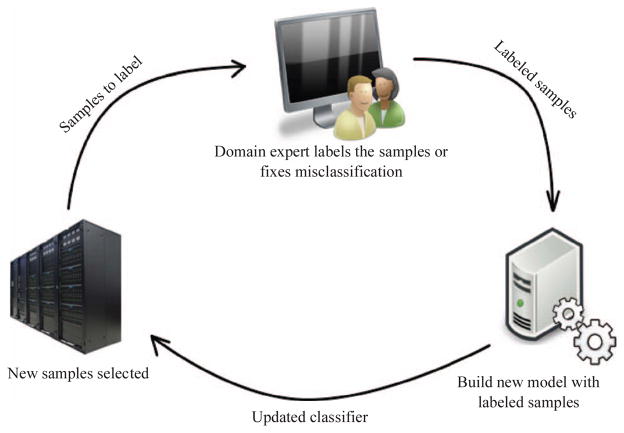
The user initiates an active learning session by selecting the dataset to use and naming the classifier, positive and negative classes. In this first iteration the entire dataset is unlabeled. The first step prompts the user to “prime” the training set by selecting four examples from each class. The process that follows progressively builds the training set by selecting examples for labeling and acquiring feedback from the user (see Figure 5). At each iteration the classifier is updated, eight new examples are selected by the sampling strategy, and the interface automatically directs the user to these examples to visually review them and provide labels so that they can be added to the training set. This continues until the user is satisfied with the accuracy of the classifier, at which point the results can be saved, exported or applied to another dataset.
Figure 5.
The active learning process. An objective sampling strategy scans the unlabeled samples to identify those that will improve the classifier the most. The user labels a small set of the samples, the classifier is updated, and the cycle begins again.
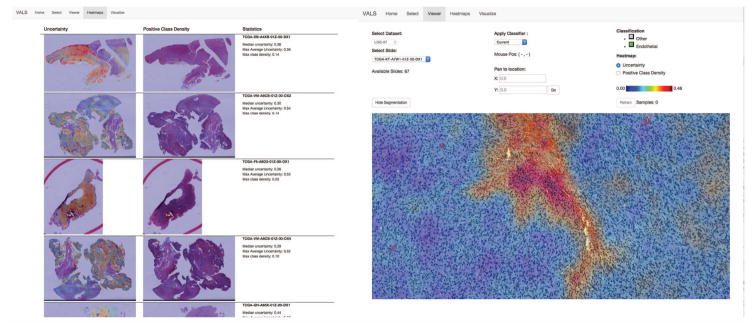
To better facilitate browsing of classification results, a heatmap view is available to visualize metrics of the updated classifier as a heatmap overlay in the viewport (see Figure 6). As the classifier learns and evolves, the distribution of object certainty scores Ui tends to skew more and more towards certainty. To help the user navigate the classification results, we rank the WSIs by their median classification uncertainty, placing at the top those slide images containing cells that are more likely to be misclassified. An uncertainty heatmap and a positive class heatmap is generated for each WSI to display the spatial distribution of class labels and classifier uncertainty in each WSI. The user can select WSIs from this list and use these heatmaps to rapidly zoom in on regions where the classifier is less confident in its decisions. Misclassified cells encountered in this viewing process can also be added to the training set separate from the sampling strategy.
Figure 6.
Heatmap view of classifier uncertainty to aid user review. WSIs are ranked in terms of median uncertainty and presented to the user as a sorted list (left). A heatmap of the classifier uncertainty is available for each slide as an overview layer in the slide viewport (right). This helps the user rapidly navigate to regions where the classifier is uncertain of its decisions in order to assess the accuracy of the current classifier.
IV. Results - Classifying Angiogenesis in Brain Tumors
To evaluate our system, we focused on classifying endothelial cells in glioma brain tumors. Endothelial cells create a thin layer of cells that make up the lining of blood vessels. The development of blood vessels or “angiogenesis” in brain tumors is a signal of disease progression and a negative prognostic indicator. Additionally, many new cancer therapies like Avastin aim to target blood vessels as a mechanism of containing tumor growth.
We deployed our system on a high performance server with dual 12 core 2.5GHz Intel Xeon processors (48 threads total), 128 GB of main memory, 1.2 TB of solid-state storage and 13TB of raid storage. All experiments were run with this configuration.
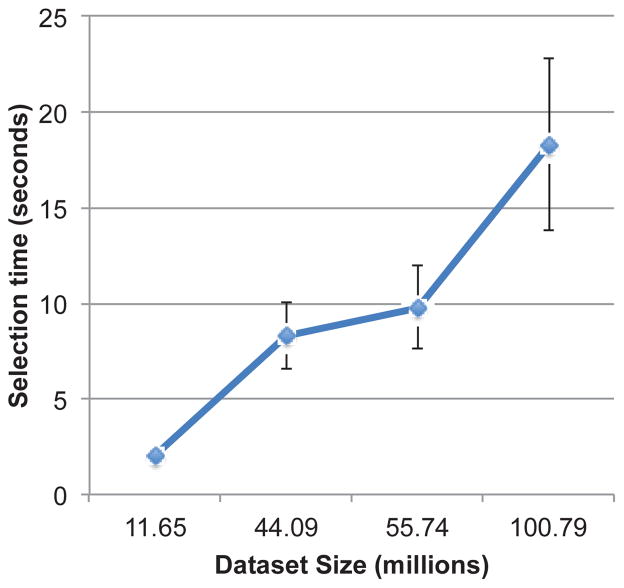
To test scalability of the sampling strategy we measured the elapsed runtime of the sample selection with datasets ranging from 11 million to 100 million cell nuclei objects. Timings were averaged over 10 total experiments for each condition. Figure 7 shows the timing results for the sample selection strategy. The time increases nearly linearly with the number of objects in the dataset as expected, with a maximum delay of 18.2 seconds for the 100 million cell dataset.
Figure 7.
Execution time of sampling strategy for various dataset sizes. Times shown were averaged over 10 sampling iterations.
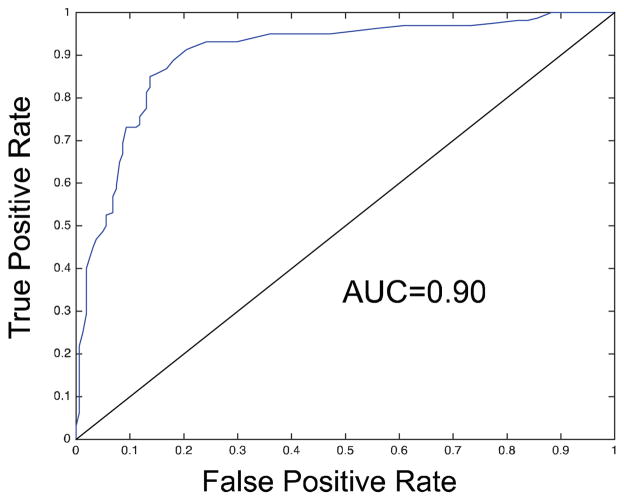
To test the classification accuracy of our system, we created an independent test dataset of 160 endothelial and 161 non-endothelial cells. A classifier was trained over 18 sampling iterations, labeling 169 samples total, 46 samples added by fixing (5 were ignored as incorrectly segmented). The ROC curve for this classifier and test set are shown in Figure 8. The classifier achieves an area-under-curve of 0.902.
Figure 8.
The classifier trained by our framework achieved an AUC of 0.9 when tested against 321 independent examples.
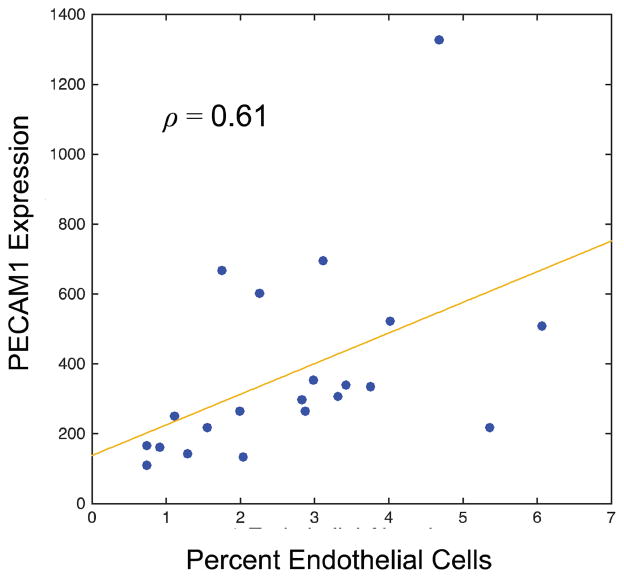
To generate further evidence of the effectiveness of this classifier, we used the genomic data from TCGA to explore the correlations between the abundance of endothelial cells in each sample, and the expression of endothelial specific molecular markers in these samples. PECAM1 is the platelet endothelial cell adhesion molecule that is highly specific to endothelial cells. We used the available mRNA expression data from 21 samples corresponding to slides in our system, and correlated PECAM-1 expression in these samples with the proportion of endothelial cells in each WSI. The correlation between a patient’s PECAM-1 and endothelial cell abundance in these samples was 0.61 (see Figure 9).
Figure 9.
Genomic data was used to validate classifier accuracy. Here we correlated the mRNA expression of an endothelial specific marker (PECAM1) with the abundance of endothelial cells in 21 slides consisting of over 11 million cells.
A. Conclusion and Future Work
Whole-slide imaging combined with image analysis provides a quantitative means to gain insights into the disease processes that unfold in tissues at the microscopic scale. While many gains have been made recently in developing scanning hardware and image analysis algorithms, the infrastructure needed to enable clinicians and researchers to extract meaningful information from this rich data resource has been relatively under-developed.
This paper demonstrates a system that enables end-users to efficiently build accurate classifiers of microanatomy in whole-slide pathology image datasets that contain many millions of examples. We show that given a suitable infrastructure that addresses user interface, data management and machine learning considerations, it is possible to train an accurate classifier with reasonable user effort. Employing active learning to guide classifier development was effective in creating an accurate classifier with a very small number of training examples. Accuracy was validated with both hand a hand labeled dataset, and by independent means using genomic data associated with the tissue images.
Further scaling of the active learning framework requires additional hardware resources and better algorithmic approaches. For the 48 threads available on the test system, a dataset of 100 million samples takes an average of 18 seconds per iteration. While this is not unreasonable for end users, times of 1 minute or more may limit the utility of such a system in practice. The development of sampling strategies that can effectively identify labeling candidates without exhaustively scanning the unlabeled examples is desirable. Such a strategy could leverage the statistics and modality of the dataset via pre-clustering to avoid exhaustive evaluation. In our future research we plan to investigate these ideas, and extend the implementation of this system to address multiclass classification problems.
Acknowledgments
This work was funded by the National Institutes of Health, National Library of Medicine Career Development Award in Biomedical Informatics (K22LM011576), National Cancer Institute Informatics Technology for Cancer Research Program (U24CA194362) and National Cancer Institute Career Development Award (K25CA181503).
References
- 1.Cooper LA, Carter AB, Farris AB, Wang F, Kong J, Gutman DA, et al. Digital Pathology: Data-Intensive Frontier in Medical Imaging: Health-information sharing, specifically of digital pathology, is the subject of this paper which discusses how sharing the rich images in pathology can stretch the capabilities of all otherwise well-practiced disciplines. Proc IEEE Inst Electr Electron Eng. 2012 Apr;100:991–1003. doi: 10.1109/JPROC.2011.2182074. [DOI] [PMC free article] [PubMed] [Google Scholar]
- 2.Schuh F, Biazus JV, Resetkova E, Benfica CZ, de Ventura FA, Uchoa D, et al. Histopathological grading of breast ductal carcinoma In Situ: validation of a web-based survey through intra-observer reproducibility analysis. Diagn Pathol. 2015;10:93. doi: 10.1186/s13000-015-0320-2. [DOI] [PMC free article] [PubMed] [Google Scholar]
- 3.Wang F, Kong J, Gao J, Cooper LA, Kurc T, Zhou Z, et al. A high-performance spatial database based approach for pathology imaging algorithm evaluation. J Pathol Inform. 2013;4:5. doi: 10.4103/2153-3539.108543. [DOI] [PMC free article] [PubMed] [Google Scholar]
- 4.Gurcan MN, Boucheron LE, Can A, Madabhushi A, Rajpoot NM, Yener B. Histopathological image analysis: a review. IEEE Rev Biomed Eng. 2009;2:147–71. doi: 10.1109/RBME.2009.2034865. [DOI] [PMC free article] [PubMed] [Google Scholar]
- 5.Kothari S, Phan JH, Stokes TH, Wang MD. Pathology imaging informatics for quantitative analysis of whole-slide images. J Am Med Inform Assoc. 2013 Nov-Dec;20:1099–108. doi: 10.1136/amiajnl-2012-001540. [DOI] [PMC free article] [PubMed] [Google Scholar]
- 6.Luisi J, Narayanaswamy A, Galbreath Z, Roysam B. The FARSIGHT trace editor: an open source tool for 3-D inspection and efficient pattern analysis aided editing of automated neuronal reconstructions. Neuroinformatics. 2011 Sep;9:305–15. doi: 10.1007/s12021-011-9115-0. [DOI] [PubMed] [Google Scholar]
- 7.Padmanabhan RK, Somasundar VH, Griffith SD, Zhu J, Samoyedny D, Tan KS, et al. An active learning approach for rapid characterization of endothelial cells in human tumors. PLoS One. 2014;9:e90495. doi: 10.1371/journal.pone.0090495. [DOI] [PMC free article] [PubMed] [Google Scholar]
- 8.Kvilekval K, Fedorov D, Obara B, Singh A, Manjunath BS. Bisque: a platform for bioimage analysis and management. Bioinformatics. 2010 Feb 15;26:544–52. doi: 10.1093/bioinformatics/btp699. [DOI] [PubMed] [Google Scholar]
- 9.Goldberg IG, Allan C, Burel JM, Creager D, Falconi A, Hochheiser H, et al. The Open Microscopy Environment (OME) Data Model and XML file: open tools for informatics and quantitative analysis in biological imaging. Genome Biol. 2005;6:R47. doi: 10.1186/gb-2005-6-5-r47. [DOI] [PMC free article] [PubMed] [Google Scholar]
- 10.Malon CD, Cosatto E. Classification of mitotic figures with convolutional neural networks and seeded blob features. J Pathol Inform. 2013;4:9. doi: 10.4103/2153-3539.112694. [DOI] [PMC free article] [PubMed] [Google Scholar]
- 11.Sommer C, Gerlich DW. Machine learning in cell biology - teaching computers to recognize phenotypes. J Cell Sci. 2013 Dec 15;126:5529–39. doi: 10.1242/jcs.123604. [DOI] [PubMed] [Google Scholar]
- 12.Raginsky M, Rakhlin A. Lower Bounds for Passive and Active Learning. NIPS. 2011:1026–1034. [Google Scholar]
- 13.Kubat M, Matwin S. Addressing the curse of imbalanced training sets: one-sided selection. Proc. 14th International Conference on Machine Learning; 1997; pp. 179–186. [Google Scholar]
- 14.Cohn D, Atlas L, Ladner R. Improving Generalization with active learning. Machine Learning. 1994;15:201–221. [Google Scholar]
- 15.Joshi AJ, Porikli F, Papanikolopoulos N. Multi-class active learning for image classification. CVPR. 2009:2372–2379. doi: 10.1109/TPAMI.2012.21. [DOI] [PubMed] [Google Scholar]
- 16.Settles B. Active Learning Literature Survey. University of Wisconsin-Madison; 2009. [Google Scholar]
- 17.Kutsuna N, Higaki T, Matsunaga S, Otsuki T, Yamaguchi M, Fujii H, et al. Active learning framework with iterative clustering for bioimage classification. Nat Commun. 2012;3:1032. doi: 10.1038/ncomms2030. [DOI] [PMC free article] [PubMed] [Google Scholar]
- 18.Doyle S, Monaco J, Feldman M, Tomaszewski J, Madabhushi A. An active learning based classification strategy for the minority class problem: application to histopathology annotation. BMC Bioinformatics. 2011;12:424. doi: 10.1186/1471-2105-12-424. [DOI] [PMC free article] [PubMed] [Google Scholar]
- 19.Jones TR, Carpenter AE, Lamprecht MR, Moffat J, Silver SJ, Grenier JK, et al. Scoring diverse cellular morphologies in image-based screens with iterative feedback and machine learning. Proc Natl Acad Sci U S A. 2009 Feb 10;106:1826–31. doi: 10.1073/pnas.0808843106. [DOI] [PMC free article] [PubMed] [Google Scholar]
- 20.Cooper LA, Kong J, Gutman DA, Dunn WD, Nalisnik M, Brat DJ. Novel genotype-phenotype associations in human cancers enabled by advanced molecular platforms and computational analysis of whole slide images. Lab Invest. 2015 Apr;95:366–76. doi: 10.1038/labinvest.2014.153. [DOI] [PMC free article] [PubMed] [Google Scholar]
- 21.Gutman DA, Cobb J, Somanna D, Park Y, Wang F, Kurc T, et al. Cancer Digital Slide Archive: an informatics resource to support integrated in silico analysis of TCGA pathology data. J Am Med Inform Assoc. 2013 Nov-Dec;20:1091–8. doi: 10.1136/amiajnl-2012-001469. [DOI] [PMC free article] [PubMed] [Google Scholar]
- 22.Goode A, Gilbert B, Harkes J, Jukic D, Satyanarayanan M. OpenSlide: A vendor-neutral software foundation for digital pathology. J Pathol Inform. 2013;4:27. doi: 10.4103/2153-3539.119005. [DOI] [PMC free article] [PubMed] [Google Scholar]


