Fig 11 is incorrect. The authors have provided a corrected version here.
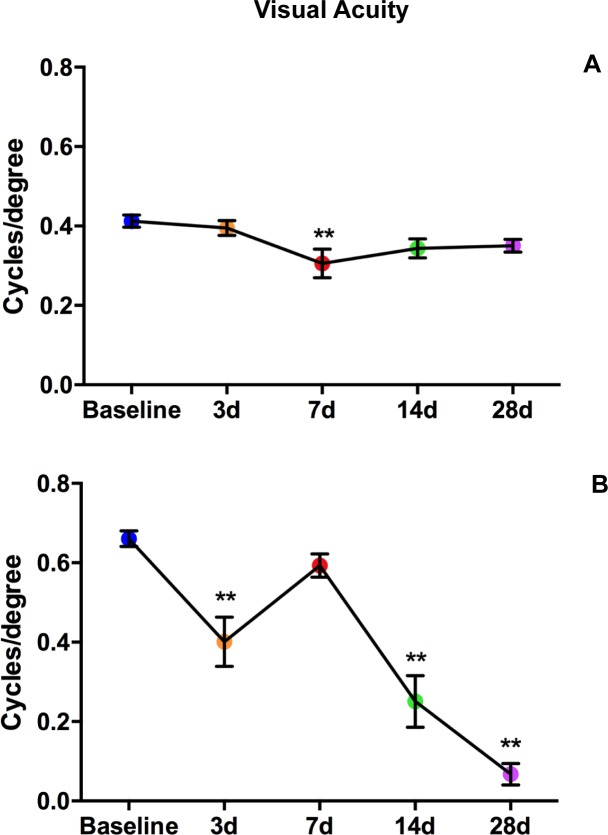
Fig 11. Visual acuity declines after blast in both strains.
Graphs of OKN responses in Bl/6 (A) and D2 (B). The average cycles/degree ± SEM are plotted over time. *p<0.05, **p<0.01.
Reference
- 1.Bricker-Anthony C, Rex TS (2015) Neurodegeneration and Vision Loss after Mild Blunt Trauma in the C57Bl/6 and DBA/2J Mouse. PLoS ONE 10(7): e0131921 doi:10.1371/journal.pone.0131921 [DOI] [PMC free article] [PubMed] [Google Scholar]


