
FIGURE 1.
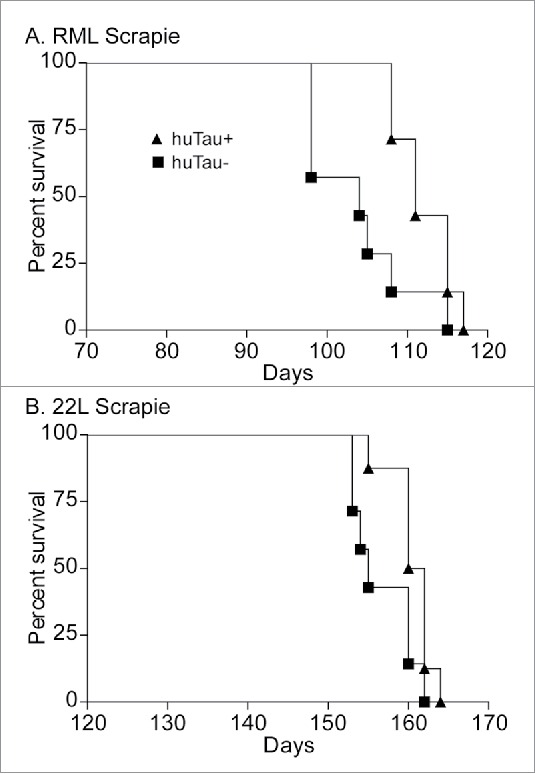
Survival curve analysis of scrapie-infected huTau− (solid squares) and huTau+ (solid triangles) mice. (A) RML scrapie-infected mice. Log-rank (Mantel-Cox) analysis of the curves gave a P value = 0.0242. (B) 22L scrapie-infected mice. Log-rank analysis of the curves gave a P value = 0.0457. N = 8 for all groups.