

Abstract
To determine whether L-type voltage-operated Ca2+ channels (L-VOCCs) are required for oligodendrocyte progenitor cell (OPC) development, we generated an inducible conditional knock-out mouse in which the L-VOCC isoform Cav1.2 was postnatally deleted in NG2-positive OPCs. A significant hypomyelination was found in the brains of the Cav1.2 conditional knock-out (Cav1.2KO) mice specifically when the Cav1.2 deletion was induced in OPCs during the first 2 postnatal weeks. A decrease in myelin proteins expression was visible in several brain structures, including the corpus callosum, cortex, and striatum, and the corpus callosum of Cav1.2KO animals showed an important decrease in the percentage of myelinated axons and a substantial increase in the mean g-ratio of myelinated axons. The reduced myelination was accompanied by an important decline in the number of myelinating oligodendrocytes and in the rate of OPC proliferation. Furthermore, using a triple transgenic mouse in which all of the Cav1.2KO OPCs were tracked by a Cre reporter, we found that Cav1.2KO OPCs produce less mature oligodendrocytes than control cells. Finally, live-cell imaging in early postnatal brain slices revealed that the migration and proliferation of subventricular zone OPCs is decreased in the Cav1.2KO mice. These results indicate that the L-VOCC isoform Cav1.2 modulates oligodendrocyte development and suggest that Ca2+ influx mediated by L-VOCCs in OPCs is necessary for normal myelination.
SIGNIFICANCE STATEMENT Overall, it is clear that cells in the oligodendrocyte lineage exhibit remarkable plasticity with regard to the expression of Ca2+ channels and that perturbation of Ca2+ homeostasis likely plays an important role in the pathogenesis underlying demyelinating diseases. To determine whether voltage-gated Ca2+ entry is involved in oligodendrocyte maturation and myelination, we used a conditional knock-out mouse for voltage-operated Ca2+ channels in oligodendrocyte progenitor cells. Our results indicate that voltage-operated Ca2+ channels can modulate oligodendrocyte development in the postnatal brain and suggest that voltage-gated Ca2+ influx in oligodendroglial cells is critical for normal myelination. These findings could lead to novel approaches to intervene in neurodegenerative diseases in which myelin is lost or damaged.
Keywords: calcium, Cav1.2, myelination, oligodendrocytes, voltage-operated Ca2+ channels
Introduction
Voltage-operated Ca2+ channels (VOCCs) have been found in oligodendrocyte progenitor cells (OPCs) from different brain tissues. For instance, perinatal OPCs from the mouse cortex (Verkhratsky et al., 1990; von Blankenfeld et al., 1992) and OPCs obtained from the adult optic nerve (Borges et al., 1995) exhibit voltage-activated Ca2+ currents and electrophysiological recordings from early postnatal slices revealed the presence of Ca2+ currents in OPCs located in white matter regions (Berger et al., 1992, Larson et al., 2016). Similarly, we have identified high- and low-voltage activated Ca2+ currents in corpus callosum OPCs and the currents were found to possess the pharmacological and voltage-dependent properties of L-type and T-type VOCCs, respectively (Paez et al., 2007; Paez et al., 2009a; Fulton et al., 2010). Moreover, several studies have shown that Ca2+ responses through L-type channels appear to diminish with maturation of oligodendrocytes from progenitors to mature cells (Fulton et al., 2010; Paez et al., 2010; Larson et al., 2016). For example, L-type Ca2+ currents were significantly greater in OPCs from the subventricular zone compared with more mature oligodendrocytes found in the corpus callosum (Fulton et al., 2010; Paez et al., 2010). Further, high expression of L-type Ca2+ channel subunits in OPCs and downregulation of L-VOCCs in newly formed and myelinating oligodendrocytes were found recently in a RNA-sequencing transcriptome study of cortical glial cells (Zhang et al., 2014).
L-VOCCs require a strong depolarization of the plasma membrane for activation and remain active for long periods of time (Hell et al., 1993; Ertel et al., 2000). These channels are concentrated in clusters all over the cell body and Ca2+ influx through L-type Ca2+ channels into the soma modulates gene transcription (Rajadhyaksha et al., 1999; Platzer et al., 2000). Of the 10 voltage-gated Ca2+ channels, four are responsible for mediating the L-type Ca2+ currents: Cav1.1 (α1S), Cav1.2 (α1C), Cav1.3 (α1D), and Cav1.4 (α1F); Cav1.2 and Cav1.3 are expressed in the brain (Hell et al., 1993) and we have found that both L-type α1 subunits are expressed in OPCs (Cheli et al., 2015). Cav1.2 has been of major interest because >90% of the Ca2+ influx after plasma membrane depolarization in OPCs is mediated by this particular L-VOCC α1 subunit (Cheli et al., 2015).
We have shown that L-VOCCs regulate process extension and migration in OPCs (Paez et al., 2007, 2009a, 2009b; 2010) and we have provided direct evidence that selective deletion of L-type Ca2+ channels in OPCs prevents oligodendrocyte development in vitro (Cheli et al., 2015). In this work, we tested the hypothesis that L-type voltage-gated Ca2+ entry is crucial for OPC maturation and, as a consequence, for the myelination of the postnatal mouse brain. We used the Cre-lox system to delete the L-type channel isoform Cav1.2 specifically in NG2-positive OPCs. Our results indicate that L-VOCC expression can modulate OPC migration and proliferation in the postnatal brain and suggest that Ca2+ influx mediated by L-VOCC in OPCs is critical for normal oligodendrocyte development. These findings could lead to novel approaches to intervene in neurodegenerative diseases in which myelin is lost or damaged.
Materials and Methods
Transgenic mice.
All animals used in the present study were housed in the University of Buffalo (UB) Division of Laboratory Animal Medicine vivarium and procedures were approved by UB's Animal Care and Use Committee and conducted in accordance with the Guide for the Care and Use of Laboratory Animals from the National Institutes of Health. The heterozygous floxed Cav1.2 mice were obtained from Dr. Murphy Geoffrey (University of Michigan, Ann Arbor; White et al., 2008). The NG2-CreER transgenic line (stock number 008538, RRID:IMSR_JAX:008538) and the B6.Cg-Tg(CAG-Bgeo/GFP)21Lbe/J mice (stock number 004178, RRID:IMSR_JAX:004178) were obtained from The Jackson Laboratory. All mouse lines were maintained heterozygous. Experimental animals were generated by crossing the heterozygous floxed Cav1.2 line (Cav1.2f/+) with the hemizygous NG2-CreER transgenic line (NG2-CreCre/Ø), in which “Ø” denotes the locus without the transgene on the sister chromosome. F1 offspring from the crossbreed that are heterozygous floxed and Cre-positive (Cav1.2f/+, NG2-CreCre/Ø) were intercrossed with other F1 offspring that were heterozygous floxed and Cre-negative (Cav1.2f/+, NG2-CreØ/Ø) to achieve the following experimental genotypes: conditional knock-out (Cav1.2f/f, NG2-CreCre/Ø), wild-type control (Cav1.2+/+, NG2CreØ/Ø), floxed control (Cav1.2f/f, NG2-CreØ/Ø), and Cre control (Cav1.2+/+, NG2-CreCre/Ø). For ease of reading, conditional knock-out mice (Cav1.2f/f, NG2CreCre/Ø) will be referred to as Cav1.2KO throughout the remainder of the text. Following a similar protocol, the heterozygous floxed Cav1.2 mice and the hemizygous NG2-CreER transgenic line were intercrossed with the Cre reporter line B6.Cg-Tg(CAG-Bgeo/GFP)21Lbe/J to achieve the following experimental genotypes: conditional knock-out with the Cre reporter transgene (Cav1.2f/f, NG2-CreCre/Ø, GFPGFP/Ø) and Cre reporter control (Cav1.2+/+, NG2CreCre/Ø, GFPGFP/Ø). For ease of reading, the Cav1.2 conditional knock-out mice carrying the Cre reporter transgene (Cav1.2f/f, NG2-CreCre/Ø, GFPGFP/Ø) will be referred to as Cav1.2KO/GFP throughout the remainder of the text. For all experiments presented here, mice of either sex were used.
Induction of Cre-mediated recombination with tamoxifen.
Cre activity in postnatal Cav1.2KO mice was induced by intraperitoneal injection of 4-OH-tamoxifen or tamoxifen (Sigma-Aldrich). Stock solutions (10 mg/ml) were prepared by dissolving and sonicating 4-OH-tamoxifen or tamoxifen in 19:1 autoclaved vegetable oil:ethanol. Postnatal day 4 (P4) mice were injected with 25 mg/kg 4-OH-tamoxifen intraperitoneally once a day for 5 consecutive days. P10 and P30 mice were injected intraperitoneally once a day for 5 consecutive days with 50 mg/kg and 100 mg/kg tamoxifen, respectively. Control animals were injected following the same protocol.
Primary cultures of cortical OPCs.
Primary cultures of cortical OPCs were prepared as described by Amur-Umarjee et al. (1993). First, cerebral hemispheres from 1-d-old mice were mechanically dissociated and plated on poly-d-lysine-coated flasks in DMEM/F12 (1:1 v/v; Invitrogen) supplemented with 10% FBS (Omega Scientific). After 4 h, the medium was changed and the cells were grown in DMEM/F12 supplemented with insulin (5 μg/ml), apo-transferrin (50 μg/ml), sodium selenite (30 nm), d-Biotin (10 mm), and 10% FBS (Omega Scientific). Two-thirds of the culture medium was changed every 3 d. After 14 d, OPCs were purified from the mixed glial culture by the differential shaking and adhesion procedure of Suzumura et al. (1984) and allowed to grow on poly-d-lysine-coated coverslips in DMEM/F12 supplemented with insulin (5 μg/ml), apo-transferrin (50 μg/ml), sodium selenite (30 nm), 0.1% BSA, progesterone (0.06 ng/ml), and putrescine (16 μg/ml; Sigma-Aldrich). OPCs were kept in mitogens, PDGF (20 ng/ml), and bFGF (20 ng/ml; Peprotech) for 2 d and then induced to exit from the cell cycle and differentiate by mitogen withdrawal and T3 (15 nm) addition. To induce Cre-mediated recombination, control and Cav1.2KO OPCs were treated with 4-OH-tamoxifen (1 μm) during the first 3 d in culture.
Immunocytochemistry.
Cells were stained with antibodies against several oligodendrocyte markers and examined by confocal microscopy. Briefly, the cells were rinsed in PBS and fixed in 4% buffered paraformaldehyde for 20 min at room temperature. After rinsing in PBS, the cells were permeabilized with 0.1% Triton X-100 in PBS for 2 min at room temperature and then processed for immunocytochemistry following the protocol outlined by Reyes and Campagnoni (2002). Essentially, fixed cells were incubated in a blocking solution (5% goat serum in PBS), followed by an overnight incubation at 4°C with the primary antibody. Cells were then incubated with the appropriate secondary antibodies (1:400; Jackson ImmunoResearch), nuclei were stained with the fluorescent dye DAPI (Life Technologies), mounted onto slides with Aquamount (Thermo Scientific), and fluorescent images were obtained using a spinning disc confocal microscope (Olympus, IX83-DSU). Quantitative analysis of the results was done by counting the antigen-positive and DAPI-positive cells (total number of cells) in 20 randomly selected fields, which resulted in counts of >2000 cells for each experimental condition. Data represent pooled results from at least five independent cultures. Quantification was performed by an investigator blinded to the experimental conditions. The primary antibodies used for immunocytochemistry were against: Cav1.2 (1:200; Alomone, RRID:AB_2039771), CC1 (1:300; Calbiochem, RRID:AB_2057371), MBP (1:1000; Covance, RRID:AB_510039), NG2 (1:400; Millipore, RRID:AB_91789), Olig1 (1:500; Millipore, RRID:AB_92198), and PDGFr (1:200; Millipore, RRID:AB_2283679).
Western blot.
Total proteins were collected from primary culture of cortical oligodendrocytes, mouse corpus callosum, cortex, olfactory bulb, optic nerve, cerebellum, and spinal cord. The final protein pellet was homogenized in lysis buffer containing 50 mm Tris-HCl, 0.25% (w/v) sodium deoxycholate, 150 mm NaCl, 1 mm EDTA, 1% (w/v) Triton X-100, 0.1% (w/v) SDS, 1 mm sodium vanadate, 1 mm AEBSF, 10 μg/ml aprotinin, 10 μg/ml leupeptin, 10 μg/ml pepstatin, and 4 μm sodium fluoride. Western blots were performed as described previously (Ghiani et al., 2010). Twenty-five micrograms of total proteins was loaded onto a 4–20% Tris-glycine gel (Life Technologies). Protein bands were detected by chemiluminescence using the GE Healthcare ECL kit with horseradish peroxidase-conjugated secondary antibodies (GE Healthcare, RRID:AB_772206, RRID:AB_772210) and scanned with a C-Digit Bot Scanner (LI-COR). Relative intensities of the protein bands were quantified using Image Studio Software (LI-COR, RRID:SCR_014211). Data represent pooled results from at least four independent cultures or brains per experimental group. The primary antibodies used for Western blots were against: Cav1.2 (1:1000; Alomone, RRID:AB_2039771), CNP (1:1000; Neo-Markes, RRID:AB_61312), GAPDH (1:10,000; Genetex, RRID:AB_11174761), MBP (1:1000; Covance, RRID:AB_510039), MOG (1:1000; Millipore, RRID:AB_1587278), PLP (1:1000, Thermo Scientific, RRID:AB_2165785), and β-actin (1:1000; Sigma-Aldrich, RRID:AB_476744).
RT-PCR.
Total RNA was isolated from primary culture of cortical OPCs using TRIzol reagent (Life Technologies) according to the instructions of the manufacturer and quantified by spectrophotometer. First-strand cDNA was prepared from 1 μg of total RNA using SuperScript III RNase H-reverse transcriptase (Life Technologies) and 1 μg of oligo(dT). The mRNA samples were denatured at 65°C for 5 min. Reverse transcription was performed at 50°C for 55 min and was stopped by heating the samples at 85°C for 5 min. The cDNA was amplified by PCR using primers flanking the Cav1.2 exon 2 and PCR Platinum Supermix reagent (Life Technologies). The primers sequences were designed based on published sequences by White et al. (2008). PCR conditions were as follows: 94°C for 2 min, 40 cycles of 94°C for 30 s, 58°C for 30 s, followed by 68°C for 2 min. After completion of the 40 cycles, samples were incubated at 72°C for 10 min. A GAPDH-positive control was run alongside the experimental samples, as well as a negative control with no reverse transcriptase. The PCR products were visualized on a SYBR Safe-stained agarose gel and the bands digitized using a Gel Doc EZ System (Bio-Rad, RRID:SCR_014210).
Immunohistochemistry.
All animals were anesthetized with isoflurane and then perfused with 4% of paraformaldehyde in PBS via the left ventricle. The brains were postfixed overnight in the same fixative solution at 4°C. Coronal brain slices 50 μm thick were obtained using a vibratome (Leica Biosystems, VT1000-S). Free-floating vibratome sections were incubated in a blocking solution (2% normal goat serum and 1% Triton X-100 in PBS) for 2 h at room temperature and then incubated with the primary antibody overnight at 4°C. Sections were then rinsed in PBS and incubated with Cy3- or Cy5-conjugated secondary antibodies (1:400; Jackson Immuno Research) for 2 h at room temperature, followed by a counterstaining with the nuclear dye DAPI (Life Technologies). After washing, the sections were mounted on to Superfrost Plus slides (Fisher Scientific) using coverslips and mounting medium (Aquamount; Thermo Scientific). The total number of positive cells was quantified stereologically in the central and lateral area of the corpus callosum (0.5 mm2) and in the cingulate cortex (0.5 mm2, including all the cortical layers). For all experiments involving quantification of positive cells and fluorescent intensity in tissue sections, data represent pooled results from at least six brains per experimental group. Five slices per brain (50 μm each) were used and quantification was performed blinded to the genotype of the sample using an unbiased stereological sampling method. The primary antibodies used in the present study were against: caspase-3 (1:1000; Cell Signaling Technology, RRID:AB_2341188), CC1 (1:300; Calbiochem, RRID:AB_2057371), CD45 (1:200; Millipore, RRID:AB_2174425), GFAP (1:1000; Millipore, RRID:AB_2109815), GFP (1:500; Millipore, RRID:AB_11211640), GFP (1:500; Aves, RRID:AB_10000240), Ki67 (1:250; Abcam, RRID:AB_443209), MBP (1:1000; Covance, RRID:AB_510039), MOG (1:200; Millipore, RRID:AB_1587278), NG2 (1:400; Millipore, RRID:AB_91789), Olig1 (1:500; Millipore, RRID:AB_92198 and), Olig2 (1:500; Millipore, RRID:AB_570666, RRID:AB_10807410), PLP (1:50; hybridoma AA3, RRID:AB_2341144), and Sox2 (1:250; Millipore, RRID:AB_2286686).
Black Gold II myelin staining.
The Black Gold II myelin staining kit (Millipore) was used according to the manufacturer's instructions. Briefly, paraformaldehyde-fixed 50 μm tissue sections from controls and Cav1.2KO were mounted in the same Superfrost Plus slide (Fisher Scientific) and then air dried for 15 min, followed by 30 min on a slide warmer at 55°C. Tissue sections were then rehydrated in distilled water for 2 min. The slides were then transferred to a 0.3% Black Gold II solution (Millipore) dissolved in 0.9% saline vehicle and heated in a water bath at 60°C. After 12 min, the extent of the impregnation was monitored microscopically. This monitoring was repeated every 2 min until the desired degree of myelin impregnation was observed. Next, the slides were rinsed twice for 2 min in distilled water and then transferred to a 1% sodium thiosulfate solution for 3 min at 60°C. Finally, the slides were rinsed 3 times with distilled water for 2 min, dehydrated by air drying for 15 min, followed by 30 min on a slide warmer, immersed for 2 min in xylene, and coverslipped with Permount. Once the brain tissue sections were stained, the corpus callosum, striatum, and cingulate cortex were all examined microscopically at both low- and high-power magnification and the staining intensity in each area was assessed using MetaMorph software (Molecular Devices, RRID:SCR_002368). Data represent pooled results from at least four brains per experimental group. Ten slices per brain were used and quantification was performed blinded to the genotype of the sample.
Electron microscopy.
Mice were perfused with 3% paraformaldehyde and 1% glutaraldehyde for resin embedding. A block of ∼1 × 1 × 2 mm3 was removed from the body of the corpus callosum at the level of the anterior–dorsal hippocampus. Semithin sections were stained with 1% toluidine blue (Sigma-Aldrich) and examined by light microscopy. Detailed evaluation of myelin integrity in the corpus callosum was performed on uranyl acetate- and lead citrate-stained thin sections using a FEI Tecnai F20 transmission electron microscope. Extent of myelination was compared quantitatively by determining g-ratios, which were calculated by dividing the diameter of the axon by the diameter of the entire myelinated fiber as described previously (Jacobs et al., 2005). Furthermore, the percentage of myelinated axons from the total number of axons was calculated. At least five animals per experimental group and 100 fibers per animal were analyzed using MetaMorph software (Molecular Devices, RRID:SCR_002368).
Calcium imaging in vitro.
Methods were similar to those described previously (Paez et al., 2007, 2011). Briefly, primary culture of cortical OPCs were washed in serum and phenol-red-free DMEM containing a final concentration of 4 μm fura-2 (AM; Life Technologies) plus 0.08% Pluronic F127 (Life Technologies) to load dye into the cells, incubated for 25 min at 37°C and 5% CO2, washed 4 times in DMEM, and stored in DMEM for 10 min before being imaged. Calcium influx and resting Ca2+ levels were measured in serum and phenol-red-free HBSS containing 1.3 mm Ca2+ and 1 mm Mg2+. The fluorescence of fura-2 was excited alternatively at wavelengths of 340 and 380 nm every 2 s by means of a high-speed wavelength-switching device (Sutter Instruments, Lambda DG4). A spinning disc confocal inverted microscope (Olympus, IX83-DSU) equipped with a CCD camera (Hamamatsu, ORCA-R2) measured the fluorescence. Calcium influx and resting Ca2+ levels were measured on individual oligodendrocyte cell bodies using the image analysis software MetaFluor (Molecular Devices, RRID:SCR_014294). More than 600 cells for each experimental condition were analyzed and the results from five separate experiments were pooled. To minimize bleaching, the intensity of excitation light and sampling frequency was kept as low as possible.
Calcium imaging in situ.
Calcium-imaging acquisitions of Cav1.2KO/GFP-positive cells were performed on living slices at P10, as described previously (Dawitz et al., 2011). P4 triple transgenic mice and their corresponding controls were injected with 25 mg/kg 4-OH-tamoxifen intraperitoneally once a day for 5 consecutive days. Two days after the last injection (P10), mice were anesthetized with isoflurane, after which brains were rapidly removed and stored in ice-cold slice solution containing the following (in mm): 110 choline chloride, 25 NaHCO3, 11.6 sodium ascorbate, 7 MgCl2, 3.1 sodium pyruvate, 2.5 KCl, 1.25 NaH2PO4, 0.5 CaCl2, and 10 glucose gassed with 95% O2 and 5% CO2. Coronal slices were cut at 150 μm thickness on a vibratome (Leica, VT1000S). Brain slices were kept for 2 h at room temperature in artificial CSF (ACSF) containing the following (in mm): 125 NaCl, 3 KCl, 2.5 MgCl2, 1.25 NaH2PO4, 26 NaHCO3, 1.6 CaCl2, and 10 glucose gassed with 95% O2 and 5% CO2. Intracellular Ca2+ measurements were made after loading the tissue with 20 μm fura-2 AM in ACSF for 30 min at 36°C (Grynkiewicz et al., 1985). The slices were then washed with ACSF for 30 min before being imaged. Calcium influx and resting Ca2+ levels were measured in ACSF containing 1.5 mm MgCl2. For cell detection and identification, a z-stack using a step size of 1 μm and image ±20 μm around the imaged plane of focus was taken. Only in-focus, GFP-positive cell bodies were selected for the analysis. Four brains per experimental group and six slices per brain were used. About 100 individual cells were evaluated in each slice. Measurements were made once every 2 s.
Time-lapse image acquisition.
To follow the migration and proliferation of Cav1.2KO/GFP-positive cells, brain slices from P6 triple transgenic mice and their corresponding controls were prepared as described previously (Bahr et al., 1995) using MilliCell culture inserts (0.45 μm pore size, Millipore). The slices were maintained in the incubator and treated with 4-OH-tamoxifen (1 μm) for 6 d. At the end of the treatment, brain slices were incubated in a stage top chamber with 5% CO2 at 37°C (Live-Cell Control Unit), which was placed on the stage of a spinning disc confocal inverted microscope (Olympus, IX83-DSU) equipped with a motorized z-stage. A 10× objective was used for acquiring images. Fluorescent field images were obtained for brain slices with a specific GFP filter at 25 ms exposure times. Images were taken every 6 min over a period of 48 h using a CCD camera (Hamamatsu, ORCA-R2) and image analysis software (MetaMorph, Molecular Devices, RRID:SCR_002368). Cell migration speed and distances were analyzed offline by tracing individual cells using the motion tracking function of MetaMorph software. The brightest part of each cell body was used as the tracking target. Tracking of Cav1.2KO/GFP cells in living slices was started from a time point when a cell first came into focus or appeared at the edge of the imaging field until it either went out of focus or left the imaging field. Subsequently, migratory values were analyzed statistically across genotypes. The percentage of cycling Cav1.2KO/GFP cells was analyzed by visual observation by counting the total number of cell divisions during the entire time-lapse experiment.
Statistical analysis.
Normal distributions were tested in each dataset using Kolmogorov–Smirnov tests. For data with normal distributions, single between-group comparisons were made with the Student paired t test and multiple comparisons were made with one-way ANOVA followed by Bonferroni's multiple-comparisons tests to detect pairwise between-group differences. All statistical tests were performed in GraphPad Prism software (RRID:SCR_002798). A fixed value of p < 0.05 for one-tailed tests was the criterion for reliable differences between groups. Data are presented as mean ± SEM unless otherwise noted.
Results
Reduced maturation of OPCs isolated from the Cav1.2KO mice
We have created a conditional knock-out mouse for the L-VOCC in OPCs by cross-breeding the floxed mutant Cav1.2 line (White et al., 2008) with the NG2-CreER transgenic line (Zhu et al., 2011). In the floxed Cav1.2 line, exon 2 of the wild-type Cav1.2 gene (Cacna1c) was flanked with loxP sites, so exon 2 is eliminated when Cre-recombinase is present. Removal of exon 2 leads to a truncated, nonfunctional protein and the absence of a specific L-VOCC (White et al., 2008). NG2-CreER transgenic mice express a tamoxifen-inducible Cre recombinase under the control of the mouse NG2 (Cspg4) promoter/enhancer, which restricts Cre expression to OPCs (Zhu et al., 2011).
Verification of conditional deletion of Cav1.2 was initially performed in isolated OPCs from Cav1.2KO mice. Primary cultures of OPCs prepared from P1–2 Cav1.2KO pups (Cav1.2f/f, NG2-CreCre/Ø) were kept in mitogens (PDGF and bFGF) for 2 d and then induced to exit from the cell cycle and differentiate by mitogen withdrawal and T3 addition. Cre-negative OPCs were used as a control (Cav1.2f/f, NG2-CreØ/Ø). Cells were treated with 4-OH-tamoxifen during the first 3 d in culture to induce Cre-mediated recombination and verification of conditional deletion of the L-VOCC isoform Cav1.2 was performed by RT-PCR and Western blot (Fig. 1A). Total mRNA was reverse transcribed and the resulting cDNA was amplified using primers flanking exon 2 of the Cav1.2 gene (Fig. 1A). Immunoblotting was performed using membrane fractions from Cav1.2KO and control OPCs (Fig. 1A). RT-PCR and Western blot experiments showed high recombination efficiency and decreased Cav1.2 protein quantities in Cav1.2KO OPCs (Fig. 1A). Similarly, immunocytochemical experiments showed low levels of Cav1.2 expression in Cav1.2KO OPCs after 3 d of 4-OH-tamoxifen treatment (Fig. 1A). The conditional deletion of L-VOCCs on Ca2+ entry was further examined by monitoring L-VOCC function through fura-2 ratiometric Ca2+ imaging experiments, as described previously (Cheli et al., 2015; Fig. 1B–D). Calcium influx mediated by L-VOCCs was induced by depolarization via elevated external K+ (Paez et al., 2007, 2009a, 2010). In control cells, bath application of a solution containing high K+ caused an average Ca2+ increase of ∼138% (Fig. 1B–D); in Cav1.2KO OPCs, the Ca2+ transient induced by high K+ was significantly lower (∼47%; Fig. 1B–D). Importantly, the rise in intracellular Ca2+ in control and in Cav1.2KO cells was blocked by the specific L-type VOCC inhibitors nifedipine and verapamil and was inhibited by the removal of external Ca2+ (Fig. 1C, −Ca2+).
Figure 1.
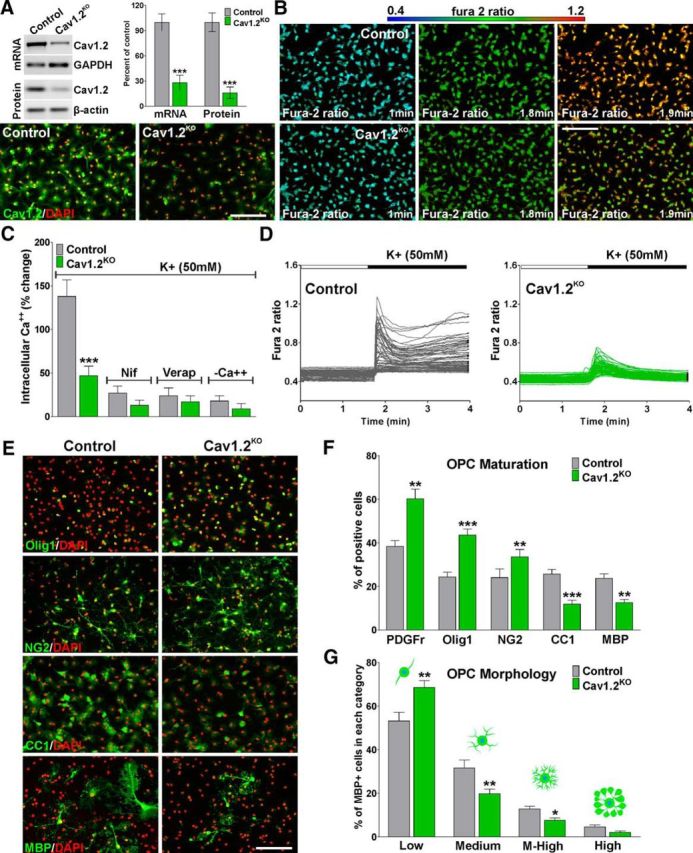
Delayed in vitro maturation of Cav1.2KO OPCs. A, After 3 d of 4-OH-tamoxifen treatment, semiquantitative RT-PCR and Western blot analysis of Cav1.2 expression in OPCs was performed using GAPDH and β-actin, respectively, as internal standards. In addition, the expression of Cav1.2 was analyzed by immunocytochemistry. Scale bar, 80 μm. B, VOCC activity was examined in OPCs from control and Cav1.2KO mice using high K+ (50 mm). Fura-2 images were obtained with specific filters at 2 s intervals for a total of 4 min. Each frame represents a single section of a fura-2 time-lapse experiment. An increased fura-2 fluorescence ratio is indicated by warmer colors. Time is denoted in minutes in the bottom right corner. Scale bar, 80 μm. C, Ca2+ uptake was stimulated in control and Cav1.2KO cells using high K+ (50 mm) in the presence of nifedipine (5 μm), verapamil (5 μm), and zero Ca2+ medium (−Ca2+). The bar graph shows the average amplitude of the Ca2+ response, calculated from the responding cells expressed as a percentage of change of the emission intensities. D, Fura-2 imaging of Ca2+ responses to 50 mm K+ in control and Cav1.2KO OPCs. Note that each trace corresponds to a single cell and the horizontal bar indicates the time of high K+ addition. E, F, Two days after mitogen withdrawal, OPCs were stained with antibodies against PDGFr, Olig1, NG2, CC1, and MBP and the percentage of positive cells in each experimental condition was examined by confocal microscopy. Scale bar, 80 μm. G, Morphological complexity of MBP-positive cells was scored in four categories. Values are expressed as mean ± SEM of at least five independent experiments. *p < 0.05, **p < 0.01, ***p < 0.001 versus control.
In addition, primary cultures of Cav1.2KO OPCs were used to investigate the maturation of oligodendroglial cells in which the α1 subunit of the L-type Ca2+ channel was deleted (Fig. 1E–G). The morphological differentiation of OPCs (process formation and branching) and the expression of oligodendrocyte stage-specific markers, including myelin proteins, were analyzed 2 d after mitogen withdrawal. Our results show a significant maturational delay in Cav1.2KO OPCs relative to control cells (Fig. 1E–G). OPCs lacking L-VOCCs retained elevated levels of immature markers such as PDGFr, Olig1, and NG2; expressed low quantities of CC1 and MBP (Fig. 1E,F); and presented a simple bipolar morphology. More than 70% of Cav1.2KO OPCs were classified in the low category according to Sperber and McMorris (2001) (Fig. 1G).
Abnormal myelination in the brains of Cav1.2KO mice
To delete L-VOCCs in NG2 positive OPCs at different developmental time windows, Cre activity was induced starting at P4, P10, and P30 by intraperitoneal injection of tamoxifen. Cav1.2KO and control mice were injected once a day for 5 consecutive days with tamoxifen and brain tissue was collected at P20 for animals injected at P4 (P4 + 16), at P30 for mice injected at P10 (P10 + 20), and at P60 for mice treated at P30 (P30 + 30). Because no significant differences were found among wild-type controls (Cav1.2+/+, NG2CreØ/Ø), floxed controls (Cav1.2f/f, NG2-CreØ/Ø), and Cre controls (Cav1.2+/+, NG2-CreCre/Ø), only results from floxed controls are shown.
The postnatal myelination of the Cav1.2KO mouse was initially examined using the Black Gold II staining technique to localize myelin within the CNS. As shown in Figure 2A, Cav1.2KO mice injected at P4 and P10 displayed a substantial reduction in myelin staining in the corpus callosum and a clear reduction in the density of myelinated fibers in the cingulate cortex (Fig. 2A,B). In the same experimental groups, decreased myelin staining was also evident in the striatum (Fig. 2A,B). Importantly, no differences were detected in animals injected with tamoxifen at P30 and examined at P60 (Fig. 2A,B). Furthermore, we performed immunohistochemical analysis of myelin protein expression in control and Cav1.2KO mice. Compared with controls, Cav1.2KO mice treated with tamoxifen at P4 and P10 showed a reduced expression of MBP and MOG in the corpus callosum (Fig. 3A,B). Likewise, the number and density of positive fibers for MBP and MOG were reduced in the cingulate cortex of Cav1.2KO mice (Fig. 3A,B). In contrast, animals injected at P30 displayed normal levels of myelin protein expression in the same areas of the brain (Fig. 3B). Moreover, to assess myelination in adult Cav1.2KO animals, control and Cav1.2KO mice were injected with tamoxifen at P10 and brain tissue was collected at P60 (P10 + 50). We found a significant deficit in the expression of myelin proteins such as MBP and PLP in the corpus callosum, cortex, and striatum of adult Cav1.2KO animals (Fig. 3C), suggesting that the hypomyelination found in young Cav1.2KO mice (P4 + 16 and P10 + 20) is persistent throughout adulthood.
Figure 2.

Black Gold II staining for myelin in the Cav1.2KO brain. A, Black Gold II staining in the brains of control and Cav1.2KO mice injected at P4, P10, and P30. Representative coronal sections of the lateral area of the corpus callosum (CC) and the striatum are shown. Scale bar, 360 μm. B, Black Gold II staining intensity was quantified in the CC, the cingulate cortex (cortex), and striatum. Values are expressed as mean ± SEM of four independent experiments. *p < 0.05, **p < 0.01 versus the respective controls.
Figure 3.
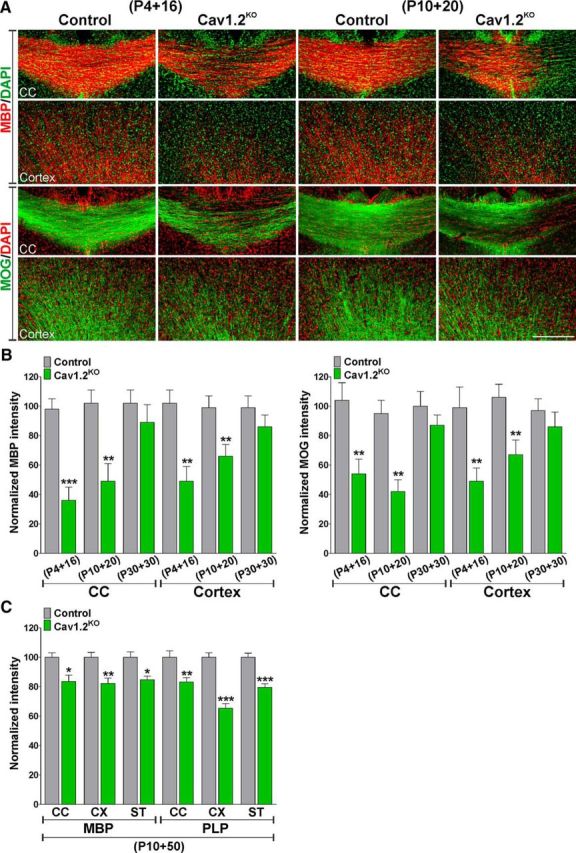
Reduced myelin protein synthesis in the postnatal Cav1.2KO brain. A, Representative coronal sections of the central area of the corpus callosum (CC) and the cingulate cortex (cortex) of control and Cav1.2KO mice injected at P4 and P10 and immunostained with anti-MBP and anti-MOG antibodies. Scale bar, 180 μm. B, Myelin was quantified by analyzing fluorescence intensity of MBP and MOG in the CC and in the cingulate cortex (cortex). C, Control and Cav1.2KO mice were injected at P10 and immunostained with anti-MBP and anti-PLP antibodies at P60. Myelin was quantified by analyzing fluorescence intensity of MBP and PLP in the CC, cingulate cortex (CX), and striatum (ST). Values are expressed as mean ± SEM of four independent experiments. *p < 0.05, **p < 0.01, ***p < 0.001 versus the respective controls.
Total proteins were collected from diverse CNS structures to evaluate the expression of myelin proteins by Western blot (Fig. 4). In agreement with the above-described results, the expression levels of MBP, MOG, PLP, and CNP were significantly lower in the corpus callosum, cortex, and olfactory bulb of tamoxifen-treated Cav1.2KO brains (Fig. 4A–C). Importantly, these changes were more prominent in the P10 treated group, in which the decrease in the expression of myelin proteins was >50% (Fig. 4A–C). No changes in the expression of myelin proteins were detected in the optic nerve, cerebellum, and spinal cord of Cav1.2KO animals (Fig. 4D–F). In addition, we used electron microscopy to evaluate the ultrastructure of axon and myelin integrity in the Cav1.2KO brains. The degree of myelination was analyzed in mice injected with tamoxifen at P10 by calculating the axon diameter, myelin thickness, and mean g-ratio of myelinated axons as described previously (Jacobs et al., 2005; Fig. 5A). A significant reduction in the percentage of myelinated axons and a substantial increase in the mean g-ratio of myelinated axons was found in the corpus callosum of Cav1.2KO animals (Fig. 5A–D). In addition, the scatter plot of g-ratio values revealed that hypomyelination affected axons of all size (Fig. 5B). Importantly, no axonal loss and/or degeneration and no changes in the frequency distribution of axonal diameter were found in the corpus callosum of Cav1.2KO mice (Fig. 5E,F).
Figure 4.
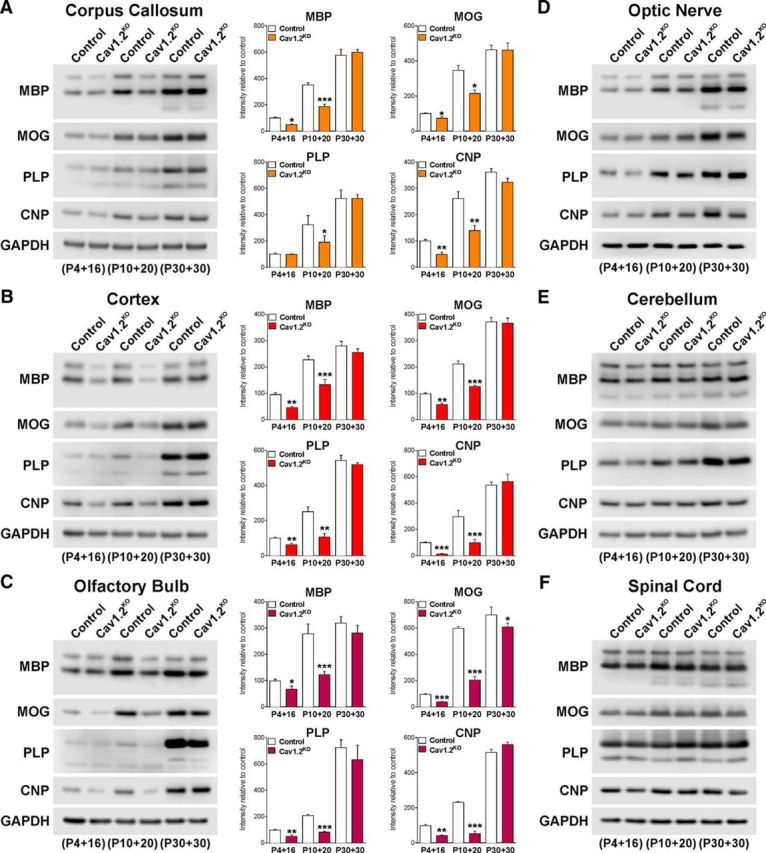
Western blot analysis of myelin protein expression. Total proteins were collected from the corpus callosum (A), cortex (B), olfactory bulb (C), optic nerve (D), cerebellum (E), and spinal cord (F) of Cav1.2KO animals to assess the expression of MBP, MOG, PLP, and CNP by Western blot. Representative Western blots are shown. GAPDH was used as the internal standard and data from four independent experiments are summarized based on the relative spot intensities and plotted as percentage of the P4 control. Because no statistical differences between experimental groups were detected, the quantitative bar graphs for D–F are not shown. Values are expressed as mean ± SEM of four independent experiments. *p < 0.05, **p < 0.01, ***p < 0.001 versus the respective controls.
Figure 5.

Electron microscopy of the Cav1.2KO corpus callosum. A, Electron micrographs of axons in the corpus callosum of control and Cav1.2KO mice injected at P10. Scale bars, 8 μm top, 2 μm bottom. B, C, Scatter plot and mean g-ratio values in the corpus callosum of control and Cav1.2KO mice. D, Percentage of myelinated axons in the corpus callosum of control and Cav1.2KO mice. E, F, Mean axonal diameter and distribution of axonal size in control and Cav1.2KO mice fibers. Values are expressed as mean ± SEM. Five animals per experimental group and 100 fibers per animal were analyzed. ***p < 0.001 versus control.
Decreased number of mature oligodendrocytes in the corpus callosum and cortex of Cav1.2KO mice
To further examine the effect of L-VOCC deletion in OPC development, specific oligodendrocyte markers such as Olig2 and CC1 were used to measure oligodendrocyte numbers. Olig2-positive cells were observed in great numbers throughout the central area of the corpus callosum and in the cingulate cortex of the controls (Fig. 6A). Conversely, the number of these oligodendroglial cells was significantly lower in the Cav1.2KO mice injected at P4 and P10 (Fig. 6A,B). Immunohistochemical analysis for CC1, a marker of myelinating oligodendrocytes, exhibited a similar outcome with the Cav1.2KO line, showing a reduced number of CC1-positive cells in the corpus callosum and in the cingulate cortex (Fig. 6A,B). In the same line, the percentage of Olig2/CC1 double-positive cells was diminished in the same brain areas (Fig. 6C). Notably, no changes in the density of Olig2- or CC1-positive cells were found in the group of animals injected at P30 (Fig. 6B). Next, OPC proliferation was evaluated using the mitotic marker Ki67 in combination with the oligodendrocyte marker Olig2 and the proportion of newly generated OPCs was assessed by mixing Olig2 with the transcription factor Sox2 (Fig. 7). Suggesting a decline in the rate of OPC proliferation, Cav1.2KO mice injected at P4 and P10 displayed a significant decrease in the percentage of Olig2/Ki67 and Olig2/Sox2 double-positive cells in the central and lateral areas of the corpus callosum (Fig. 7A,B). To assess cell death, the proportion of Olig2/Caspase-3 double-positive cells was established in the central area of the corpus callosum and in the cingulate cortex of animals injected at P4 and P10. In all experimental groups, the percentage of these apoptotic oligodendrocytes was <5%, with no statistical differences between genotypes (data not shown). Last, the density of GFAP-positive astrocytes and the total number of CD45-positive macrophages (activated microglia) were also evaluated in the brains of Cav1.2KO mice. Control and Cav1.2KO injected mice at both developmental time windows (P4 and P10) showed no significant differences in the number of these cell types in any of the brain areas analyzed (Fig. 7C), suggesting that the hypomyelination found in the Cav1.2KO line is not associated with brain inflammation and/or astrogliosis.
Figure 6.
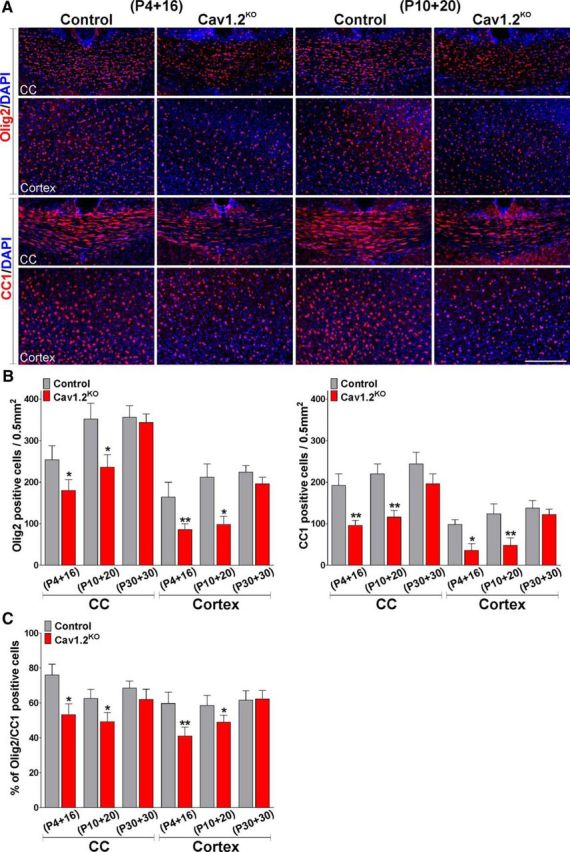
Decreased number of mature oligodendrocytes in the Cav1.2KO mouse. A, Representative coronal sections of the central area of the corpus callosum (CC) and the cingulate cortex (cortex) of control and Cav1.2KO mice injected at P4 and P10 and immunostained with anti-Olig2 and anti-CC1 antibodies. Scale bar, 180 μm. B, C, Number of Olig2-, CC1-, and Olig2/CC1-positive cells was quantified stereologically in the central area of the CC and in the cingulate cortex (cortex) of control and Cav1.2KO mice. Values are expressed as mean ± SEM of four independent experiments. *p < 0.05, **p < 0.01 versus the respective controls.
Figure 7.
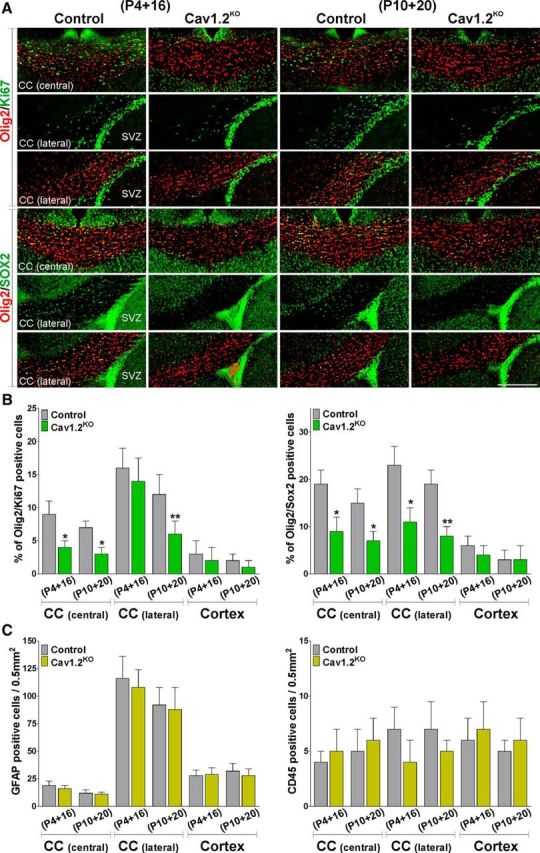
OPC proliferation in the Cav1.2KO mouse. A, Representative coronal sections of the central and lateral areas of the corpus callosum (CC) of control and Cav1.2KO mice injected at P4 and P10 and immunostained with anti-Olig2, anti-Ki67, and anti-Sox2 antibodies. Scale bar, 180 μm. B, C, Number of Olig2/Ki67-, Olig2/Sox2-, GFAP-, and CD45-positive cells was quantified stereologically in the central and lateral areas of the CC and in the cingulate cortex (cortex) of control and Cav1.2KO mice. Values are expressed as mean ± SEM of four independent experiments. *p < 0.05, **p < 0.01 versus the respective controls.
Cav1.2KO OPCs produce fewer mature oligodendrocytes than control progenitors in the postnatal brain
To investigate the fate of OPCs in the Cav1.2KO brain, we generated a triple transgenic mouse by crossing the Cav1.2KO mice with a Cre reporter line. When the Cre reporter mice B6.Cg-Tg(CAG-Bgeo/GFP)21Lbe/J is crossed with a Cre expressing strain, lacZ expression is replaced with enhanced GFP expression in cells expressing Cre, providing a convenient marker for Cav1.2KO OPCs in the postnatal brain. Initially, P4 Cav1.2KO/GFP mice (Cav1.2f/f, NG2-CreCre/Ø, GFPGFP/Ø) and their corresponding controls (Cav1.2+/+, NG2CreCre/Ø, GFPGFP/Ø) were injected with 4-OH-tamoxifen for 5 consecutive days. Two days after the last injection (P10), Ca2+ imaging acquisitions of cortical Cav1.2KO/GFP-positive cells were performed on living slices (Fig. 8). Exposure to high-K+-containing medium triggered a significant increase in the intracellular Ca2+ concentration in control GFP-positive cells (Fig. 8A–C). As expected, Cav1.2KO/GFP OPCs exhibited Ca2+ signaling after stimulation with high K+, but these Ca2+ signals were significantly weaker than those of the control cells (Fig. 8B,C). Pharmacological experiments demonstrated that this Ca2+ response was abolished in the presence of verapamil and nifedipine, specific L-VOCC blockers (Fig. 8C). Similar results were found in callosal OPCs. At P10, a decrease in the activity of L-VOCCs in Cav1.2KO/GFP OPCs located in the corpus callosum was found (Fig. 8D,E). Importantly, cortical neurons presented no changes in the activity of L-VOCCs among genotypes (Fig. 8F). These data suggest that L-VOCC activity is specifically reduced in Cav1.2KO/GFP-positive cells and that the Cav1.2 L-type α1 subunit is essential for Ca2+ influx after plasma membrane depolarization in oligodendrocytes.
Figure 8.
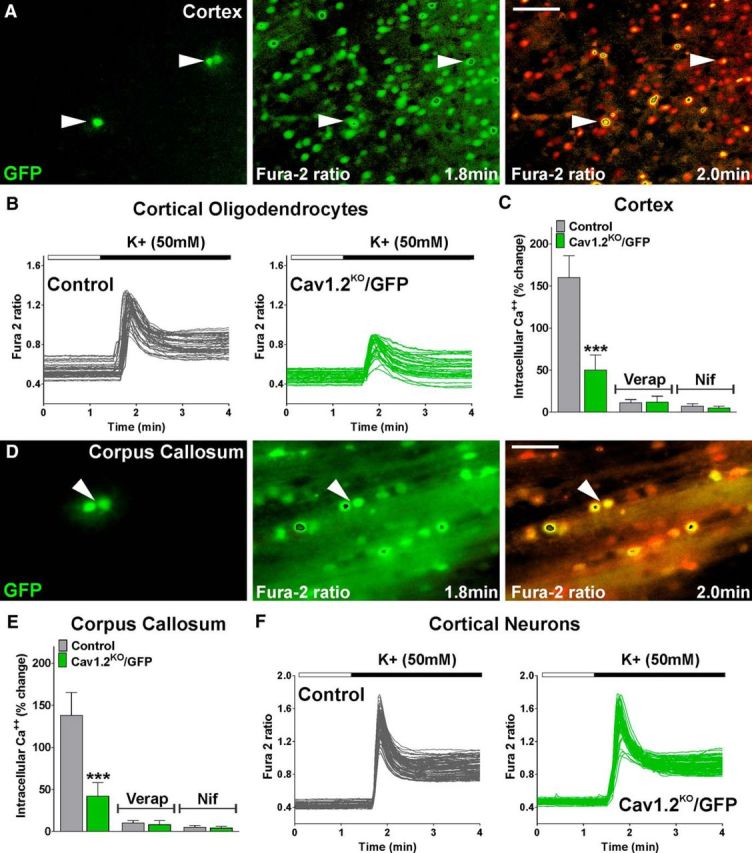
Reduced in situ L-VOCC activity in Cav1.2KO oligodendrocytes. A, D, Fura-2 time-lapse series of control GFP-positive OPCs located in the somatosensory cortex and in the lateral area of the corpus callosum at P10. Scale bar, 40 μm. Arrowheads indicate GFP-positive cells that were selected for the analysis. An increased fura-2 fluorescence ratio is indicated by warmer colors and time is denoted in minutes in the lower right corner. B, F, L-VOCC activity was examined in cortical OPCs and in cortical neurons from control and Cav1.2KO/GFP mice at P10. Note that each trace corresponds to a single cell and the horizontal bar indicates the time of high K+ addition. C, E, Cortical and callosal OPCs from control and Cav1.2KO/GFP mice were also stimulated with high K+ (50 mm) in the presence of verapamil (5 μm) and nifedipine (5 μm). The graphs show the average amplitude calculated from the responding cells expressed as percentage of change of the emission intensities. Values are expressed as mean ± SEM of at least four independent experiments. ***p < 0.001 versus the respective controls.
To compare the ability of Cav1.2KO/GFP cells to generate myelinating cells, the percentages of mature and immature GFP-positive oligodendrocytes were determined in the triple transgenic mice. P4 Cav1.2KO/GFP mice and their corresponding controls were injected with 4-OH-tamoxifen for 5 consecutive days and brain tissue was collected at P20. Initially, the proportion of GFP-positive cells that were Olig2-positive oligodendrocytes was determined. Suggesting a lineage specific and restricted recombination, we found that all of the GFP-positive cells were positive for the oligodendrocyte marker Olig2 (Fig. 9A–C). Next, to compare the ability of Cav1.2KO/GFP cells to generate myelinating oligodendrocytes, the percentage of GFP-positive cells that were CC1-positive oligodendrocytes was determined. We found a significant decline in the percentage of CC1-positive oligodendrocytes between control and Cav1.2KO/GFP cells in all brain structures examined (Fig. 9A–C). For instance, 68% of the control GFP-positive cells were CC1-positive oligodendrocytes in the cortex at P20, but only 37% of the Cav1.2KO/GFP cells were found to be CC1 positive at the same age (Fig. 9A,B). In the same line, and suggesting a slower maturational rate, the percentage of Olig1- and NG2-expressing cells was higher in the Cav1.2KO/GFP population than in control GFP cells in each brain area analyzed (Fig. 9A–C). The morphology of GFP-positive cells was also studied by dividing the cells into two groups according to the presence of radial processes (immature oligodendrocytes) or parallel processes (myelinating oligodendrocytes). Consistent with the above-described results, the number of GFP-positive oligodendrocytes with mature myelinating morphology was much greater in the control than in the Cav1.2KO corpus callosum or cortex (Fig. 9D). In addition, the proportion of proliferating and apoptotic OPCs was estimated in the Cav1.2KO/GFP mice by using the mitotic marker Ki67 and the apoptotic marker caspase-3. As shown in Figure 9E, the percentage of GFP/Ki67 double-positive cells in the corpus callosum close to the subventricular zone was significantly reduced in L-VOCC-deficient OPCs. In contrast, the proportion of apoptotic GFP-positive cells (GFP/Caspase-3) was not different among the genotypes in the corpus callosum, cortex, or striatum (Fig. 9E). Together, these findings indicate that more mature oligodendrocytes are generated from control OPCs than from Cav1.2KO/GFP cells and that Cav1.2KO/GFP OPCs proliferate less than control cells in the postnatal brain.
Figure 9.

Decreased maturation of Cav1.2KO/GFP OPCs in the postnatal brain. A, Representative coronal sections of the cingulate cortex of control and Cav1.2KO/GFP mice injected at P4 and immunostained with anti-Olig2 and anti-CC1 antibodies. Scale bar, 150 μm. B, C, Number of double-positive cells for Olig2, Olig1, NG2, and CC1 was quantified stereologically in the corpus callosum, cingulate cortex, and striatum. D, Morphological examination of GFP-positive cells in the same brain areas. E, Proportion of double-positive cells for Ki67 and caspase-3 was quantified stereologically in the corpus callosum, cingulate cortex, and striatum. Values are expressed as mean ± SEM of four independent experiments. *p < 0.05, **p < 0.01, ***p < 0.001 versus the respective controls.
Decreased migration and proliferation of Cav1.2KO OPCs
Finally, to follow the migration and proliferation of Cav1.2KO/GFP OPCs in real time, slice cultures from P6 triple transgenic mice were treated with 4-OH-tamoxifen in vitro for 6 consecutive days. We tracked cell bodies of migrating GFP-positive OPCs for a period of 48 h in slice preparations containing the corpus callosum and the subventricular zone (SVZ). In these time-lapse experiments, cell movement was assessed by calculating the average cell migration velocity and the total distance traveled by the cell. Examples of such measurements are shown in Figure 10A. Under these experimental conditions, the mean rates of migration for control and Cav1.2KO/GFP OPCs in the SVZ were 27 ± 5.2 μm/h and 18 ± 4.6 μm/h, respectively (n = 40 cells, p < 0.001). Therefore, the in vivo average cell migration velocity of Cav1.2KO/GFP OPCs was significantly lower compared with that of the control group (Fig. 10B). As might be expected, there was also a decrease in the total migration distance after 24 h (control: 368 ± 53 μm and Cav1.2KO: 239 ± 48 μm; n = 40 cells, p < 0.001; Fig. 10D). Migrating cells move in a saltatory fashion, alternating periods of higher and lower speed. These cycles reflect the steps requires for directed OPC movement: extension of the leading process, translocation of the soma/nucleus, and retraction of the trailing process (Paez et al., 2009a). We measured the average frequency and amplitude of saltatory movement of migrating OPCs and examples of this in control and Cav1.2KO/GFP OPCs are shown in Figure 10C. The frequency of saltatory movement among genotypes was the same, but we found a significant decrease in the maximum speed in Cav1.2KO/GFP OPCs compared with control cells (127 ± 16 and 78 ± 11 μm/h, respectively, n = 40, p < 0.001; Fig. 10C). These data suggest that the average speed changes in Cav1.2KO/GFP cells are due to a reduction in the maximum speed reached during the soma translocation. Finally, OPC proliferation was assessed in time-lapse videos by counting the total number of mitotic events in the SVZ of control and Cav1.2KO/GFP brains. Examples of cytokinetic events in GFP-labeled OPCs from control mice are shown in Figure 10E. In agreement with the immunohistochemical results, which suggest that Cav1.2KO/GFP OPCs proliferate less than control cells in the postnatal brain, ∼54% of control OPCs underwent cell division after 24 h, whereas only 24% of the Cav1.2KO cells proliferated in the same period of time. (Fig. 10F).
Figure 10.
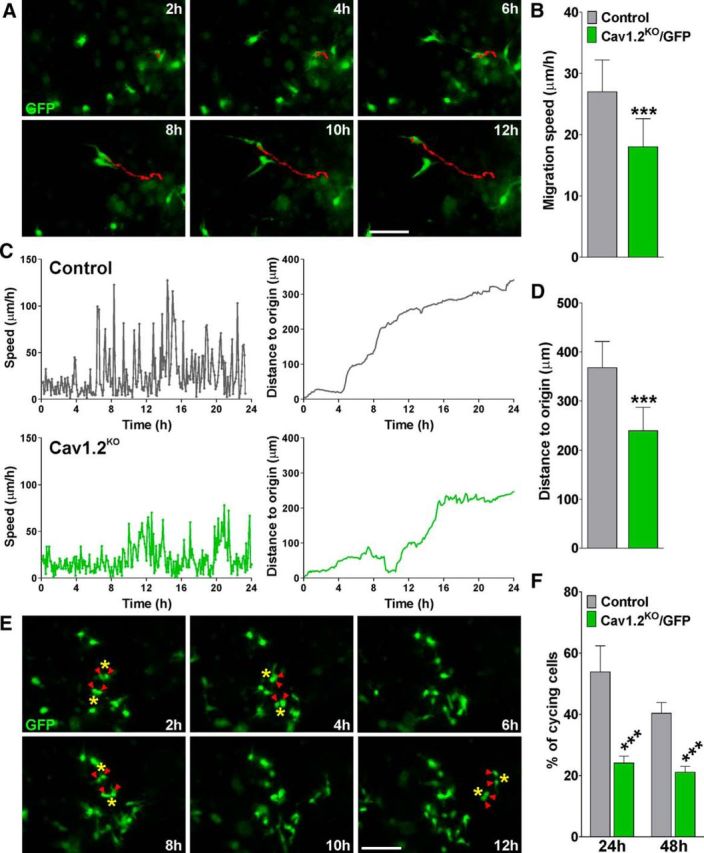
Migration and proliferation of Cav1.2KO/GFP OPCs in living tissue. A, Time-lapse series of control GFP-expressing OPCs in the dorsolateral SVZ. Each frame represents a single section of a time-lapse video sequence. Time is denoted in hours in the upper right corner. A reconstruction of the path of cell movement for a single GFP-expressing OPC is shown. Scale bar, 150 μm. B, D, Average cell migration speed and the distance traveled from the origin was calculated from at least 40 cells in each genotype. C, Analysis of migration speed and distance traveled from the origin in two representative GFP-expressing OPCs. E, Examples of cytokinetic events in GFP-labeled OPCs from control mice in the dorsolateral SVZ. F, Percentage of control and Cav1.2KO/GFP-cycling cells was analyzed by visual observation through counting the total number of cell divisions during the complete time-lapse experiment. Values are expressed as mean ± SEM of at least four independent experiments. ***p < 0.001 versus control cells. Scale bar, 150 μm.
Discussion
L-VOCCs modulate oligodendrocyte maturation in the postnatal brain.
L-VOCCs are Ca2+ channels that open in response to plasma membrane depolarization. They are highly expressed by OPCs, but their expression is rapidly downregulated as OPCs mature (Fulton et al., 2010; Paez et al., 2010; Zhang et al., 2014; Larson et al., 2016). It has been shown that OPCs receive classical synaptic input from neurons and that neuronal activity depolarized OPCs and evoked Ca2+ influx, suggesting a recruitment of VOCCs by synaptic input (Haberlandt et al., 2011). The way in which neuronal activity depolarize OPCs to activate L-VOCCs is unknown, but it may be the result of GABAergic and glutamatergic signaling (Hamilton et al., 2010; Haberlandt et al., 2011). Alternatively, neuronal activity can result in increased extracellular K+, which can depolarize OPCs (Maldonado et al., 2013). Therefore, neuronal activity could be the main mechanism by which L-VOCCs are activated in OPCs and Ca2+ influx mediated by L-type channels a key component in glia–neuron interaction and activity-dependent myelination.
To define the involvement of L-VOCCs in OPC development, we created a conditional knock-out mouse in which the L-VOCC was postnatally deleted in NG2-positive OPCs. We found an important hypomyelination in the brain of the Cav1.2KO mouse: a decreased number of mature oligodendrocytes and myelin proteins expression was evident in several areas of the brain. The corpus callosum of Cav1.2KO animals presented an important decrease in the percentage of myelinated axons and a substantial increase in the mean g-ratio of myelinated axons. Moreover, Western blot studies revealed lower expression levels of myelin proteins in the corpus callosum, cortex, and olfactory bulb of tamoxifen-treated Cav1.2KO brains. The reduced myelination of the Cav1.2KO mice was accompanied by a significant decline in the density of Olig2-positive cells and in the total number and percentage of myelinating oligodendrocytes. No changes in the number of apoptotic oligodendrocytes and activated astrocytes or microglia was detected, suggesting that the hypomyelination found in the Cav1.2KO line is not associated with oligodendrocyte death and/or brain inflammation. Importantly, all of these changes were more pronounced in the groups treated at P4 and P10. No changes in the expression of myelin proteins or in the number of mature myelinating oligodendrocytes were detected in the brains of Cav1.2KO animals treated with tamoxifen at P30 and analyzed at P60. However, Cav1.2KO mice injected with tamoxifen at P10 and analyzed at P60 displayed a significant reduction in myelin protein expression, suggesting that the hypomyelination found in young Cav1.2KO mice is persistent throughout adulthood. These data indicates that functional L-VOCCs in early NG2 positive OPCs (P4 and P10) seems to be essential for oligodendrocyte maturation and normal myelination; however, knocking down these Ca2+ channels in late OPCs (>P30) has no effect on the myelination of the mouse brain.
These results were confirmed in the triple transgenic mouse (Cav1.2KO/GFP), in which we found that Cav1.2KO/GFP OPCs produce fewer myelinating oligodendrocytes than control progenitors. Similar to what we found in primary cultures of Cav1.2KO OPCs, Cav1.2KO/GFP cells presented an important maturational delay, with elevated proportions of immature oligodendrocytes expressing early markers such as Olig1 and NG2 and low numbers of mature CC1-positive cells. In agreement with a maturational interruption, Cav1.2KO/GFP cells also exhibited a much simpler morphology with fewer parallel processes than control GFP-positive oligodendrocytes. In summary, we have shown that L-VOCC expression can modulate OPC maturation in several areas of the postnatal brain and that Ca2+ influx mediated by L-VOCC in oligodendroglial cells is critical for normal postnatal myelination.
Interestingly, not all of the structures in the CNS were affected equally. Myelination of the optic nerve, cerebellum, and spinal cord of Cav1.2KO animals was not disturbed, suggesting that the OPCs in charge of myelinating these structures were not sensitive to L-VOCC ablation at the time points tested. The myelination of the cerebellum and the spinal cord occur early in development (Foran and Peterson, 1992). For instance, in the developing spinal cord, NG2-positive OPCs appear for the first time at embryonic day 12.5 (Lu et al., 2002; Takebayashi et al., 2002; Zhou and Anderson, 2002). Therefore, we believe that the timing of the tamoxifen treatments was not appropriated to reveal a role for L-VOCCs in these OPCs. Either having different origins or being primed by the environment where they are hosted, diverse subpopulations of OPCs have been described in different brain areas (Marques et al., 2016; Viganò and Dimou, 2016). For example, changes in the rate of OPC differentiation and proliferation have been observed between cells resident in the brain, spinal cord, and optic nerve (Kang et al., 2010; Young et al., 2013). It has been proposed that these OPC subpopulations display different cellular properties and protein profile (Marques et al., 2016; Viganò and Dimou, 2016) and express a specific variety of voltage- and ligand-gated ion channels, thereby exhibiting unique electrophysiological properties (Chittajallu et al., 2004). Therefore, it is possible that OPCs located in the optic nerve, spinal cord, and cerebellum are insensitive to Cav1.2 deletion because they do not require L-type Ca2+ influx for appropriate development in their particular environments.
Functional L-VOCCs are essential for proper OPC migration and proliferation
Previous work has revealed that nearly all NG2-positive OPCs receive classical synaptic input from neurons (Gallo et al., 2008). Because NG2 OPCs display relatively negative resting potentials and high input resistance, small synaptic inputs can cause strong depolarization of their plasma membrane (Lin and Bergles, 2004). The consequences of this depolarization are currently unclear, although it may trigger the opening of L-VOCCs (Haberlandt et al., 2011). Synaptic signaling to NG2 OPCs occurs as early as these cells are generated and this signaling is maintained while these precursor cells are proliferating and moving into the brain (Kukley et al., 2008; Ge et al., 2009). Indeed, there is evidence that the rate of division and the speed of migration can be modulated by the activation of neurotransmitter receptors on NG2 OPCs (Yuan et al., 1998; Tong et al., 2009). Therefore, it is possible that plasma membrane depolarization triggered by synaptic input modulates the migration and the proliferation of NG2 OPCs by Ca2+ influx through L-VOCCs.
Consistent with this hypothesis, we have found that functional L-type Ca2+ channels in NG2-positive cells is central for inducing and maintaining the migration and proliferation of OPCs. Time-lapse experiments performed in early postnatal brain slices showed clearly that the migration velocity of Cav1.2KO OPCs and the proportion of Cav1.2KO OPCs that undergoes cell division in the SVZ was significantly lower compared with that of the control group. We have also found that the number of proliferating oligodendrocytes (Olig2+/Ki67+) and the percentage of early OPCs (Olig2+/Sox2+) were reduced in the corpus callosum and in the cingulate cortex of the Cav1.2KO brain. This OPC propagation deficit during early postnatal development might be the reason for the decline in the amount of Olig2-positive cells in the corpus callosum, cortex, and striatum of young Cav1.2KO mice. Therefore, our results indicate that inhibition of OPC migration and proliferation, essential steps preceding myelination, could be responsible for the abnormal myelination of the Cav1.2KO brain.
How can the same Ca2+ channel regulate OPC division, movement, and maturation? L-VOCCs located in the cell body may be involved in changes in gene expression underlying progenitor proliferation and differentiation (Gallin and Greenberg, 1995). Conversely, L-VOCCs situated on OPC processes may be essential for rearrangement of cytoskeletal elements, leading to process extension and cell migration. OPC processes are highly motile and show Ca2+ elevations after minimal electrical stimulation of presynaptic neurons (Haberlandt et al., 2011). Patch-clamp recordings and Ca2+ imaging experiments have found active L-VOCCs in the processes and soma of NG2-positive progenitors (Akopian et al., 1996; Tong et al., 2009; Haberlandt et al., 2011). In the same line, a study by Kirischuk et al. (1995) demonstrated that the distribution of Ca2+ channels in OPCs is heterogeneous. The L-type channels are present primarily on the cell body, but they were also found in the processes of the cell. In oligodendrocytes, it has been proposed that voltage-gated elevations in intracellular Ca2+ cause the rearrangement of cytoskeletal elements, leading to reorganization of the oligodendrocyte membrane (Dyer and Benjamins, 1989). It has been also proposed that activation of voltage-gated Ca2+ channels in these cells may act as a signal for initiation of myelination (Kirischuk et al., 1995). It is possible that changes in L-type Ca2+ channel expression and distribution observed during oligodendrocyte development are functionally linked to the different developmental stages of myelination. Accordingly, it is probable that Cav1.2 ablation in early NG2 cells affects cell proliferation and migration, but the deletion of this Ca2+ channel in late NG2 progenitors disrupts oligodendrocyte maturation and the first steps of myelination.
In summary, the significance of this work lies in our need to obtain a better understanding of the factors that control OPC maturation to stimulate this pool of progenitors to replace myelin in diseases such as multiple sclerosis. Using the Cre-lox system to silence Ca2+ channel expression specifically in NG2-positive OPCs, we showed that voltage-dependent Ca2+ entry is essential for multiple aspects of OPC development. We have established that L-type Ca2+ channels are crucial for the adequate migration, proliferation, and maturation of NG2-positive OPCs and consequently for the myelination of the postnatal mouse brain.
Footnotes
This work was supported by the National Institute of Neurological Disorders and Stroke–National Institutes of Health (Grant 5R01NS078041) and the National Multiple Sclerosis Society (Grant RG4554-A-2). We thank Dr. Laura M. Feltri and Edward Hurley (Hunter James Kelly Research Institute at University of New York at Buffalo) for assistance with the electron microscopy experiments.
The authors declare no competing financial interests.
References
- Akopian G, Kressin K, Derouiche A, Steinhäuser C. Identified glial cells in the early postnatal mouse hippocampus display different types of Ca++ currents. Glia. 1996;17:181–194. doi: 10.1002/(SICI)1098-1136(199607)17:3<181::AID-GLIA1>3.0.CO;2-4. [DOI] [PubMed] [Google Scholar]
- Amur-Umarjee S, Phan T, Campagnoni AT. Myelin basic protein mRNA translocation in oligodendrocytes is inhibited by astrocytes in vitro. J Neurosci Res. 1993;36:99–110. doi: 10.1002/jnr.490360111. [DOI] [PubMed] [Google Scholar]
- Bahr BA, Kessler M, Rivera S, Vanderklish PW, Hall RA, Mutneja MS, Gall C, Hoffman KB. Stable maintenance of glutamate receptors and other synaptic components in long-term hippocampal slices. Hippocampus. 1995;5:425–439. doi: 10.1002/hipo.450050505. [DOI] [PubMed] [Google Scholar]
- Berger T, Schnitzer J, Orkand PM, Kettenmann H. Sodium and calcium currents in glial cells of the mouse corpus callosum slice. Eur J Neurosci. 1992;4:1271–1284. doi: 10.1111/j.1460-9568.1992.tb00153.x. [DOI] [PubMed] [Google Scholar]
- Borges K, Wolswijk G, Ohlemeyer C, Kettenmann H. Adult rat optic nerve oligodendrocyte progenitor cells express a distinct repertoire of voltage- and ligand-gated ion channels. J Neurosci Res. 1995;40:591–605. doi: 10.1002/jnr.490400504. [DOI] [PubMed] [Google Scholar]
- Cheli VT, Santiago González DA, Spreuer V, Paez PM. Voltage-gated Ca++ entry promotes oligodendrocyte progenitor cells maturation and myelination in vitro. Exp Neurol. 2015;265:69–83. doi: 10.1016/j.expneurol.2014.12.012. [DOI] [PMC free article] [PubMed] [Google Scholar]
- Chittajallu R, Aguirre A, Gallo V. NG2-positive cells in the mouse white and grey matter display distinct physiological properties. J Physiol. 2004;561:109–122. doi: 10.1113/jphysiol.2004.074252. [DOI] [PMC free article] [PubMed] [Google Scholar]
- Dawitz J, Kroon T, Hjorth JJ, Meredith RM. Functional calcium imaging in developing cortical networks. J Vis Exp. 2011;pii:3550. doi: 10.3791/3550. [DOI] [PMC free article] [PubMed] [Google Scholar]
- Dyer CA, Benjamins JA. Organization of oligodendroglial membrane sheets: II. Galactocerebroside:antibody interactions signal changes in cytoskeleton and myelin basic protein. J Neurosci Res. 1989;24:212–221. doi: 10.1002/jnr.490240212. [DOI] [PubMed] [Google Scholar]
- Ertel EA, Campbell KP, Harpold MM, Hofmann F, Mori Y, Perez-Reyes E, Schwartz A, Snutch TP, Tanabe T, Birnbaumer L, Tsien RW, Catterall WA. Nomenclature of voltage-gated calcium channels. Neuron. 2000;25:533–535. doi: 10.1016/S0896-6273(00)81057-0. [DOI] [PubMed] [Google Scholar]
- Foran DR, Peterson AC. Myelin acquisition in the central nervous system of the mouse revealed by an MBP-Lac Z transgene. J Neurosci. 1992;12:4890–4897. doi: 10.1523/JNEUROSCI.12-12-04890.1992. [DOI] [PMC free article] [PubMed] [Google Scholar]
- Fulton D, Paez PM, Fisher R, Handley V, Colwell CS, Campagnoni AT. Regulation of L-type Ca++ currents and process mophology in white matter oligodendrocyte precursor cells by golli-myelin proteins. Glia. 2010;58:1292–1303. doi: 10.1002/glia.21008. [DOI] [PubMed] [Google Scholar]
- Gallin WJ, Greenberg ME. Calcium regulation of gene expression in neurons: the mode of entry matters. Curr Opin Neurobiol. 1995;5:367–374. doi: 10.1016/0959-4388(95)80050-6. [DOI] [PubMed] [Google Scholar]
- Gallo V, Mangin JM, Kukley M, Dietrich D. Synapses on NG2-expressing progenitors in the brain: multiple functions? J Physiol. 2008;586:3767–3781. doi: 10.1113/jphysiol.2008.158436. [DOI] [PMC free article] [PubMed] [Google Scholar]
- Ge WP, Zhou W, Luo Q, Jan LY, Jan YN. Dividing glial cells maintain differentiated properties including complex morphology and functional synapses. Proc Natl Acad Sci U S A. 2009;106:328–333. doi: 10.1073/pnas.0811353106. [DOI] [PMC free article] [PubMed] [Google Scholar]
- Ghiani CA, Starcevic M, Rodriguez-Fernandez IA, Nazarian R, Cheli VT, Chan LN, Malvar JS, de Vellis J, Sabatti C, Dell'Angelica EC. The dysbindin-containing complex (BLOC-1) in brain: developmental regulation, interaction with SNARE proteins and role in neurite outgrowth. Mol Psychiatry. 2010;15:204–215. doi: 10.1038/mp.2009.58. [DOI] [PMC free article] [PubMed] [Google Scholar]
- Grynkiewicz G, Poenie M, Tsien RY. A new generation of Ca2+ indicators with greatly improved fluorescence properties. J Biol Chem. 1985;260:3440–3450. [PubMed] [Google Scholar]
- Haberlandt C, Derouiche A, Wyczynski A, Haseleu J, Pohle J, Karram K, Trotter J, Seifert G, Frotscher M, Steinhäuser C, Jabs R. Gray matter NG2 cells display multiple Ca++-signaling pathways and highly motile processes. PLoS One. 2011;6:e17575. doi: 10.1371/journal.pone.0017575. [DOI] [PMC free article] [PubMed] [Google Scholar]
- Hamilton N, Vayro S, Wigley R, Butt AM. Axons and astrocytes release ATP and glutamate to evoke calcium signals in NG2-glia. Glia. 2010;58:66–79. doi: 10.1002/glia.20902. [DOI] [PubMed] [Google Scholar]
- Hell JW, Westenbroek RE, Warner C, Ahlijanian MK, Prystay W, Gilbert MM, Snutch TP, Catterall WA. Identification and differential subcellular localization of the neuronal class C and class D L-type calcium channel alpha 1 subunits. J Cell Biol. 1993;123:949–962. doi: 10.1083/jcb.123.4.949. [DOI] [PMC free article] [PubMed] [Google Scholar]
- Jacobs EC, Pribyl TM, Feng JM, Kampf K, Spreur V, Campagnoni C, Colwell CS, Reyes SD, Martin M, Handley V, Hiltner TD, Readhead C, Jacobs RE, Messing A, Fisher RS, Campagnoni AT. Region-specific myelin pathology in mice lacking the golli products of the myelin basic protein gene. J Neurosci. 2005;25:7004–7013. doi: 10.1523/JNEUROSCI.0288-05.2005. [DOI] [PMC free article] [PubMed] [Google Scholar]
- Kang SH, Fukaya M, Yang JK, Rothstein JD, Bergles DE. NG2+ CNS glial progenitors remain committed to the oligodendrocyte lineage in postnatal life and following neurodegeneration. Neuron. 2010;68:668–681. doi: 10.1016/j.neuron.2010.09.009. [DOI] [PMC free article] [PubMed] [Google Scholar]
- Kirischuk S, Scherer J, Möller T, Verkhratsky A, Kettenmann H. Subcellular heterogeneity of voltage-gated Ca2+ channels in cells of the oligodendrocyte lineage. Glia. 1995;13:1–12. doi: 10.1002/glia.440130102. [DOI] [PubMed] [Google Scholar]
- Kukley M, Kiladze M, Tognatta R, Hans M, Swandulla D, Schramm J, Dietrich D. Glial cells are born with synapses. FASEB J. 2008;22:2957–2969. doi: 10.1096/fj.07-090985. [DOI] [PubMed] [Google Scholar]
- Larson VA, Zhang Y, Bergles DE. Electrophysiological properties of NG2+ cells: matching physiological studies with gene expression profiles. Brain Res. 2016;1638:138–160. doi: 10.1016/j.brainres.2015.09.010. [DOI] [PMC free article] [PubMed] [Google Scholar]
- Lin SC, Bergles DE. Synaptic signaling between GABAergic interneurons and oligodendrocyte precursor cells in the hippocampus. Nat Neurosci. 2004;7:24–32. doi: 10.1038/nn1162. [DOI] [PubMed] [Google Scholar]
- Lu QR, Sun T, Zhu Z, Ma N, Garcia M, Stiles CD, Rowitch DH. Common developmental requirement for Olig function indicates a motor neuron/oligodendrocyte connection. Cell. 2002;109:75–86. doi: 10.1016/S0092-8674(02)00678-5. [DOI] [PubMed] [Google Scholar]
- Maldonado PP, Vélez-Fort M, Levavasseur F, Angulo MC. Oligodendrocyte precursor cells are accurate sensors of local K+ in mature gray matter. J Neurosci. 2013;33:2432–2442. doi: 10.1523/JNEUROSCI.1961-12.2013. [DOI] [PMC free article] [PubMed] [Google Scholar]
- Marques S, et al. Oligodendrocyte heterogeneity in the mouse juvenile and adult central nervous system. Science. 2016;352:1326–1329. doi: 10.1126/science.aaf6463. [DOI] [PMC free article] [PubMed] [Google Scholar]
- Paez PM, Spreuer V, Handley V, Feng JM, Campagnoni C, Campagnoni AT. Increased expression of golli myelin basic proteins enhances calcium influx into oligodendroglial cells. J Neurosci. 2007;27:12690–12699. doi: 10.1523/JNEUROSCI.2381-07.2007. [DOI] [PMC free article] [PubMed] [Google Scholar]
- Paez PM, Fulton DJ, Spreuer V, Handley V, Campagnoni CW, Macklin WB, Colwell C, Campagnoni AT. Golli myelin basic proteins regulate oligodendroglial progenitor cell migration through voltage-gated Ca++ influx. J Neurosci. 2009a;29:6663–6676. doi: 10.1523/JNEUROSCI.5806-08.2009. [DOI] [PMC free article] [PubMed] [Google Scholar]
- Paez PM, Fulton DJ, Spreur V, Handley V, Campagnoni CW, Campagnoni AT. Regulation of store-operated and voltage-operated Ca++ channels in the proliferation and death of oligodendrocyte precursor cells by Golli proteins. ASN Neuro. 2009b;1:e00003. doi: 10.1042/AN20090003. pii. [DOI] [PMC free article] [PubMed] [Google Scholar]
- Paez PM, Fulton DJ, Spreur V, Handley V, Campagnoni AT. Multiple kinase pathways regulate voltage-dependent Ca++ influx and migration in oligodendrocyte precursor cells. J Neurosci. 2010;30:6422–6433. doi: 10.1523/JNEUROSCI.5086-09.2010. [DOI] [PMC free article] [PubMed] [Google Scholar]
- Paez PM, Fulton D, Spreuer V, Handley V, Campagnoni AT. Modulation of canonical transient receptor potential channel 1 in the proliferation of oligodendrocyte precursor cells by the golli products of the myelin basic protein gene. J Neurosci. 2011;31:3625–3637. doi: 10.1523/JNEUROSCI.4424-10.2011. [DOI] [PMC free article] [PubMed] [Google Scholar]
- Platzer J, Engel J, Schrott-Fischer A, Stephan K, Bova S, Chen H, Zheng H, Striessnig J. Congenital deafness and sinoatrial node dysfunction in mice lacking class D L-type Ca++ channels. Cell. 2000;102:89–97. doi: 10.1016/S0092-8674(00)00013-1. [DOI] [PubMed] [Google Scholar]
- Rajadhyaksha A, Barczak A, Macías W, Leveque JC, Lewis SE, Konradi C. L-type Ca++ channels are essential for glutamate-mediated creb phosphorylation and C-Fos gene expression in striatal neurons. J Neurosci. 1999;19:6348–6359. doi: 10.1523/JNEUROSCI.19-15-06348.1999. [DOI] [PMC free article] [PubMed] [Google Scholar]
- Reyes SD, Campagnoni AT. Two separate domains in the golli myelin basic proteins are responsible for nuclear targeting and process extension in transfected cells. J Neurosci Res. 2002;69:587–596. doi: 10.1002/jnr.10319. [DOI] [PubMed] [Google Scholar]
- Sperber BR, McMorris FA. Fyn tyrosine kinase regulates oligodendroglial cell development but is not required for morphological differentiation of oligodendrocytes. J Neurosci Res. 2001;63:303–312. doi: 10.1002/1097-4547(20010215)63:4%3C303::AID-JNR1024%3E3.0.CO;2-A. [DOI] [PubMed] [Google Scholar]
- Suzumura A, Bhat S, Eccleston PA, Lisak RP, Silberberg DH. The isolation and long-term culture of oligodendrocytes from newborn mouse brain. Brain Res. 1984;324:379–383. doi: 10.1016/0006-8993(84)90054-4. [DOI] [PubMed] [Google Scholar]
- Takebayashi H, Nabeshima Y, Yoshida S, Chisaka O, Ikenaka K, Nabeshima Y. The basic helix-loop-helix factor Olig2 is essential for the development of motoneuron and oligodendrocyte lineages. Curr Biol. 2002;12:1157–1163. doi: 10.1016/S0960-9822(02)00926-0. [DOI] [PubMed] [Google Scholar]
- Tong XP, Li XY, Zhou B, Shen W, Zhang ZJ, Xu TL, Duan S. Ca++ signaling evoked by activation of Na+ channels and Na+/Ca++ exchangers is required for GABA-induced NG2 cell migration. J Cell Biol. 2009;186:113–128. doi: 10.1083/jcb.200811071. [DOI] [PMC free article] [PubMed] [Google Scholar]
- Verkhratsky AN, Trotter J, Kettenmann H. Cultured glial precursor cells from mousecortex express two types of calcium currents. Neurosci Lett. 1990;112:194–198. doi: 10.1016/0304-3940(90)90202-K. [DOI] [PubMed] [Google Scholar]
- Viganò F, Dimou L. The heterogeneous nature of NG2-glia. Brain Res. 2016;1638:129–137. doi: 10.1016/j.brainres.2015.09.012. [DOI] [PubMed] [Google Scholar]
- von Blankenfeld Gv, Verkhratsky AN, Kettenmann H. Ca++ channel expression in the oligodendrocyte lineage. Eur J Neurosci. 1992;4:1035–1048. doi: 10.1111/j.1460-9568.1992.tb00130.x. [DOI] [PubMed] [Google Scholar]
- White JA, McKinney BC, John MC, Powers PA, Kamp TJ, Murphy GG. Conditional forebrain deletion of the L-type calcium channel CaV1.2 disrupts remote spatial memories in mice. Learn Mem. 2008;15:1–5. doi: 10.1101/lm.773208. [DOI] [PubMed] [Google Scholar]
- Young KM, Psachoulia K, Tripathi RB, Dunn SJ, Cossell L, Attwell D, Tohyama K, Richardson WD. Oligodendrocyte dynamics in the healthy adult CNS: evidence for myelin remodeling. Neuron. 2013;77:873–885. doi: 10.1016/j.neuron.2013.01.006. [DOI] [PMC free article] [PubMed] [Google Scholar]
- Yuan X, Eisen AM, McBain CJ, Gallo V. A role for glutamate and its receptors in the regulation of oligodendrocyte development in cerebellar tissue slices. Development. 1998;125:2901–2914. doi: 10.1242/dev.125.15.2901. [DOI] [PubMed] [Google Scholar]
- Zhang Y, Chen K, Sloan SA, Bennett ML, Scholze AR, O'Keeffe S, Phatnani HP, Guarnieri P, Caneda C, Ruderisch N, Deng S, Liddelow SA, Zhang C, Daneman R, Maniatis T, Barres BA, Wu JQ. An RNA-sequencing transcriptome and splicing database of glia, neurons, and vascular cells of the cerebral cortex. J Neurosci. 2014;34:11929–11947. doi: 10.1523/JNEUROSCI.1860-14.2014. [DOI] [PMC free article] [PubMed] [Google Scholar]
- Zhou Q, Anderson DJ. The bHLH transcription factors OLIG2 and OLIG1 couple neuronal and glial subtype specification. Cell. 2002;109:61–73. doi: 10.1016/S0092-8674(02)00677-3. [DOI] [PubMed] [Google Scholar]
- Zhu X, Hill RA, Dietrich D, Komitova M, Suzuki R, Nishiyama A. Age-dependent fate and lineage restriction of single NG2 cells. Development. 2011;138:745–753. doi: 10.1242/dev.047951. [DOI] [PMC free article] [PubMed] [Google Scholar]