

Abstract
Asymmetry in the form of left-hemisphere lateralization is a striking characteristic of the cerebral regions involved in the adult language network. In this study, we leverage a large sample of typically developing human infants with longitudinal resting-state functional magnetic resonance imaging scans to delineate the trajectory of interhemispheric functional asymmetry in language-related regions during the first 2 years of life. We derived the trajectory of interhemispheric functional symmetry of the inferior frontal gyrus (IFG) and superior temporal gyrus (STG), the sensory and visual cortices, and two higher-order regions within the intraparietal sulcus and dorsolateral prefrontal cortex. Longitudinal models revealed a best fit with quadratic age terms and showed significant estimated coefficients of determination for both the IFG (r2 = 0.261, p < 0.001) and the STG (r2 = 0.142, p < 0.001) regions while all other regions were best modeled by log-linear increases. These inverse-U-shaped functions of the language regions peaked at ∼11.5 months of age, indicating that a transition toward asymmetry began in the second year. This shift was accompanied by an increase in the functional connectivity of these regions within the left hemisphere. Finally, we detected an association between the trajectory of the IFG and language outcomes at 4 years of age (χ2 = 10.986, p = 0.011). Our results capture the developmental timeline of the transition toward interhemispheric functional asymmetry during the first 2 years of life. More generally, our findings suggest that increasing interhemispheric functional symmetry in the first year might be a general principle of the developing brain, governing different functional systems, including those that will eventually become lateralized in adulthood.
SIGNIFICANCE STATEMENT Cross-sectional studies of the language system in early infancy suggest that the basic neural mechanisms are in place even before birth. This study represents the first of its kind, using a large longitudinal sample of infants, to delineate the early language-related transition toward interhemispheric functional asymmetry in the brain using resting-state functional MRI. More generally, our findings suggest that increasing interhemispheric functional symmetry in the first year might be a general principle of the developing brain governing multiple functional systems, including those that will eventually become lateralized in adulthood. Although resting-state functional MRI cannot provide direct insights into the developmental mechanisms of language lateralization, this study reveals language-related functional connectivity changes during infancy, marking critical points in the development of the brain's functional architecture.
Keywords: cognitive development, functional asymmetry, functional connectivity, infancy, language network
Introduction
Language is a hallmark of human cognition. Infants begin developing language skills immediately upon arrival into their native language environment. Simultaneously, each infant's brain undergoes substantial changes to its functional organization as the infant grows in his or her capacity to perceive, move, think, and communicate. One of the predominant organizational patterns in this developmental transition is the lateralization of certain functional systems, particularly language. Studies in adults have shown that some systems, like primary sensory systems, require fine-tuned integration between the hemispheres while other higher-order functions, like language, typically show asymmetry (Binder et al., 2000; Toga and Thompson, 2003; Friederici and Alter, 2004; Stark et al., 2008; Perani et al., 2011); however, little is known about how and when this process unfolds during development.
In infants, task-based functional magnetic resonance imaging (fMRI) studies suggest that language is functionally supported by an adult-like network of neural regions, including regions of the inferior frontal gyrus (IFG) and the superior temporal gyrus (STG) known as Broca's and Wernicke's areas, respectively (Dehaene-Lambertz et al., 2002). Further task-based fMRI (Dehaene-Lambertz et al., 2002; Perani et al., 2011; Sato et al., 2012; Shultz et al., 2014) and optical imaging (Peña et al., 2003; May et al., 2011) studies with infants revealed both bilateral and left-lateralized patterns of activation to normal speech. These studies suggest that while the brain regions involved in language are functional very early in development, the language system at birth might be more bilateral and symmetrically organized than in its adult-like form.
A complementary way to study this symmetry is to use resting-state fMRI to measure the brain's functional connectivity in infants during natural sleep (Damoiseaux et al., 2006; van den Heuvel et al., 2008; Fransson et al., 2009; Gao et al., 2009a,b, 2013, 2015a,b, 2016). When interhemispheric functional connections were studied in utero, both Broca's and Wernicke's regions showed very weak interhemispheric symmetry (Thomason et al., 2013). In contrast, a cross-sectional study with 2-d-old infants reported relatively strong interhemispheric functional connectivity between the left and the right hemispheres within language-related regions (Perani et al., 2011). In an identical analysis with adults, the pattern shifted away from strong interhemispheric functional connections and toward a strong coupling of these regions within the same hemisphere (Lohmann et al., 2010). Finally, research that studied functional asymmetry with functional connectivity measures over a much longer age period supports the idea that the majority of language-related lateralization occurs before the age of 7 years in typical individuals (Zuo et al., 2010; Nielsen et al., 2013). While there are technical limitations to studying the fetal brain, the overall pattern indicated by these studies is that neither the IFG nor STG likely show strong interhemispheric connections before birth (Doria et al., 2010; Thomason et al., 2013), but exhibit a strong interhemispheric connectivity when measured immediately after birth (Perani et al., 2011) and then shift back toward asymmetry during early development (Nielsen et al., 2013). These studies lead to the hypothesis that the temporal trajectory of functional synchrony of bilateral language areas should follow an inverse-U pattern of development: an initial increase in interhemispheric connectivity followed by a postnatal decrease. Moreover, language-related areas within the same hemisphere should show an increase in their functional connectivity over the course of development.
To test these hypotheses and uncover the potential turning point of interhemispheric functional connectivity in the development of language-related regions, we examined longitudinal trajectories of interhemispheric functional connectivity during the first 2 years of life. Specifically, we compared the developmental trajectory of interhemispheric functional connectivity in language-related regions to somatosensory, visual, prefrontal, and intraparietal cortices, predicting that the strength of interhemispheric connectivity between language-related regions would show a unique inverse-U pattern with age. Second, we assessed the trajectory of functional connectivity between language-related regions within the left hemisphere, testing the hypothesis that their functional connection would strengthen in the first 2 years. Finally, we tested the association between the longitudinal trajectories of functional symmetry and preschool language outcomes.
Materials and Methods
Participants
A total of 71 (37 female and 34 male) healthy full-term infants were recruited to be longitudinally imaged at 1, 3, 6, 9, 12, 18, and 24 months of age. Only healthy subjects with gestational age of 35–42 weeks, appropriate weight for gestational age, and the absence of major pregnancy and delivery complications were included in the study. Criterion for exclusion included maternal pre-eclampsia, placental abruption, neonatal hypoxia (i.e., 10 min Apgar score, <5), neonatal illness requiring neonatal intensive care unit stay >2 d, maternal HIV status, maternal alcohol or illegal drug use during pregnancy, chromosomal or major congenital abnormality, abnormality seen in MR imaging, significant medical illness, or developmental delay at 1 or 2 year pediatric well-child visits. Informed consent was obtained from the parents of all participants and the experimental protocols were approved by the Institutional Review Board at the University of North Carolina at Chapel Hill. Before imaging, subjects were fed, swaddled, and fitted with ear protection. All subjects were in a natural sleep during the imaging session.
Image acquisition
All images were acquired using a 3 T MR scanner (Siemens Medical Systems) housed in the Biomedical Research Imaging Center. All fMRI data were acquired using a T2*-weighted EPI sequence: time repetition (TR) = 2 s, time echo (TE) = 32 ms, 33 slices, voxel size of 4 × 4 × 4 mm3. One hundred and fifty volumes were acquired in 5 min. To provide anatomical reference, structural images were acquired using a 3D magnetization prepared rapid acquisition gradient-recalled echo sequence (TR = 1820 ms; TE = 4.38 ms; inversion time, 1100 ms), with a voxel size of 1 × 1 × 1 mm3.
Preprocessing
Functional data were preprocessed using Oxford Centre for Functional MRI of the Brain's (FMRIB's) Software Library (FSL, v 4.1.9; Smith et al., 2004). The preprocessing steps included discarding the first 10 volumes, slice timing correction, motion correction, and high-pass (>0.01 Hz) and low-pass filtering (<0.08 Hz). Masks for CSF and white matter were eroded from images produced using FSL's FAST (FMRIB's Automated Segmentation Tool) algorithm and inspected visually. Mean signal from white matter, CSF, whole brain, and six motion parameters were removed using linear regression. To further reduce the effect of motion on functional connectivity measures, the “scrubbing” approach of controlling the global measure of signal change (0.5%) and frame-wise displacement (0.5 mm) was performed as proposed by Power et al. (2012). Individual subject scans with >40% of volumes (i.e., 60 volumes) removed from the scrubbing procedure were excluded from subsequent analyses. No spatial smoothing was applied. This criterion for exclusion because of motion follows standardized procedures outlined in previous studies (Gao et al., 2011; 2013; Power et al., 2012; Alcauter et al., 2014). After excluding data with excessive motion, a total of 223 scans were included in the analysis. The numbers of subjects contributing data at each age point as well as the number of subjects that contributed longitudinal data are shown in Table 1.
Table 1.
Number of subjects in each age group and contributing longitudinal dataa
| Age group (months) | Number of scans | Volumes dropped |
Longitudinal data points | Number of subjects | |
|---|---|---|---|---|---|
| Mean | SD | ||||
| 1 | 52 | 128.9 | 12.6 | 1 | 18 |
| 3 | 35 | 129.7 | 13.8 | 2 | 13 |
| 6 | 30 | 132 | 12.9 | 3 | 11 |
| 9 | 29 | 132.7 | 9.1 | 4 | 9 |
| 12 | 36 | 134.5 | 10.7 | 5 | 9 |
| 18 | 23 | 133.1 | 9.7 | 6 | 5 |
| 24 | 18 | 136.2 | 7.9 | 7 | 5 |
aThe number of subjects that contributed data at each time is shown on the left as well as the average and SD for the number of included frames for each group. The number of subjects contributing multiple datasets is shown on the right.
For registration, a single subject that completed a scan at every time point was chosen to provide an anatomical age-specific template for each age group. Within each age group, after an initial rigid alignment between functional data and the T1 high-resolution structural images, a nonlinear transformation field was obtained from the individual T1 images to the age-specific template using FSL. An identical series of transformations were applied to each functional volume, allowing for accurate registration with each age group. Across age groups, a 4D hierarchical attribute matching mechanism for elastic registration (HAMMER) nonlinear registration (Shen and Davatzikos, 2002, 2004) approach was applied to obtain the transformation field from each time point to the final time point and finally to the MNI template. This approach was selected to leverage the inherent correlations among a series of structural images from the same subject to maximize registration accuracy. Our region-of-interest (ROI) coordinates were then back-transformed from standard space (MNI) to our age-specific templates based on the transformation field obtained using 4D HAMMER as previously described, which allowed for the optimal transformation by using a single subject's longitudinal information to increase the accuracy of the transformation. After obtaining age-specific ROIs, the average time course was extracted from each region and for each subject.
ROI selection and time series extraction
Seed ROIs were defined from a mixture of coordinates found in previous studies related to language (Lohmann et al., 2010; Perani et al., 2011), working memory (Barbey et al., 2013), and numerical processing (Emerson and Cantlon, 2012), and from the Automated Anatomical Labeling template. For each of the language-related coordinates, a 5 mm sphere was created around each point to define a region representing the right and left IFG (±55, 22, 14) and STG (±57, −44, 5). These two specific regions, residing approximately in the Broca's and Wernicke's area, show consistent language-related activity in both infants and adults (Dehaene-Lambertz et al., 2002; Lohmann et al., 2010; Perani et al., 2011). Furthermore, these coordinates specifically represent two specific regions from a network of language-related regions that activate independent of experiment-specific variations in adults (Lohmann et al., 2010). As comparison regions, we created additional bilateral 5 mm spherical ROIs for regions involved in numerical processing in the intraparietal sulcus (41, −38, 42; −46, −47, 33), working memory in the dorsolateral prefrontal cortex (PFC; ±40, 34, 29), early visual processing in the lingual gyrus (±16, 87, −11), and somatosensory regions in the postcentral gyrus (±58, −9, 36; Fig. 1). These ROIs were then back-transformed from standard space (MNI) to our age-specific templates based on the transformation field obtained using 4D HAMMER as described above, which allowed for the most precise mapping of adult regions onto the individual age templates. For each age template, we performed a visual inspection of the back-projected ROI to ensure that the transformation did not project to a space outside the cortex (Fig. 1).
Figure 1.
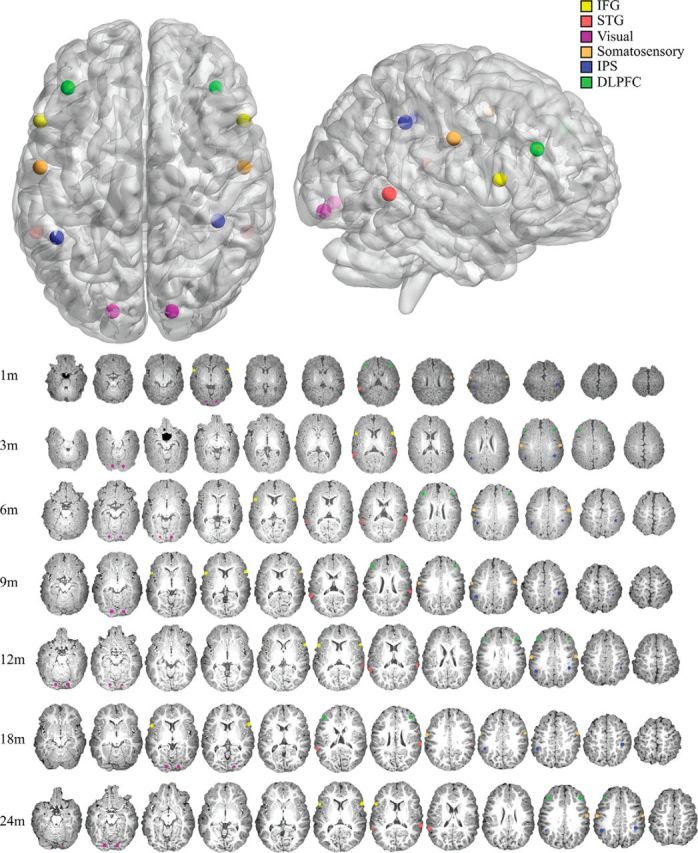
ROIs on an MNI template brain. The spherical ROIs used in the analysis are projected onto an MNI template brain. These regions include language-related regions in the inferior frontal gyrus (IFG; yellow) and the superior temporal gyrus (STG; red). Additionally, the lingual gyrus (purple), the somatosensory regions (orange), the intraparietal sulcus (IPS; blue), and the dorsolateral prefrontal cortex (DLPFC; green) are shown. The longitudinal registrations of these regions to each age-specific template are also displayed in a matching color scheme.
After obtaining age-specific ROIs, the average time course was extracted from each region and for each subject. For each individual, time courses were correlated between each seed and the resulting r values were Fisher's z transformed before further analysis. Interhemispheric connectivity was defined as the connectivity between each bilateral pair of regions at each time point.
Statistical modeling and analysis
For data analysis, we used Linear Mixed Models performed in R v2.15.3 (Pinheiro et al., 2007) by using nlme (R package v.3.1–108) to perform the model selection. We estimated the best model for age by comparing different models with increasing complexity in the age term (linear, log-linear, quadratic, etc.) and creating a random effect for each added term. To allow for the longitudinal design, each subject was modeled with a random intercept and with a random slope for age. Fixed effects included the age term(s). Models were fitted by maximum likelihood, adjusted by restricted maximum likelihood, and compared by the ANOVA function. The best model was determined by selecting the age function with the lowest log-likelihood and Akaike information criterion (AIC) values.
We calculated the effect sizes for each model following Nakagawa and Schielzeth (2013) and Johnson (2014) using R (http://jonlefcheck.net/2013/03/13/r2-for-linear-mixed-effects-models). Two coefficients of determination values were reported. First, the squared correlation between predicted and observed values (r2), for which p values were reported with the degrees of freedom equal to the number of predicted values minus two. Second, we reported the conditional R2 (R(c)2), which describes the proportion of variance explained by both the fixed and random factors. The peak of the second-order functions was calculated as the point where the function's derivative was equal to zero.
Relationship with language outcomes
To test how the trajectory of functional lateralization relates to behavioral language outcomes, language scores were tested at 4 years of age for a subset of the original group of participants. In total, 23 children were able to return and were assessed using the Mullen Scales of Early Learning (Mullen, 1995). This assessment provides a measurement of visual reception, gross/fine motor skill, and both expressive and receptive language scores. We used these scores to calculate each child's individual developmental quotient (DQ) for language (combined expressive and receptive), as well as their DQ for visual reception to serve as a control. The DQ score is a ratio of the functional age to the chronological age and is calculated as the average of the age-equivalent scores divided by chronological age. We then added the language outcomes terms to the linear mixed-effects models of functional symmetry for each region and used χ2 tests to determine whether language outcomes had a significant effect on these longitudinal trajectories. χ2 Tests determine the cumulative effect of the main effect and interactions of the language terms on the longitudinal trajectory. To visualize these effects, the estimated trajectory for ±SD in the language score is plotted in Figure 5. Similarly, we added language outcomes to the longitudinal models of ipsilateral connectivity between the IFG and STG (language), the IPS-PFC (higher order), and the somatosensory-visual (primary sensory) regions. The total effect of the addition of language terms was determined with χ2 tests.
Figure 5.

The association between the developmental trajectory of symmetric connectivity and language outcomes in the IFG. Each point represents the symmetrical connectivity strength for an individual at a specific age. The black line represents the trajectory predicted by an average language score. The green line represents the trajectory predicted with a language score 1 SD above the mean, while the red line represents 1 SD below the mean. The age of peak for each estimated curve is as follows: average (black), 665 d; high (green), 650 d; low (red), 686 d.
Control analyses
To ensure that our results were not due to nuisance variables, we included a more stringent secondary analysis to control for possible effects of motion and of signals from white matter/CSF, and for differences in number of functional volumes contributing to the data. Furthermore, we bandpass filtered the nuisance regressors to ensure that our results were not the product of reintroducing any high-frequency nuisance-related fluctuations. The primary analyses (described above) were repeated after controlling for the potential confounds detailed below. To address a possible confound of the longitudinal change in spatial distance of each region, we modeled the distance of each region and its homolog for each age template. To do this we calculated the distance from the center point of each region and its homolog for each age template (1, 3, 6, 9, 12, 18, 24 months) and added these values to the longitudinal models as a main effect and interaction with age. The total effects of these distance terms were calculated with χ2 tests.
Motion.
Motion was first corrected using standard motion correction procedures in FSL (Smith et al., 2004). To further reduce the effect of motion on functional connectivity measures, the “scrubbing” approach of controlling the global measure of signal change (0.5%) and frame-wise displacement (0.5 mm) was performed as proposed by Power et al. (2012). As a further control for the effects of motion, the first derivative of the realignment parameters was calculated and removed from the data using linear regression (Patel et al., 2014).
White matter/CSF principal component analysis regression.
While scrubbing is typically used to control for the effects of motion (Power et al., 2012), there is evidence that principal component analysis (PCA) can also be an effective tool (Muschelli et al., 2014); however, there is some debate about which process is most appropriate (Power et al., 2014, 2015). To ensure that our results do not depend on methodology, we repeated our analysis adding the PCA regression technique. Using segmented images from FSL, each functional run was masked for white matter and CFS. To ensure inclusion of the specific tissue type, an eroded ventricular mask for the CSF signal and an eroded white matter mask for the white matter signal were used. For each functional run, a PCA was completed on the time courses extracted from voxels identified as white matter and CSF separately. Using linear regression, the top three components for each of these nuisance variables were removed from the functional data.
Bandpass filtering of nuisance factors.
Several research groups argue that the frequency content of nuisance regressors needs to match the frequency content of the data undergoing regression (Hallquist et al., 2013; Jo et al., 2013, Patel et al., 2014). To ensure that our results were not due to the reintroduction of high-frequency motion-related fluctuations, we bandpass filtered all the nuisance regressors with the same parameters as the functional data (high pass, >0.01 Hz; low pass, <0.08 Hz).
Mean framewise displacement and total volume correction.
A one-way ANOVA was calculated to determine whether mean framewise displacement or the number of volumes dropped differed by age group.
Results
Functional symmetry
Mean interhemispheric functional symmetry by age group (in months) is shown in Figure 2. Overall, the pattern of language-related regions shows an increase in the first year, followed by a decrease in the second year. For other higher-order and sensory regions tested, the pattern is predominantly an increase over the first that is sustained in the second year.
Figure 2.

Average symmetrical connectivity strength for each age group. Average symmetrical connectivity strength is shown for each age group, separated by months since birth. Blue bars represent the first year, followed by the second year shown in green. A total of 223 subject data points are represented. SE bars are shown.
The longitudinal symmetrical connectivity values of both the IFG and STG were best fit by quadratic age terms (Table 2). Specifically, these growth curves revealed an increase in the first year with a peak at ∼11.5 months old (619 and 628 gestational days), followed by a decrease in the second year (Fig. 3A). The IFG showed a significant estimated coefficient of determination (r(222)2 = 0.142, p < 0.001; R(c)(70)2 = 0.185). Similarly, the STG showed a significant estimated coefficient of determination (r(222)2 = 0.261, p < 0.001; R(c)(70)2 = 0.262). While these regions did not show a difference in the timing of their peak symmetry (t(70) = 0.362, p = 0.92), the STG showed a significantly higher magnitude of functional symmetry at its peak (t(70) = 2.51, p = 0.014). Furthermore, there was a significant correlation between individual's time-to-peak symmetry between these two regions (r(222) = 0.298, p = 0.011), meaning children who showed an earlier peak in the IFG generally also showed an earlier peak in the STG.
Table 2.
Longitudinal model selection criteria for the primary analysisa
| Log-likelihood |
AIC |
|||||
|---|---|---|---|---|---|---|
| Linear | Log-Linear | Quadratic | Linear | Log-linear | Quadratic | |
| Symmetrical connectivity strength | ||||||
| IFG | −94.592 | −90.628 | −79.44b | 199.18 | 191.26 | 172.88b |
| STG | −98.148 | −101.354 | −68.376b | 206.3 | 216.71 | 150.75b |
| Visual | −91.07 | −82.188b | −92.711 | 192.14 | 174.38b | 179.42 |
| Sensory | −94.386 | −74.543b | −86.032 | 198.77 | 163.09b | 182.06 |
| Intraparietal sulcus | −57.60 | −52.83b | −55.08 | 125.26 | 115.66b | 124.27 |
| Dorsolateral prefrontal cortex | −93.10 | −91.12b | −92.00 | 196.21 | 194.00b | 196.25 |
| Ipsilateral language regions connectivity | ||||||
| Left | −58.909 | −57.782b | −67.833 | 127.82 | 125.56b | 129.47 |
| Right | −50.745 | −50.48b | −51.481 | 111.49 | 110.96b | 114.96 |
aLog-likelihood and AIC values for each model are shown.
bBest model fit for each set of regions.
Figure 3.
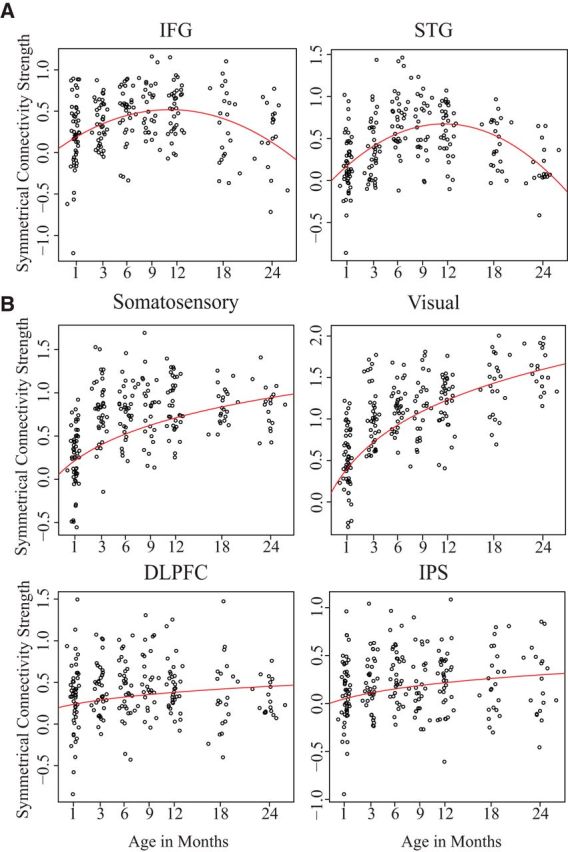
Longitudinal growth curves of symmetric connectivity strength. A, B, Red lines indicate the fitted curve of the best model for language-related regions (A), primary somatosensory and visual regions (B), and the dorsolateral prefrontal cortex (DLPFC) and intraparietal sulcus (IPS; B). Age shows months since birth. A total of 223 subject data points are represented for each region. Symmetrical Connectivity Strength is represented by the fisher-z transformed correlations between homologue regions.
In contrast, the two control higher-order and sensory regions showed the best fit with log-linear age terms (Table 2; Fig. 3B). Log-linear models produced significant estimated coefficients of determination for the PFC (r(222)2 = 0.507, p < 0.001; R(c)(70)2 = 0.511), IPS (r(222)2 = 0.598, p < 0.001; R(c)(70)2 = 0.522), visual (r(222)2 = 0.450, p < 0.001; R(c)(70)2 = 0.452), and somatosensory (r(222)2 = 0.217, p < 0.001; R(c)(70)2 = 0.213) cortices. Each model's log-likelihood and AIC values are shown in Table 2.
We see a significant positive age correlation between ipsilateral language-related regions (left, r(222) = 0.288, p < 0.001; right, r(222) = 0.303, p < 0.001), a marginal correlation with age for the other higher-order regions (left, r(222) = 0.126, p = 0.061; right, r(222) = 0.121, p = 0.069), and a negative correlation with age between sensory regions (left, r(222) = −0.205, p < 0.001; right: r(222) = −0.172, p < 0.01). This suggests that the increase between language-related ipsilateral regions is not a general effect of the entire ipsilateral hemisphere's development. The connectivity between the ipsilateral IFG and STG showed a pattern of increasing strength that was best modeled by a log-linear function for both right (r(222)2 = 0.142, p < 0.001; R(c)(70)2 = 0.143) and left (r(222)2 = 0.097, p < 0.001; R(c)(70)2 = 0.098) hemispheres (Fig. 4) and showed a significant log-linear increase with age in the left hemisphere for both the left (β = 0.31, p < 0.001) and right (β = 0.24, p < 0.001) hemispheres.
Figure 4.

Intrahemispheric connectivity between the left IFG and STG. Connectivity between the IFG and STG increases in a log-linear fashion over the first 2 years. A total of 223 subject data points are represented.
Relationship with language outcomes
For the IFG, we found that language outcomes showed a significant main effect (p = 0.018) and marginal interaction effects with both linear (p = 0.072) and quadratic (p = 0.091) age terms. A χ2 test revealed that the overall effect of the language terms was significant (χ(2)2 = 10.986, p = 0.011). This analysis suggests that higher language outcomes are associated with trajectories of functional lateralization that peak earlier and have a higher symmetrical connectivity strength at their peak. For visualization purposes, the estimated trajectory for ±1 SD in language score is plotted in Figure 5. These predicted trajectories for average language scores are plotted (black) along with trajectories for 1 SD above (green) and below (red) the average language score. Peaks for each function were calculated as the point where the derivative of that function reached zero and are as follows: average (black), 665 d; high (green), 650 d; low (red), 686 d.
Language outcome scores did not show significant effects with age in the symmetrical connectivity strength of the STG (all p's > 0.16). For the higher-order and sensory regions, because the trajectories were best fit by log-linear functions, language outcomes were modeled as a main effect as well as an interaction with the log-linear age term. Language outcome scores did not show significant main effects or interaction with age in the symmetrical connectivity strength of the IPS (all p's > 0.32), the PFC (all p's > 0.17), visual regions (all p's > 0.42), or sensory regions (all p's > 0.68).
To further test that these results were related to language and not driven by a general developmental mechanism, we tested the effects of visual reception scores and found that they did not show significant main effects (p = 0.463) or interaction effects with either linear (p = 0.765) or quadratic (p = 0.788) age terms in the IFG. Overall, these results suggest that the early transition toward asymmetry observed in the IFG reveals a selective relationship with individual children's later language ability.
We observed a similar pattern of selectivity in the ipsilateral functional connections. For right and left language regions, the effect of language was marginally significant (left, χ(2)2 = 4.829, p = 0.089; right, χ(2)2 = 5.257, p = 0.072). No other regions showed comparable effects, with all p's > 0.75. This suggests that the connections between the ipsilateral IFG and STG regions have a relationship with language outcomes that is not seen in the ipsilateral connection of other regions.
Control analyses
The overall best fit of the models generated after controlling for possible effects of motion and of signals from white matter/CSF, and for differences in number of functional volumes contributing to the data are highly consistent and do not affect our primary conclusions. Log-likelihood values for each of the models are presented in Table 3. This suggests that our results are not likely due to motion or regression artifacts. In addition, controlling for anatomical distance did not have any significant effect in these models or change the best-fit function for any of the regions we tested.
Table 3.
Model selection criterion (log-likelihood) for the control analyses and significance test for potential confounding variablesa
| Primary analysis |
Control analysis |
FD (p value) | Total volumes (p value) | |||||
|---|---|---|---|---|---|---|---|---|
| Linear | Log-linear | Quadratic | Linear | Log-linear | Quadratic | |||
| IFG | −94.59 | −90.62 | −79.44b | −98.54 | −97.11 | −77.89b | 0.426 | 0.419 |
| STG | −98.14 | −101.35 | −68.37b | −101.32 | −103.22 | −78.54b | 0.468 | 0.173 |
| Visual | −91.07 | −82.18b | −92.71 | −98.03 | −86.61b | −93.09 | 0.368 | 0.134 |
| Sensory | −94.38 | −74.54b | −86.03 | −91.26 | −78.88b | −85.16 | 0.433 | 0.093 |
| IPS | −57.60 | −52.83b | −55.08 | −61.22 | −56.49b | −59.67 | 0.352 | 0.133 |
| DLPFC | −93.10 | −91.12b | −92.00 | −98.88 | −97.72b | −97.06 | 0.397 | 0.242 |
aLog-likelihood values for each model are shown from the primary analysis (left) and the control analysis (middle). The two columns on the right show the p values for the chi-square test that assessed the effect of framewise displacement (FD) and the total number of volumes when these variables were included in the longitudinal model.
bBest fit model of each set of regions.
The mean motion deviations for the 71 infant participants were 0.84 ± 0.4 mm translation and 0.77 ± 0.6° rotation. Age group did not show an effect on either mean framewise displacement (F(6,216) = 0.564, p = 0.759) or the number of volumes dropped (F(6,216) = 1.280, p = 0.265). These factors were modeled as covariates in our longitudinal models and the effects were found to be insignificant (Table 3).
Finally, as a further correction for total volumes, we repeated our primary analysis and raised the minimum number of frames per scan to 120. This left 197 total scans (26 excluded) for a final control analysis. With this subset of our sample, the overall best fit of the models presented in the primary analysis did not change (Table 4).
Table 4.
Model selection criteria (log-likelihood) for additional analysis with higher threshold of total volumesa
| Primary analysis |
Control analysis with >120 frames per scan |
|||||
|---|---|---|---|---|---|---|
| Linear | Log-linear | Quadratic | Linear | Log-linear | Quadratic | |
| IFG | −94.59 | −90.62 | −79.44b | −81.4 | −78.6 | −70.3b |
| STG | −98.14 | −101.35 | −68.37b | −87.1 | −87.1 | −60.5b |
| Visual | −91.07 | −82.18b | −92.71 | −75.8 | −68.4b | −69.2 |
| Sensory | −94.38 | −74.54b | −86.03 | −77.9 | −65.4b | −70.4 |
| IPS | −57.60 | −52.83b | −55.08 | −46.65 | −42.45b | −45.68 |
| DLPFC | −93.10 | −91.12b | −92.00 | −85.23 | −83.96b | −84.55 |
aLog-likelihood values for each model are shown from the primary analysis and the control analysis.
bBest model fit for each set of regions
Discussion
In this study, we delineated the emerging asymmetry of language-related regions during infancy based on functional connectivity measures. We found three predominant patterns that describe the emergence of the brain's functional asymmetry in the first 2 years of life. First, we found that all of the regions studied showed an increase in functional symmetry during the majority of the first year. Second, language regions, but not other high-order or sensory regions, demonstrated a transition toward asymmetry that began at the end of the first year and continuing into the second year. Third, the increase in asymmetry was accompanied by increased connectivity within the same hemisphere language regions. Additionally, we found that the transition toward asymmetry in the IFG (Broca's area) was significantly associated with preschool language outcomes at 4 years of age.
Establishing the brain's functional architecture is a process that unfolds as part of a complex underlying neurobiological system of development that begins well before birth. During early preterm (24–28 weeks), structural thalamocortical connections become established (Kostović et al., 1995; Slater et al., 2006), while corticocortical pathways in the lateral neocortex are still growing (Burkhalter, 1993; Hevner, 2000). Slightly later (∼25–32 weeks), interhemispheric structural connections are gradually developing via the corpus callosum (deAzevedo et al., 1997) concurrently with increased interhemispheric functional connectivity (van den Heuvel et al., 2015). Therefore, the low level of functional connectivity symmetry observed between the bilateral IFG and STG during fetal development (Thomason et al., 2013) may be related to the immature structural connections of the corpus callosum.
Our results suggest that even systems known to lateralize in adulthood may share a common developmental trajectory of increasing symmetry in the first year of life. This pattern appears to be consistent among all the functional systems observed in this study. One possible explanation for this uniform increase in functional connectivity symmetry might be the rapid development of structural connectivity between bilateral homologous brain areas (Brody et al., 1987; Kinney et al., 1988; Gao et al., 2009a). Functionally, this increase in bilateral synchrony may allow the activity generated by homolog regions to be coordinated and integrated. For language development specifically, the early increase in synchrony might allow these regions to fine-tune their responses to speech sounds and prune their responses to biological nonspeech sounds. Evidence from neuroimaging research with infants suggests that pruning nonspeech sounds might take place in the first few months of life (Shultz et al., 2014). Such processes would provide the fundamental building blocks for speech and future language use.
Morphometric studies have also demonstrated that regions of frontal and temporal cortices (Broca's and Wernicke's areas) are asymmetric from birth (Li et al., 2014; Dubois et al., 2010). These regions, over the first 2 years of life, show large changes in the ipsilateral white matter fiber tracts that connect them (Perani et al., 2011; Geng et al., 2012). While our data suggest that functional neural development between homologous regions is likely set on a common course for different regions in the first year, the language-related regions appear to transition toward asymmetry in the second year. Previous studies found that atypical patterns of lateralization are present in neurodevelopmental disorders, including autism (Herbert et al., 2002; Kleinhans et al., 2008) and schizophrenia (Crow et al., 1989; Sommer et al., 2001). While measuring functional connectivity does not allow a direct assessment of functional lateralization, future studies that aim to understand how these biological mechanisms interact are likely to provide a more advanced insight into how the brain's functional networks typically develop in the early years of life and how this process relates to neurodevelomental disorders.
We did not detect differences between the IFG and STG in the onset of the shift toward asymmetry. Furthermore, the individual timing of the shift toward asymmetry was correlated between these regions across individuals, suggesting that these regions develop as a homogenous set or that the developmental process may be driven by a common underlying factor. For example, one possibility is that the developmental transition is a product of the increased anatomical connectivity of ipsilateral regions. It is possible that these regions may become less functionally connected with their homologues as the white matter fiber tracts that connect them within the same hemisphere develop. Indeed, studies have shown that these fiber tracts, particularly the one that connects the IFG to the STG, play an important role in language development (Friederici, 2009; Brauer et al., 2011) and show large developmental changes during this period (Geng et al., 2012). One study that used diffusor tensor imaging and fMRI found that these regions are structurally connected to focalized language activations in adults, but the spatial extent of language activation in children suggests the availability of alternative structural routes during development (Brauer et al., 2011). Thus, a maturing anatomical connection between these regions, along with an increase in functional connection, might spark the functional reorganization of the language system toward its adult-like, asymmetrical form. Overall, this research suggests that functional connectivity of language-related areas showed increasing synchronization between ipsilateral language areas rather than with their homologues, a shift predicted by cross-sectional studies with infants and adults (Lohmann et al., 2010; Perani et al., 2011). Our longitudinal findings offer converging evidence that this prediction is borne out in the second year of life.
We observe a relationship between behavioral language outcomes and the trajectory of functional symmetry in the IFG, but not in the STG or any other of the regions tested in this study (Fig. 5). Additionally, there was no relationship between visual reception scores and the trajectory of functional symmetry in the IFG. This might suggest that the observed development of asymmetry in the IFG is more closely related to language development, while the observed trajectory of Wernicke's region may be accounted for by more general developmental processes that support language. Similarly, we observed a marginal relationship between language outcomes and the longitudinal trajectory of increasing ipsilateral connectivity between the IFG and the STG. No other ipsilateral set of regions showed comparable effects, suggesting that the increase in functional synchrony of these regions within the same hemisphere during infancy is likely also related to language development.
Using resting-state measures in a large longitudinal sample, our results show a more protracted pattern in the development of asymmetrical interhemispheric functional connectivity than that previously suggested by task-based neuroimaging studies. Cross-sectional task-based studies in infants <3 months of age have shown mixed findings with regard to lateralization. For example, some have shown left-hemisphere activation for speech over biological nonspeech sounds (Shultz et al., 2014), some have shown speech over backward speech or non-native speech (Sato et al., 2012), and others have shown bilateral activation for speech over silence (Perani et al., 2011) or equal activation for forward and backward speech (May et al., 2011). In 3–4-month-old infants, studies comparing responses to speech sounds with responses to other auditory stimuli generally found that the left hemisphere shows higher responses (Dehaene-Lambertz et al., 2002, 2010; Minagawa-Kawai et al., 2011). These studies suggest that the lateralization of the brain's functional response to language stimuli begins developing quickly in the first few months. Based on functional connectivity measures with longitudinal sampling, our study offers a complimentary view of the development of functional asymmetry of language-related regions, revealing different developmental trajectories than those expected with task-based functional activation.
Given the established early asymmetry in the morphometry of the perisylvian regions and the superior temporal sulcus (Li et al., 2014, Dubois et al., 2010), it is possible that our selection of language-related ROIs within these regions do not represent exact homologues; however, without using task-based functional imaging, it is not possible to identify language-related homolog regions precisely and we are thus limited to using regions observed in previous studies. A second limitation in our study is that we cannot account for potential changes in the quality of the BOLD signal during sleep over the course of the first 2 years. While it is possible that qualitative changes in the measured signal play a role in the data, the observation of different longitudinal trajectories in several control regions makes it unlikely that such a change would affect our results.
In conclusion, we observed common increasing interhemispheric correlations in the first year of life, which might reflect a general principle of the brain's developing functional architecture. Our results suggest that the functional asymmetry of language-related regions as measured by functional connectivity begins to emerge late in the first year of life, highlighting the second year of life as an important developmental transition. Furthermore, the longitudinal trajectory of this transition toward asymmetry shows a relationship with preschool language outcomes. Future work is needed to understand how these developmental processes are linked to the concurrent emergence of early language skill and how they are guided by complex underlying biological mechanisms.
Footnotes
The authors declare no competing financial interests.
This work was supported by National Institutes of Health Grants 1U01MH110274 to W.L., R21NS088975 to W.G., and T32-HD40127 to R.W.E., as well as Cedars-Sinai institutional support to W.G.
References
- Alcauter S, Lin W, Smith JK, Short SJ, Goldman BD, Reznick JS, Gilmore JH, Gao W. Development of thalamocortical connectivity during infancy and its cognitive correlations. J Neurosci. 2014;34:9067–9075. doi: 10.1523/JNEUROSCI.0796-14.2014. [DOI] [PMC free article] [PubMed] [Google Scholar]
- Barbey AK, Koenigs M, Grafman J. Dorsolateral prefrontal contributions to human working memory. Cortex. 2013;49:1195–1205. doi: 10.1016/j.cortex.2012.05.022. [DOI] [PMC free article] [PubMed] [Google Scholar]
- Binder JR, Frost JA, Hammeke TA, Bellgowan PS, Springer JA, Kaufman JN, Possing ET. Human temporal lobe activation by speech and nonspeech sounds. Cereb Cortex. 2000;10:512–528. doi: 10.1093/cercor/10.5.512. [DOI] [PubMed] [Google Scholar]
- Brauer J, Anwander A, Friederici AD. Neuroanatomical prerequisites for language functions in the maturing brain. Cereb Cortex. 2011;21:459–466. doi: 10.1093/cercor/bhq108. [DOI] [PubMed] [Google Scholar]
- Brody BA, Kinney HC, Kloman AS, Gilles FH. Sequence of central nervous system myelination in human infancy. I. An autopsy study of myelination. J Neuropathol Exp Neurol. 1987;46:283–301. doi: 10.1097/00005072-198705000-00005. [DOI] [PubMed] [Google Scholar]
- Burkhalter A. Development of forward and feedback connections between areas V1 and V2 of human visual cortex. Cereb Cortex. 1993;3:476–487. doi: 10.1093/cercor/3.5.476. [DOI] [PubMed] [Google Scholar]
- Crow TJ, Ball J, Bloom SR, Brown R, Bruton CJ, Colter N, Frith CD, Johnstone EC, Owens DG, Roberts GW. Schizophrenia as an anomaly of development of cerebral asymmetry: a postmortem study and a proposal concerning the genetic basis of the disease. Arch Gen Psychiatry. 1989;46:1145–1150. doi: 10.1001/archpsyc.1989.01810120087013. [DOI] [PubMed] [Google Scholar]
- Damoiseaux JS, Rombouts SA, Barkhof F, Scheltens P, Stam CJ, Smith SM, Beckmann CF. Consistent resting-state networks across healthy subjects. Proc Natl Acad Sci U S A. 2006;103:13848–13853. doi: 10.1073/pnas.0601417103. [DOI] [PMC free article] [PubMed] [Google Scholar]
- deAzevedo LC, Hedin-Pereira C, Lent R. Callosal neurons in the cingulate cortical plate and subplate of human fetuses. J Comp Neurol. 1997;386:60–70. doi: 10.1002/(SICI)1096-9861(19970915)386:1%3C60::AID-CNE7%3E3.0.CO;2-B. [DOI] [PubMed] [Google Scholar]
- Dehaene-Lambertz G, Dehaene S, Hertz-Pannier L. Functional neuroimaging of speech perception in infants. Science. 2002;298:2013–2015. doi: 10.1126/science.1077066. [DOI] [PubMed] [Google Scholar]
- Dehaene-Lambertz G, Montavont A, Jobert A, Allirol L, Dubois J, Hertz-Pannier L, Dehaene S. Language or music, mother or Mozart? Structural and environmental influences on infants' language networks. Brain Lang. 2010;114:53–65. doi: 10.1016/j.bandl.2009.09.003. [DOI] [PubMed] [Google Scholar]
- Doria V, Beckmann CF, Arichi T, Merchant N, Groppo M, Turkheimer FE, Counsell SJ, Murgasova M, Aljabar P, Nunes RG, Larkman DJ, Rees G, Edwards AD. Emergence of resting state networks in the preterm human brain. Proc Natl Acad Sci U S A. 2010;107:20015–20020. doi: 10.1073/pnas.1007921107. [DOI] [PMC free article] [PubMed] [Google Scholar]
- Dubois J, Benders M, Lazeyras F, Borradori-Tolsa C, Leuchter RH, Mangin JF, Hüppi PS. Structural asymmetries of perisylvian regions in the preterm newborn. Neuroimage. 2010;52:32–42. doi: 10.1016/j.neuroimage.2010.03.054. [DOI] [PubMed] [Google Scholar]
- Emerson RW, Cantlon JF. Early math achievement and functional connectivity in the fronto-parietal network. Dev Cogn Neurosci. 2012;2:S139–S151. doi: 10.1016/j.dcn.2011.11.003. [DOI] [PMC free article] [PubMed] [Google Scholar]
- Fransson P, Skiöld B, Engström M, Hallberg B, Mosskin M, Aden U, Lagercrantz H, Blennow M. Spontaneous brain activity in the newborn brain during natural sleep—an fMRI study in infants born at full term. Pediatr Res. 2009;66:301–305. doi: 10.1203/PDR.0b013e3181b1bd84. [DOI] [PubMed] [Google Scholar]
- Friederici AD. Pathways to language: fiber tracts in the human brain. Trends Cogn Sci. 2009;13:175–181. doi: 10.1016/j.tics.2009.01.001. [DOI] [PubMed] [Google Scholar]
- Friederici AD, Alter K. Lateralization of auditory language functions: a dynamic dual pathway model. Brain Lang. 2004;89:267–276. doi: 10.1016/S0093-934X(03)00351-1. [DOI] [PubMed] [Google Scholar]
- Gao W, Lin W, Chen Y, Gerig G, Smith JK, Jewells V, Gilmore JH. Temporal and spatial development of axonal maturation and myelination of white matter in the developing brain. AJNR Am J Neuroradiol. 2009a;30:290–296. doi: 10.3174/ajnr.A1363. [DOI] [PMC free article] [PubMed] [Google Scholar]
- Gao W, Zhu H, Giovanello KS, Smith JK, Shen D, Gilmore JH, Lin W. Evidence on the emergence of the brain's default network from 2-week-old to 2-year-old healthy pediatric subjects. Proc Natl Acad Sci U S A. 2009b;106:6790–6795. doi: 10.1073/pnas.0811221106. [DOI] [PMC free article] [PubMed] [Google Scholar]
- Gao W, Gilmore JH, Giovanello KS, Smith JK, Shen D, Zhu H, Lin W. Temporal and spatial evolution of brain network topology during the first two years of life. PloS One. 2011;6:e25278. doi: 10.1371/journal.pone.0025278. [DOI] [PMC free article] [PubMed] [Google Scholar]
- Gao W, Gilmore JH, Shen D, Smith JK, Zhu H, Lin W. The synchronization within and interaction between the default and dorsal attention networks in early infancy. Cereb Cortex. 2013;23:594–603. doi: 10.1093/cercor/bhs043. [DOI] [PMC free article] [PubMed] [Google Scholar]
- Gao W, Alcauter S, Smith JK, Gilmore JH, Lin W. Development of human brain cortical network architecture during infancy. Brain Struct Funct. 2015a;220:1173–1186. doi: 10.1007/s00429-014-0710-3. [DOI] [PMC free article] [PubMed] [Google Scholar]
- Gao W, Alcauter S, Elton A, Hernandez-Castillo CR, Smith JK, Ramirez J, Lin W. Functional network development during the first year: relative sequence and socioeconomic correlations. Cereb Cortex. 2015b;25:2919–2928. doi: 10.1093/cercor/bhu088. [DOI] [PMC free article] [PubMed] [Google Scholar]
- Gao W, Lin W, Grewen K, Gilmore JH. Functional connectivity of the infant human brain: plastic and modifiable. Neuroscientist. 2016 doi: 10.1177/1073858416635986. pii:1073858416635986. [DOI] [PMC free article] [PubMed] [Google Scholar]
- Geng X, Gouttard S, Sharma A, Gu H, Styner M, Lin W, Gerig G, Gilmore JH. Quantitative tract-based white matter development from birth to age 2 years. Neuroimage. 2012;61:542–557. doi: 10.1016/j.neuroimage.2012.03.057. [DOI] [PMC free article] [PubMed] [Google Scholar]
- Hallquist MN, Hwang K, Luna B. The nuisance of nuisance regression: spectral misspecification in a common approach to resting-state fMRI preprocessing reintroduces noise and obscures functional connectivity. Neuroimage. 2013;82:208–225. doi: 10.1016/j.neuroimage.2013.05.116. [DOI] [PMC free article] [PubMed] [Google Scholar]
- Herbert MR, Harris GJ, Adrien KT, Ziegler DA, Makris N, Kennedy DN, Lange NT, Chabris CF, Bakardjiev A, Hodgson J, Takeoka M, Tager-Flusberg H, Caviness VS., Jr Abnormal asymmetry in language association cortex in autism. Ann Neurol. 2002;52:588–596. doi: 10.1002/ana.10349. [DOI] [PubMed] [Google Scholar]
- Hevner RF. Development of connections in the human visual system during fetal mid-gestation: a DiItracing study. J Neuropathol Exp Neurol. 2000;59:385–392. doi: 10.1093/jnen/59.5.385. [DOI] [PubMed] [Google Scholar]
- Jo HJ, Gotts SJ, Reynolds RC, Bandettini PA, Martin A, Cox RW, Saad ZS. Effective preprocessing procedures virtually eliminate distance-dependent motion artifacts in resting state fMRI. J Appl Math. 2013;2013 doi: 10.1155/2013/935154. [DOI] [PMC free article] [PubMed] [Google Scholar]
- Johnson PC. Extension of Nakagawa and Schielzeth's R2GLMM to random slopes models. Methods Ecol Evol. 2014;5:944–946. doi: 10.1111/2041-210X.12225. [DOI] [PMC free article] [PubMed] [Google Scholar]
- Kinney HC, Brody BA, Kloman AS, Gilles FH. Sequence of central nervous system myelination in human infancy. II. Patterns of myelination in autopsied infants. J Neuropathol Exp Neurol. 1988;47:217–234. doi: 10.1097/00005072-198805000-00003. [DOI] [PubMed] [Google Scholar]
- Kleinhans NM, Müller RA, Cohen DN, Courchesne E. Atypical functional lateralization of language in autism spectrum. Brain Res. 2008;1221:115–125. doi: 10.1016/j.brainres.2008.04.080. [DOI] [PMC free article] [PubMed] [Google Scholar]
- Kostović I, Judas M, Petanjek Z, Simić G. Ontogenesis of goal-directed behavior: anatomo-functional considerations. Int J Psychophysiol. 1995;19:85–102. doi: 10.1016/0167-8760(94)00081-O. [DOI] [PubMed] [Google Scholar]
- Li G, Nie J, Wang L, Shi F, Lyall AE, Lin W, Gilmore JH, Shen D. Mapping longitudinal hemispheric structural asymmetries of the human cerebral cortex from birth to 2 years of age. Cereb Cortex. 2014;24:1289–1300. doi: 10.1093/cercor/bhs413. [DOI] [PMC free article] [PubMed] [Google Scholar]
- Lohmann G, Hoehl S, Brauer J, Danielmeier C, Bornkessel-Schlesewsky I, Bahlmann J, Turner R, Friederici A. Setting the frame: the human brain activates a basic low-frequency network for language processing. Cereb Cortex. 2010;20:1286–1292. doi: 10.1093/cercor/bhp190. [DOI] [PubMed] [Google Scholar]
- May L, Byers-Heinlein K, Gervain J, Werker JF. Language and the newborn brain: does prenatal language experience shape the neonate neural response to speech? Front Psychol. 2011;2:222. doi: 10.3389/fpsyg.2011.00222. [DOI] [PMC free article] [PubMed] [Google Scholar]
- Minagawa-Kawai Y, van der Lely H, Ramus F, Sato Y, Mazuka R, Dupoux E. Optical brain imaging reveals general auditory and language-specific processing in early infant development. Cereb Cortex. 2011;21:254–261. doi: 10.1093/cercor/bhq082. [DOI] [PMC free article] [PubMed] [Google Scholar]
- Mullen EM. Mullen scales of early learning. Circle Pines, MN: AGS; 1995. [Google Scholar]
- Muschelli J, Nebel MB, Caffo BS, Barber AD, Pekar JJ, Mostofsky SH. Reduction of motion-related artifacts in resting state fMRI using aCompCor. Neuroimage. 2014;96:22–35. doi: 10.1016/j.neuroimage.2014.03.028. [DOI] [PMC free article] [PubMed] [Google Scholar]
- Nakagawa S, Schielzeth H. A general and simple method for obtaining R2 from generalized linear mixed-effects models. Methods Ecol Evol. 2013;4:133–142. doi: 10.1111/j.2041-210x.2012.00261.x. [DOI] [Google Scholar]
- Nielsen JA, Zielinski BA, Ferguson MA, Lainhart JE, Anderson JS. An evaluation of the left-brain vs. right-brain hypothesis with resting state functional connectivity magnetic resonance imaging. PloS One. 2013;8:e71275. doi: 10.1371/journal.pone.0071275. [DOI] [PMC free article] [PubMed] [Google Scholar]
- Patel AX, Kundu P, Rubinov M, Jones PS, Vértes PE, Ersche KD, Suckling J, Bullmore ET. A wavelet method for modeling and despiking motion artifacts from resting-state fMRI time series. Neuroimage. 2014;95:287–304. doi: 10.1016/j.neuroimage.2014.03.012. [DOI] [PMC free article] [PubMed] [Google Scholar]
- Peña M, Maki A, Kovacić D, Dehaene-Lambertz G, Koizumi H, Bouquet F, Mehler J. Sounds and silence: an optical topography study of language recognition at birth. Proc Natl Acad Sci U S A. 2003;100:11702–11705. doi: 10.1073/pnas.1934290100. [DOI] [PMC free article] [PubMed] [Google Scholar]
- Perani D, Saccuman MC, Scifo P, Anwander A, Awander A, Spada D, Baldoli C, Poloniato A, Lohmann G, Friederici AD. Neural language networks at birth. Proc Natl Acad Sci U S A. 2011;108:16056–16061. doi: 10.1073/pnas.1102991108. [DOI] [PMC free article] [PubMed] [Google Scholar]
- Pinheiro J, Bates D, DebRoy S, Sarkar D. Linear and nonlinear mixed effects models. R package version. 2007;3:57. [Google Scholar]
- Power JD, Barnes KA, Snyder AZ, Schlaggar BL, Petersen SE. Spurious but systematic correlations in functional connectivity MRI networks arise from subject motion. Neuroimage. 2012;59:2142–2154. doi: 10.1016/j.neuroimage.2011.10.018. [DOI] [PMC free article] [PubMed] [Google Scholar]
- Power JD, Mitra A, Laumann TO, Snyder AZ, Schlaggar BL, Petersen SE. Methods to detect, characterize, and remove motion artifact in resting state fMRI. Neuroimage. 2014;84:320–341. doi: 10.1016/j.neuroimage.2013.08.048. [DOI] [PMC free article] [PubMed] [Google Scholar]
- Power JD, Schlaggar BL, Petersen SE. Recent progress and outstanding issues in motion correction in resting state fMRI. Neuroimage. 2015;105:536–551. doi: 10.1016/j.neuroimage.2014.10.044. [DOI] [PMC free article] [PubMed] [Google Scholar]
- Sato H, Hirabayashi Y, Tsubokura H, Kanai M, Ashida T, Konishi I, Uchida-Ota M, Konishi Y, Maki A. Cerebral hemodynamics in newborn infants exposed to speech sounds: a whole-head optical topography study. Hum Brain Mapp. 2012;33:2092–2103. doi: 10.1002/hbm.21350. [DOI] [PMC free article] [PubMed] [Google Scholar]
- Shen D, Davatzikos C. HAMMER: hierarchical attribute matching mechanism for elastic registration. IEEE Trans Med Imaging. 2002;21:1421–1439. doi: 10.1109/TMI.2002.803111. [DOI] [PubMed] [Google Scholar]
- Shen D, Davatzikos C. Measuring temporal morphological changes robustly in brain MR images via 4-dimensional template warping. Neuroimage. 2004;21:1508–1517. doi: 10.1016/j.neuroimage.2003.12.015. [DOI] [PubMed] [Google Scholar]
- Shultz S, Vouloumanos A, Bennett RH, Pelphrey K. Neural specialization for speech in the first months of life. Dev Sci. 2014;17:766–774. doi: 10.1111/desc.12151. [DOI] [PMC free article] [PubMed] [Google Scholar]
- Slater R, Cantarella A, Gallella S, Worley A, Boyd S, Meek J, Fitzgerald M. Cortical pain responses in human infants. J Neurosci. 2006;26:3662–3666. doi: 10.1523/JNEUROSCI.0348-06.2006. [DOI] [PMC free article] [PubMed] [Google Scholar]
- Smith SM, Jenkinson M, Woolrich MW, Beckmann CF, Behrens TE, Johansen-Berg H, Bannister PR, De Luca M, Drobnjak I, Flitney DE, Niazy RK, Saunders J, Vickers J, Zhang Y, De Stefano N, Brady JM, Matthews PM. Advances in functional and structural MR image analysis and implementation as FSL. Neuroimage. 2004;23:S208–S219. doi: 10.1016/j.neuroimage.2004.07.051. [DOI] [PubMed] [Google Scholar]
- Sommer IE, Ramsey NF, Kahn RS. Language lateralization in schizophrenia, an fMRI study. Schizophr Res. 2001;52:57–67. doi: 10.1016/S0920-9964(00)00180-8. [DOI] [PubMed] [Google Scholar]
- Stark DE, Margulies DS, Shehzad ZE, Reiss P, Kelly AM, Uddin LQ, Gee DG, Roy AK, Banich MT, Castellanos FX, Milham MP. Regional variation in interhemispheric coordination of intrinsic hemodynamic fluctuations. J Neurosci. 2008;28:13754–13764. doi: 10.1523/JNEUROSCI.4544-08.2008. [DOI] [PMC free article] [PubMed] [Google Scholar]
- Thomason ME, Dassanayake MT, Shen S, Katkuri Y, Alexis M, Anderson AL, Yeo L, Mody S, Hernandez-Andrade E, Hassan SS, Studholme C, Jeong JW, Romero R. Cross-hemispheric functional connectivity in the human fetal brain. Sci Transl Med. 2013;5:173ra24. doi: 10.1126/scitranslmed.3004978. [DOI] [PMC free article] [PubMed] [Google Scholar]
- Toga AW, Thompson PM. Mapping brain asymmetry. Nat Rev Neurosci. 2003;4:37–48. doi: 10.1038/nrn1009. [DOI] [PubMed] [Google Scholar]
- van den Heuvel M, Mandl R, Hulshoff Pol H. Normalized cut group clustering of resting-state FMRI data. PloS One. 2008;3:e2001. doi: 10.1371/journal.pone.0002001. [DOI] [PMC free article] [PubMed] [Google Scholar]
- van den Heuvel MP, Kersbergen KJ, de Reus MA, Keunen K, Kahn RS, Groenendaal F, de Vries LS, Benders MJ. The neonatal connectome during preterm brain development. Cereb Cortex. 2015;25:3000–3013. doi: 10.1093/cercor/bhu095. [DOI] [PMC free article] [PubMed] [Google Scholar]
- Zuo XN, Kelly C, Di Martino A, Mennes M, Margulies DS, Bangaru S, Grzadzinski R, Evans AC, Zang YF, Castellanos FX, Milham MP. Growing together and growing apart: regional and sex differences in the lifespan developmental trajectories of functional homotopy. J Neurosci. 2010;30:15034–15043. doi: 10.1523/JNEUROSCI.2612-10.2010. [DOI] [PMC free article] [PubMed] [Google Scholar]