Abstract
Objective
The microvasculature of the chorioallantoic membrane (CAM) in the developing chick embryo is characterized by interdigitating arteriolar and venular trees, connected at multiple points along their lengths to a mesh-like capillary plexus. Theoretical modelling techniques were employed to investigate the resulting hemodynamic characteristics of the CAM.
Methods
Based on previously obtained anatomical data, a model was developed in which the capillary plexus was treated as a porous medium. Supply of blood from arterioles and drainage into venules were represented by distributions of flow sources and sinks. Predicted flow velocities were compared with measurements in arterioles and venules obtained via video microscopy.
Results
If it was assumed that blood flowed into and out of the capillary plexus only at the ends of terminal arterioles and venules, the predicted velocities increased with decreasing diameter in vessels below 50 μm in diameter, contrary to the observations. Distributing sources/sinks along arterioles/venules led to velocities consistent with the data.
Conclusions
These results imply that connections to the capillary plexus distributed along the arterioles and venules strongly affect the hemodynamic characteristics of the CAM. The theoretical model provides a basis for quantitative simulations of structural adaptation in CAM networks in response to hemodynamic stimuli.
Keywords: Networks, development, Darcy flow, continuum modelling
INTRODUCTION
Extraction of oxygen from the surroundings and delivery of oxygen throughout an organism are critical functions served by the microcirculation. The short diffusion distance of oxygen necessitates an extensive network of small capillaries to provide a large area for exchange and to bring flowing blood close to every part of the organism. Conversely, efficient transport over larger distances is achieved by convection within branching networks of vessels with larger diameters. Microvascular structures must be able to satisfy both of these contrasting requirements. Moreover, consideration of the large number of vessels involved shows that microvascular structures cannot be pre-programmed at the level of individual vessels but must emerge as the result of vascular responses to local conditions including biochemical and biomechanical stimuli. This concept, which has been explored previously in relation to the supply of oxygen to peripheral tissues [26, 28, 33], applies equally to organs responsible for the uptake of oxygen from the environment.
Direct observation of microvascular structures is important for gaining insight into their function and development. Tissues such as the mesentery that form thin sheets with essentially two-dimensional vascular networks are particularly suitable for this purpose [19, 20, 24]. More recently, advances in casting, microscopic imaging and image processing techniques have provided extensive information on three-dimensional network structures in various tissues including myocardium, cerebral cortex and tumors [14, 15, 18]. However, only limited information is available on three-dimensional microvascular structures in the lungs [10, 11].
The chorioallantoic membrane (CAM) of the chick embryo is widely used for studying the development of vascular structure [30]. The CAM is analogous to the placenta in mammals, supplying oxygen and nutrients to the developing chick embryo [8]. As a site of oxygen uptake, it is also analogous to the lungs. Its two-dimensional structure makes it suitable for visualization of microvascular network structure and determination of red blood cell velocities via video microscopy [23] over long enough periods to observe its structural development. A number of morphometric studies have reported statistics such as vessel density, length and intercapillary distances [4, 5, 29]. During development of the CAM, tree-like arterioles and venules emerge from an initially homogeneous capillary plexus. This process, known as intussusceptive arborization, occurs in the CAM between days 7 and 14 of incubation, with most activity on days 10 and 11 [7, 16]. The resulting microvasculature exhibits a characteristic pattern of interdigitating arterioles and venules that are displaced from the underlying capillary plexus, but remain connected to it [7].
Previous theoretical studies of blood flow in the CAM or comparable developing tissues have mainly focused on growth through intussusceptive angiogenesis [22, 38]. Gödde et al. [9] implemented stochastic simulations of shear stress-regulated sprouting angiogenesis and regression, which generated interdigitating patterns of arteriolar and venular trees similar to those found in the CAM. The goal of the present work is to provide a quantitative description of the hemodynamics of the CAM, including prediction of the distributions of blood pressure and flow. Such a description would provide a basis for analyzing the CAM’s oxygen transport characteristics. Furthermore, hemodynamic stimuli (wall shear stress and circumferential wall stress) are important for the structural remodeling of blood vessels [12, 16, 41]. Therefore, a hemodynamic model, as developed in the present study, is an essential component for theoretical analyses of the structural changes occurring during development of the CAM.
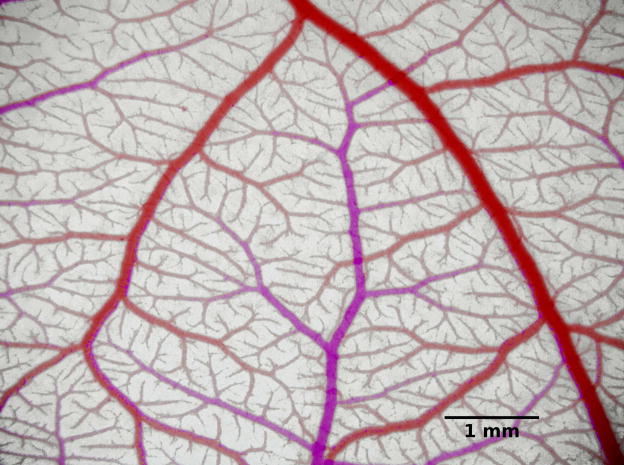
In recent studies [21], the morphological, topological and hemodynamic characteristics of CAM vessel trees were observed using intravital microscopy. The geometrical structure of a microvascular network in a day-14 ex ovo CAM containing one venular and two arteriolar trees, with dimensions 15.1 mm × 11.1 mm, was digitally reconstructed, providing information about length, diameter, and location of over 4500 arterial and venous vessel segments with diameters of 10 μm or more. Red blood cell velocities were measured in about 100 arterioles and 100 venules with diameters 16 to 100 μm in similar CAM networks using video microscopy and spatial correlation techniques. These data provide the experimental basis for the present analysis. Figure 1 shows an image of a CAM network at the same developmental stage.
Figure 1.
Photograph of a microvascular network in the CAM. Here, venules appear red while arterioles appear pink due to differences in oxygen saturation of the blood. Color differences were accentuated by changing the color balance.
The intravital imaging [21] did not allow resolution of the individual vessels forming the capillary plexus. Imaging at higher resolution, for example using scanning electron microscopy (SEM) of corrosion casts [8], shows that the capillary networks in the CAM have a somewhat regular, mesh-like structure. Therefore, the capillary plexus is modelled here as a homogeneous two-dimensional porous medium characterized by its blood flow conductivity [36]. Flows in the arteriolar and venular networks are coupled to the homogenized capillary plexus via distributions of sources and sinks. This approach leads to a computationally tractable framework for calculating pressures and flows in the CAM microcirculation without the need for a detailed reconstruction of the capillary mesh geometry.
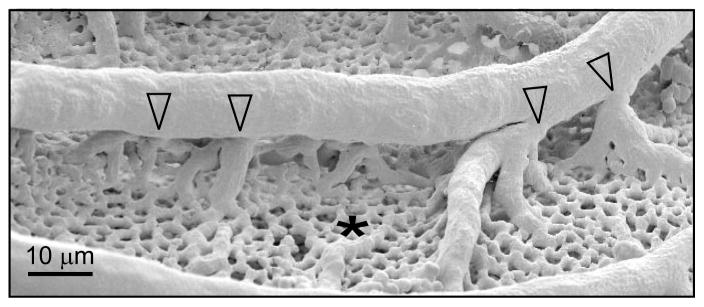
In the systemic microcirculation, the capillary networks typically form connections between the terminal branches of the arteriolar trees and the venular trees. In the intravital observations of the CAM [21], the connections between the arteriolar and venular trees and the plexus could not be resolved. However, SEM imaging indicates the presence of connections to the capillary plexus not only at the termini of arterioles and venules but also distributed along their lengths [8], as illustrated in Figure 2. Analogous vascular structures have been observed in the human lung [10, 11]. To explore the effects of such connections, two versions of the model were developed, one with only terminal connections (terminal sources model) and one with connections along arterioles and venules (distributed sources model). The resulting predictions of blood velocity were compared with measurements of red blood cell velocity in arterioles and venules obtained by Maibier et al. [21].
Figure 2.
Scanning electron microscope image of CAM vascular network, showing extensive capillary mesh (*) supplied by arteriolar and venular trees. An arteriole feeds the capillary mesh via connections distributed along its length (unfilled arrowheads). Reproduced with permission from [21].
MATERIALS AND METHODS
Hemodynamic model
The theoretical approach is shown schematically in Figure 3. Blood flow in the arterioles and venules, whose geometry was obtained from the imaging data, was described by Poiseuille’s law with uniform viscosity with conservation of flux at nodes. It was assumed that the capillary plexus could be modelled as a two-dimensional porous medium, based on the relatively homogeneous hexagonal mesh structure of the capillary network in the CAM [6]. Since the microvasculature of the CAM is approximately planar, it was assumed that the flow is two-dimensional. Darcy’s Law was employed to describe flow in the plexus:
where u is the volume-averaged blood velocity, κ is the effective conductivity of the plexus, and ∇p is the blood pressure gradient [37].
Figure 3.
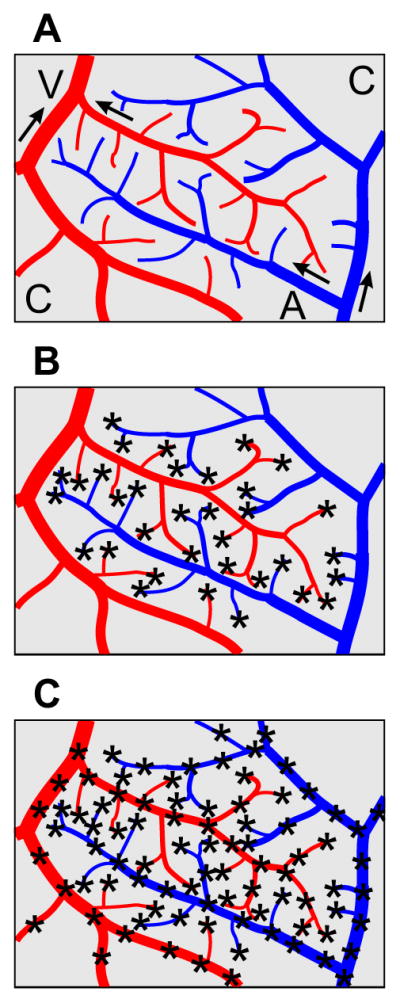
Schematic diagram of the models studied here. A: arterioles (A) are shown in blue while venules (V) are shown in red. Arrows indicate flow direction. The capillary plexus (C) is in gray. B: Terminal sources model. C: Distributed sources model. Source locations are indicated by asterisks.
The capillary plexus was linked hemodynamically to the arterioles and venules via sources and sinks of flow. Both sources and sinks are here referred to as sources, with sinks having negative strength. Source j was defined to have strength Cj and location xj, for j = 1, …, NS. These sources were uniformly distributed over disks of radius r0 centered on the source points. Conservation of mass implies that:
| (1) |
where r = |x − xj| and if r < r0 and zero otherwise. The pressure was assumed to tend towards a background pressure p0 as |x| → ∞. The solution to this problem was obtained in terms of the Green’s function G, which satisfies −κ∇2G(x,xj) = d(r) and G → 0 as |x| → ∞. The solution is then given by
| (2) |
This approach avoids a numerical solution that would require a fine discretization to represent the steep gradients near source points. The Green’s function G(r), as a function of the distance from source j, satisfies:
where G = 0 when r = R; G is finite as r → 0; G and ∂G/∂r are continuous at r = r0. Here, R is a far-field radius which was set to be twice the maximum dimension of the domain under consideration. The solution is
| (3) |
The Darcy (volume averaged) blood velocity is given by:
| (4) |
Parameter values
A constant blood viscosity of μ = 1.3 cP was assigned, based on values obtained in a viscometer at the same developmental stage [1, 21]. A diameter-dependent viscosity law [25] was not employed since the rheology of nucleated avian red blood cells may differ from that of mammalian species. The radius r0 over which sources are distributed was set to 0.5 μm. to avoid overlap between sources, since they are assumed to act independently in the model.
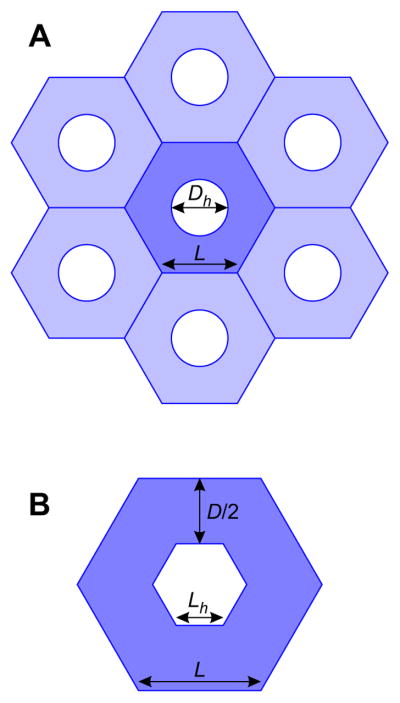
The effective conductivity κ was estimated using known geometrical properties of the capillary plexus. To calculate a lower bound for κ, it was assumed that the capillary plexus is formed of a regular hexagonal mesh. At day 14, the mean diameter of capillary-free orifices or ‘holes’ in the plexus was measured to be 6.6 ± 1.1 μm (mean ± SEM), with capillaries occupying 85.6 ± 0.5 % of the plexus area [5]. Assuming initially that the holes are circular with diameter Dh = 6.6 μm, each hole has on average an area of ¼πDh2 (see Figure 4A). A hexagon with the same area has edge length Lh, where:
from which it follows that:
| (5) |
Figure 4.
Schematic illustrating the assumed geometry of the capillary plexus. (A) A hexagonal grid of capillaries (in blue) with hole diameters Dh and hexagon edge lengths L. (B) Close-up of the center hexagon with hexagonal hole of edge length Lh. The capillary diameter D is given by the difference in hexagon heights.
The capillary network is assumed to be composed of tessellated hexagons of edge length L, containing holes which are assumed to be smaller hexagons of edge length Lh (see Figure 4B). The area fraction occupied by capillaries, ρc = 0.856, is given by:
from which it follows that
The capillary diameter is then given by twice the difference in hexagon widths:
This value agrees well with the Ribatti et al. who reported capillary lumen diameters of 10–15 μm by day 8 [31]. With these values for D and L and assuming that the plexus is composed of a network of cylindrical tubes, the network conductivity was predicted to be κ = 1.24 mm3s/kg via the homogenization method of Smith et al. [37]. This value most likely underestimates the conductivity. To obtain an upper bound on κ, a plexus completely filled with vessels was considered, i.e., flow between two sheets with separation D, giving
If D = 10.28 μm as calculated above, then κ = 6.77 mm3s/kg. A value of κ = 3 mm3s/kg was used as a compromise between these two estimates, and the sensitivity of results to κ was investigated.
Boundary conditions
For numerical convenience when solving for network pressures, short ‘dummy’ segments of length 1 μm and diameter Ddummy = 10.28 μm were included to connect arterioles and venules to the capillary plexus. The very low resistance of these vessels implies an almost direct coupling between arterioles or venules and the capillary plexus at source locations.
Boundary conditions (BCs) were assigned at nodes at the outer boundaries of the simulated regions. Pressure BCs pa and pv were assigned at the main arteriolar inlet and venular outlet (the largest-diameter boundary segments). The venular pressure pv was arbitrarily set to 10 mmHg. Choosing a different value would shift all pressures in the model by a constant amount. The arteriolar pressure pa was considered as unknown. If there were more than one arteriolar or venular tree (not connected to the main trees except through the capillaries), pressure BCs were also assigned at their main inlets or outlets. In this case, boundary values were assigned via a piece-wise logarithmic function of x, where x = D for the venules and x = −D for the arterioles:
where
and
Here, Da,max and Dv,max are the maximum arteriolar and venular diameters respectively over the whole network. This function was chosen to give a gradual decrease in pressure with decreasing arteriolar diameter, and a gradual decrease in pressure with increasing venular diameter. Flow BCs were assigned at all other boundary nodes using a linear approximation to the variation of velocity (mm/s) with diameter (μm) in the velocity data [21], for both arterioles and venules:
and multiplying estimated velocities by the segment cross-sectional areas. Flow directions were assigned by assuming that the main inlet in each arteriolar tree was an inflow segment and all other boundary segments in the same tree were outflows. Similarly, in the venules it was assumed that the largest-diameter boundary segment was the outlet and all other boundary segments were inflows.
Numerical solution
An iterative algorithm was developed in MATLAB R2013b to solve for the vectors of source pressures pS and source strengths qS, from which pressures and velocities in both the networks and the capillary plexus were calculated. A matrix Mcap was defined, which gives the pressure in the plexus at source point j resulting from a unit source at point i:
where rij = |xi − xj| is the distance between sources i and j. Here, D is the thickness of the capillary plexus (10.28 μm), which is required to convert from a three-dimensional source flux to a two-dimensional pressure field. For a given value of pa, the algorithm was as follows. (i) Shift all pressures by −p0, and set all source pressures pS = 0. In this initial step, it was assumed that p0 = (pa + pv)/2. (ii) Solve for the pressures at the nodes of the arteriolar and venular networks using the iterative successive over-relaxation scheme
where pi′ is the updated pressure value obtained by applying Kirchhoff’s laws at node i while holding all other node pressures fixed and ω1 = 1.7 is the over-relaxation factor. (iii) Calculate the network flows, including source fluxes qS, which equal the flows in the dummy segments. (iv) Re-calculate the source pressures using updated source fluxes: pSk = Mcap qSk where k is the step in the main iterative loop. (v) Update pSk = pSk−1 + ω2 (pSk − pSk−1) with under-relaxation factor ω2 = 8.3 × 10⁻⁴. The slowly decaying logarithmic term in Eq. (3) gives rise to a strong interaction between source points, and so a large degree of under-relaxation is needed to ensure convergence of the iterative method. The value of ω2 was chosen to ensure convergence of the solution with a minimal number of iterations. (vi) Use these new source pressures to update pressure BCs for network solution. (vii) Repeat steps (ii)–(vi) until the maximum change in source pressures, pSk − pSk−1, is less than 0.1 mmHg. (viii) Shift pressures so that the pressure at the main venular outlet is pv; the required shift gives the values of p0 and pa. Contour plots of the pressure field in the capillary plexus were plotted from pressure values calculated at a grid of points xi using Eq. (2). Similarly, the Darcy velocity field was calculated using Eq. (4).
Effects of assumed source point distributions
The algorithm described above was implemented on three non-overlapping sections of the network (Networks 1, 2 and 3) each containing major arterioles. As a metric to compare the computed flow solutions with recorded flow velocities in vessels of diameter between 15.8 μm and 100 μm, the mean velocities of arterioles and venules within five diameter bands were considered. The root mean squared deviation from recorded blood velocities was defined as:
where N = 5, ν̄k and V̄k are the mean computed and measured velocities respectively for vessels with Dbk < D < Dbk+1 for k = 1,…,5, and Dbk are linearly spaced between the minimum diameter data point (Db1 = 15.8 μm) and Db6 = 100 μm.
Two models were considered. In the terminal sources model, sources were placed only at the terminal nodes of arterioles and venules. An optimization procedure was implemented to choose arteriolar inlet pressure pa by minimizing rmsV, using fminsearch in MATLAB R2013b with a tolerance of 0.01. In the distributed sources model, it was assumed that arterioles and venules with diameters below some critical value DC are connected to the capillary bed at multiple points along their lengths. The value of DC can be estimated from SEM micrographs [3, 7] and was set to 100 μm. The number of sources per vascular segment was determined by a prescribed source spacing LS. It was assumed that this spacing was uniform throughout the network, for both arterioles and venules. Each segment was divided into equal sub-segments with length LS or less. Sources were placed at the end points of all segments and sub-segments. The actual mean source separation, calculated by dividing the total length of vessels with diameter less than Dc (excluding dummy segments) by the number of sources, was less than LS. In this case, both pa and LS were chosen by minimizing rmsV as already described.
RESULTS
Model results
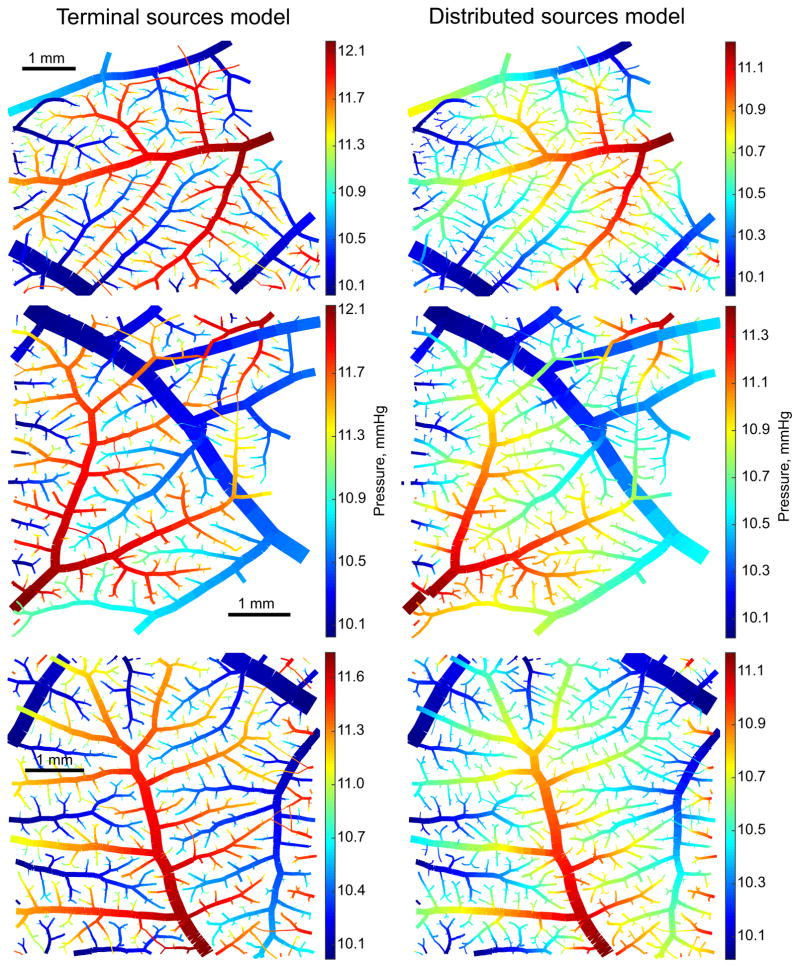
Geometrical characteristics of the three networks tested are shown in Table 1. Results of the two models are summarized in Tables 2 and 3. In the terminal sources model, the pressure drops pa – pv were 2.1 ± 0.3 mmHg. Pressures in the arterioles remained high before dropping off steeply in terminal segments (Figure 5, left). The distributed sources model, with a mean source spacing of 20.4 ± 0.9 μm, predicted gradual variations in pressures along the length of arterioles and venules (Figure 5, right), with lower pressure drops (1.3 ± 0.2 mmHg).
Table 1.
Geometric characteristics of Networks 1, 2 and 3.
| Network | 1 | 2 | 3 |
|---|---|---|---|
| Bounding box (mm2) | [8.2, 6.4] to [14.0, 11.1] | [9.7, 0.9] to [14.7, 6.2] | [1.0, 0.7] to [4.8, 1.9] |
| Number of segments | 2536 | 2055 | 3393 |
| Number of nodes | 2547 | 2066 | 3412 |
| Main inlet diameter (μm) | 172 | 176 | 225 |
| Main outlet diameter (μm) | 341 | 344 | 344 |
| Number of terminal sources | 563 | 448 | 638 |
Table 2.
Hemodynamic properties predicted by the terminal sources model. Here, Vcap is the Darcy velocity, C.V. is coefficient of variation, and Pcap is the capillary plexus pressure. All other quantities are defined in the text.
| Network | 1 | 2 | 3 |
|---|---|---|---|
| pa (mmHg) | 12.29 | 12.23 | 11.78 |
| rmsV | 1.28 | 1.24 | 0.86 |
| Vcap (mm/s, mean ± SD) | 0.16 ± 0.13 | 0.19 ± 0.47 | 0.20 ± 0.28 |
| C.V. of Vcap | 0.80 | 2.49 | 1.37 |
| ΔPcap (mmHg) | 0.81 | 1.03 | 0.79 |
| Pcap (mmHg, mean ± SD) | 11.1 ± 0.12 | 11.1 ± 0.16 | 10.8 ± 0.10 |
Table 3.
Hemodynamic properties predicted by the distributed sources model. All abbreviations are as defined for Table 2 or in the text.
| Network | 1 | 2 | 3 |
|---|---|---|---|
| LS (μm) | 22.4 | 23.3 | 22.0 |
| Mean source separation (μm) | 20.2 | 21.3 | 19.6 |
| pa (mmHg) | 11.31 | 11.50 | 11.08 |
| rmsV | 0.49 | 0.64 | 0.34 |
| Vcap (mm/s, mean ± SD) | 0.28 ± 0.20 | 0.29 ± 0.27 | 0.31 ± 0.19 |
| C.V. of Vcap | 0.71 | 0.92 | 0.59 |
| ΔPcap (mmHg) | 1.03 | 1.20 | 0.95 |
| Pcap (mmHg, mean ± SD) | 10.5 ± 0.21 | 10.7 ± 0.20 | 10.5 ± 0.18 |
Figure 5.
Pressures in arterioles and venules in Networks 1 (top), 2 (middle) and 3 (bottom) with the terminal sources model (left) and the distributed sources model (right).
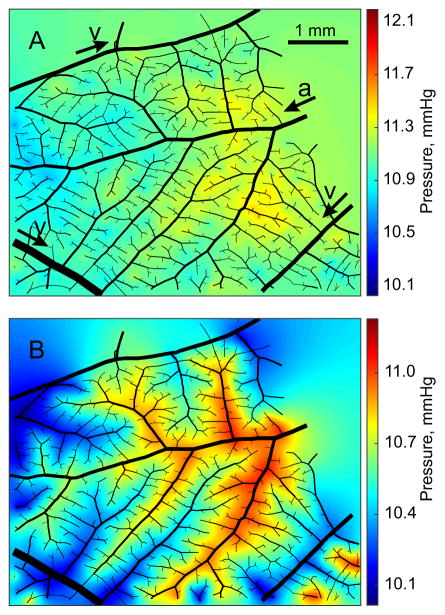
Pressures in the capillary plexus for both models are shown in Figure 6. In the terminal sources model, plexus pressures were spatially almost uniform and not closely correlated with arteriolar and venular pressures. In the distributed sources model, pressures in the capillary plexus were tightly coupled to pressures in the network, generating strong local pressure gradients in the plexus. The pressures in the plexus were higher for terminal sources than for distributed sources (11.0 mmHg vs. 10.6 mmHg on average) while the S.D. was lower (0.13 mmHg vs 0.20 mmHg). The maximum variation in pressures in the capillary plexus was on average 0.9 mmHg for terminal sources and 1.1 mmHg for distributed sources.
Figure 6.
Pressures in the capillary plexus in Network 1 with the terminal sources model (A) and the distributed sources model (B). Arterioles and venules are shown in black, with diameters reduced by 50%. In A, the main arterioles (a) and venules (v) are identified. Arrows show directions of flow. The color bars show the range of pressures in the network including capillaries and venules. Capillary pressures span a narrower range.
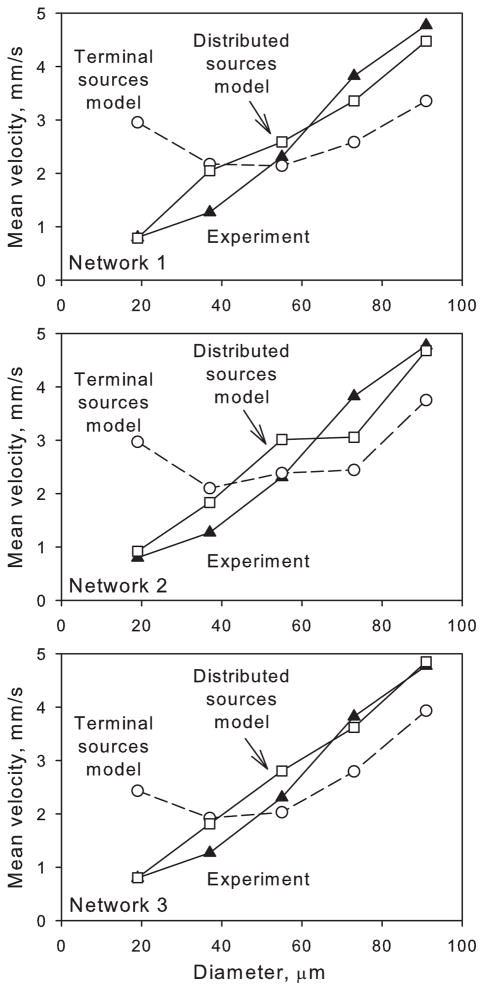
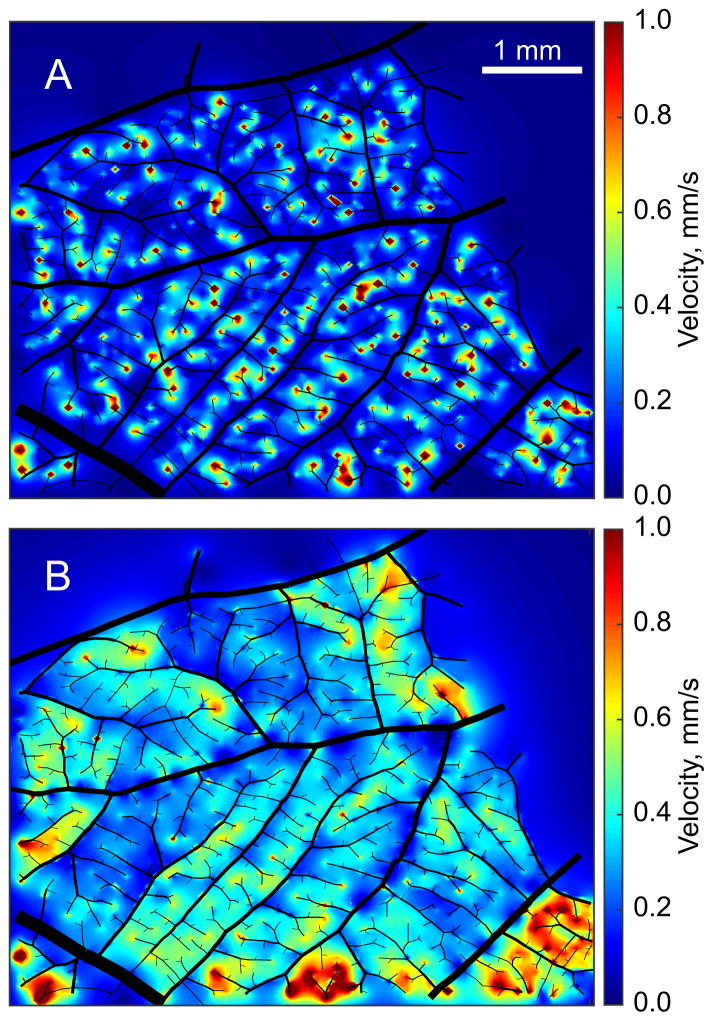
As expected, network velocities in the terminal sources model did not agree well with experimental diameter vs. velocity data (rmsV = 1.13 on average), with velocities too low in higher-diameter vessels (D > 40 μm), and increasing with decreasing diameter in vessels with D < 40 μm, contrary to the observations. The distributed sources model performed better (rmsV = 0.49 on average), as shown in Figure 7. Darcy velocities in the plexus are shown for both models in Figure 8. With terminal sources, plexus velocities were generally low (average 0.18 mm/s) but heterogeneous with coefficient of variation (C.V.) between 0.8 and 2.5. Localized regions of high velocity occurred near source points. With distributed sources, plexus velocities were higher (average 0.29 mm/s) and more homogeneous (C.V. in the range 0.6 to 0.9).
Figure 7.
Diameter against mean velocity for arterioles and venules with diameter <100 μm in Networks 1, 2 and 3 for the terminal sources model, distributed sources model, and experimental data [21].
Figure 8.
Darcy velocities in the capillary plexus in Network 1 with the terminal sources model (A) and the distributed sources model (B). Arterioles and venules are shown in black, with diameters reduced by 50%.
In the distributed sources model, source fluxes increased as a function of segment diameter (excluding the dummy segments). However, due to the much larger number of small-diameter vessels, the total net flux emanating from sources decreased as a function of diameter (not shown). Some arteriolar sources had negative flux and some venular sinks had positive flux. Such behavior is not surprising in a network that is growing and adapting in response to temporally and spatially varying signals.
Sensitivity analysis
A sensitivity analysis was conducted for the distributed sources model in Network 1, by altering the following parameters ±10% relative to their control values: pa – pv = 1.31 mmHg, LS = 22.4 μm, κ = 3 mm3s/kg, Ddummy = 10.28 μm, μ = 1.3 cP, Dc = 100 μm, and r0 = 0.5 μm. Percentage changes in four metrics in response to ±10% changes to various parameters, relative to the values listed in, are shown in for Network 1. Results in Networks 2 and 3 were similar. The metric rmsV, which describes the deviation between modelled and measured arteriolar and venular velocities, was most sensitive to a 10% decrease in LS, which led to a 20.6% increase in rmsV. Changes in pa – pv also had a strong effect on rmsV, with a 10% increase leading to a 19.5% increase. Changes of ±10% in other parameters caused less than 5% change in rmsV. The largest improvement was seen when κ was reduced by 10%, giving a 2.55% decrease in rmsV. As would be expected, changes of ±10% in pa – pv led to approximately proportional changes in mean plexus velocity (mean Vcap) and in ΔPcap, the pressure drop across the plexus. The coefficient of variation of velocities in the capillary plexus was insensitive to changes in any parameter.
A corresponding sensitivity analysis was performed also for the terminal sources model. The results (not shown) indicate that the rmsV in this model is relatively insensitive to the model parameters and that variation of these parameters would not lead to good agreement between measured and observed velocity distributions.
DISCUSSION
A novel modelling framework has been developed to predict blood flows and pressures in the CAM microcirculation, based on SEM images of CAM corrosion casts. The capillary plexus is represented as a continuum with uniform conductivity to blood flow. Flows from arterioles into the plexus are represented by a distribution of sources, and drainage of the plexus by venules is represented by a distribution of sinks. Comparisons of model predictions with velocity measurements in vessels in the same range of diameters implied that vascular connections to the capillary plexus must be present along the lengths of the arterioles and venules, and not only at the ends of terminal arterioles and venules. The terminal sources model was not able to match the measured velocity distributions. Because diameters in the CAM network decrease sharply along the arteriolar tree, velocities would have to increase in smaller diameter vessels in the absence of flow out of the arterioles along their lengths. This is in contrast to the systemic circulation where the diameter decrease along vascular trees is more gradual.
It might be argued that arteriolar and venular structures with only terminal sources would be equally effective as the structure with distributed sources in perfusing the capillary plexus, if the diameters did not decrease so markedly toward the terminal branches of the vascular trees. To test this possibility, we considered the terminal sources model with re-scaled vessel diameters:
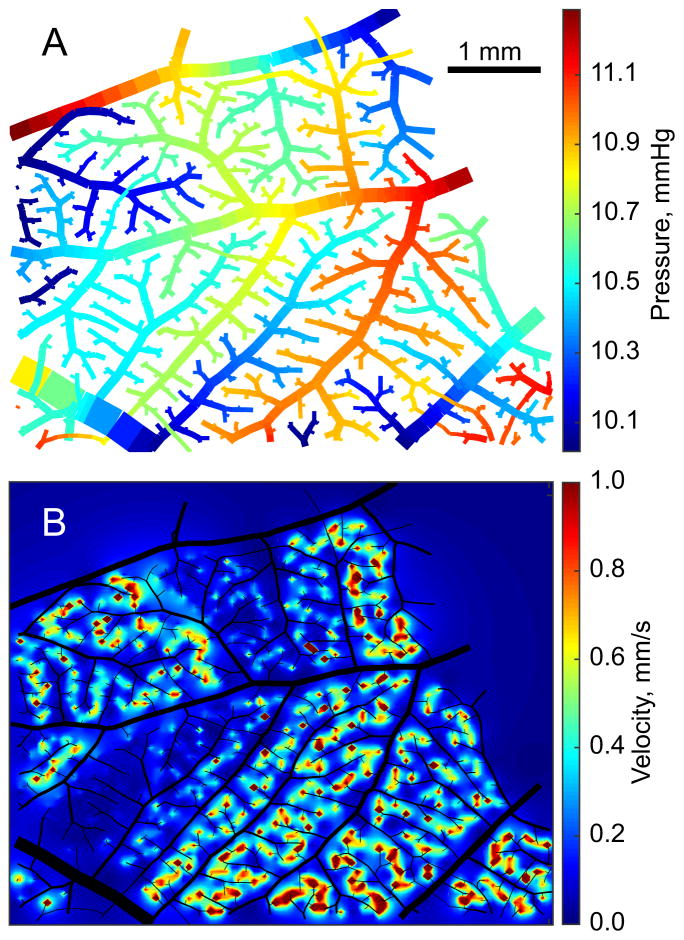
With an initial value of D0, the parameter N was chosen by fitting vessel shear stress as a linear function of (unscaled) diameter and minimizing the slope of this curve, with the goal of generating uniform shear stress across the network. This would represent the result of structural adaptation of vessel diameter in response to variations in wall shear stress [27]. Using this value of N, D0 was then chosen by minimizing the difference in the total source flux from the arterioles relative to the distributed sources model. The same value of pa derived for the distributed sources model was used. These two steps were iterated until the values of D0 and N were unchanged, giving D0 = 119 μm and N = 0.51 in Network 1. In this Network, arteriolar and venular pressures were locally more uniform but with wide variance across the network (Figure 9A), with large pressure drops in the venules and some venular pressures approaching pa. This solution did not match the velocity data well (rmsV = 1.12). Plexus velocities were lower than the distributed model but higher than the terminal sources model (0.19 mm/s on average) with much higher coefficient of variation (1.6). The spatial distribution of plexus velocities was heterogeneous with large regions of high velocity and other regions of very low velocity (Figure 9B). These results imply that a structure with only terminal sources would not perfuse the capillary plexus as effectively as the structure with distributed sources, even with redistributed vessel diameters.
Figure 9.
Results for Network 1 with the terminal sources model and rescaled arteriolar and venular diameters. Pressures in arterioles and venules (top). Darcy velocities in the capillary plexus (bottom).
The result that capillary plexus velocities were higher and more homogeneous in the presence of distributed sources indicates that this may be a functionally important structural feature. In a fertilized egg, oxygen diffuses from the external environment through the egg shell into the air cell [29]. The CAM absorbs oxygen from this air space, which can be assumed to have an approximately uniform partial pressure of oxygen under normal conditions. In the lung, matching of perfusion to ventilation leads to optimal gas transport, for given total ventilation and perfusion [40]. Correspondingly, oxygen transport in the CAM is optimized for a given total perfusion if local perfusion is uniform across the surface of the CAM. The present study shows that this condition is more closely approximated when distributed sources are present on the arterioles and venules.
The model involves a number of assumptions and simplifications. The capillary plexus is represented as a continuous sheet with a uniform hydraulic conductivity. Given more detailed information on the structure of the plexus, this assumption could be tested by detailed fluid mechanical simulations on the capillary scale. The simulation of flow in the arteriolar and venular networks requires the imposition of boundary conditions on the multiple vessels that cross the domain boundaries in addition to the main feeding and draining vessels, as described earlier. The resulting flows and pressures generally took more extreme values near network boundaries, suggesting dependence on the chosen boundary values. However, the domains chosen were sufficiently large that the results in the interior of the domain can be assumed to have only a mild dependence on these conditions.
As shown by Table 4, the parameter LS describing the spacing of sources is a key parameter of the distributed sources model. The deviation between measured and observed velocities was sensitive to the value of LS, and increased with variations above or below the optimized value. In the model, a cut-off diameter DC = 100 μm was enforced above which vessels did not have any sources, with uniformly distributed sources on smaller vessels. Some images suggest that the cutoff diameter should be smaller [3]. More detailed structural data could be used to improve the model for the distribution of the sources along arterioles and venules.
Table 4.
Results of sensitivity analysis. All abbreviations are as defined for Table 2 or in the text.
| Quantity changed | Percent change | Percent change | |||
|---|---|---|---|---|---|
|
| |||||
| rmsV | Mean Vcap | C.V. of Vcap | ΔPcap | ||
| pa – pv | −10 | 13.31 | −10.74 | −0.06 | −9.76 |
| +10 | 19.45 | 11.03 | 0.14 | 9.79 | |
|
| |||||
| LS | −10 | 20.64 | 5.55 | 0.70 | 0.31 |
| +10 | 5.13 | −4.66 | −0.57 | −0.25 | |
|
| |||||
| κ | −10 | 4.01 | −6.46 | 0.43 | 0.47 |
| +10 | −2.55 | 6.40 | −0.30 | −0.42 | |
|
| |||||
| Ddummy | −10 | −0.09 | −0.58 | −0.29 | −0.39 |
| +10 | 0.02 | 0.52 | 0.23 | 0.26 | |
|
| |||||
| μ | −10 | −0.86 | 1.00 | 0.70 | 0.24 |
| +10 | 1.08 | −0.42 | −0.45 | −1.25 | |
|
| |||||
| Dc | −10 | 3.14 | −0.54 | 0.82 | 0.04 |
| +10 | −0.21 | 0.16 | −0.20 | −0.02 | |
|
| |||||
| r0 | −10 | −0.01 | −0.15 | −0.12 | −0.08 |
| +10 | 0.01 | 0.13 | 0.12 | 0.08 | |
The CAM microcirculation represents a useful model for studying various aspects of microvascular function due to its relatively homogeneous structure. The complexity (both structural and functional) of the CAM lies between simplified, idealized networks often considered for modelling purposes [2, 13] and microvascular networks in tissues such as the myocardium or the cerebral cortex. The CAM acts as a two-dimensional functional analog to the lung, and the results presented here are relevant to the pulmonary circulation, which is difficult to study due to its complex 3D structure and due to respiratory motion. Both structures absorb oxygen over a surface where the oxygenation is high, and the very dense mesh of capillaries maximizes oxygen absorption. This is in contrast to skeletal muscle, for example, in which a three-dimensional array of capillaries occupying only 1 to 2% of the tissue volume is sufficient to supply oxygen throughout the tissue under normal conditions. In a recent intravital microscopy study of the microvasculature of the mouse lung, it was reported that 50% of oxygen exchange occurs in precapillary arterioles of diameter less than 30 μm [39]. In hypoxic states, precapillary oxygenation was significantly reduced, with most of the oxygenation occurring at the capillary level, indicating that capillaries act as back-up mechanism in hypoxia. This is analogous to results of previous studies in skeletal muscle [34] and cerebral cortex [32]. The present results provide a basis for quantitative investigation of oxygen transport in the CAM, using existing methods [35].
To function efficiently, microvascular networks require both a dense mesh of small vessels for exchange of materials and a hierarchical branching network of feeding and draining vessels to minimize hydrodynamic flow resistance. The development of such structures presents a patterning problem, which has been discussed in the context of growth by sprouting angiogenesis [26]. The CAM represents a different paradigm for network formation, in which interdigitating tree structures emerge from an existing dense capillary plexus by intussusceptive arborization. The mechanisms underlying this process are not well understood, but likely involve responses to wall shear stresses generated by blood flow in the network [17]. The hemodynamic model presented here represents an essential tool for studies aimed at understanding growth and structural remodeling of microvascular networks in the CAM, and also potentially in analogous tissues including the lung.
PERSPECTIVE
In the chorioallantoic membrane (CAM) of the developing chick embryo, a mesh-like capillary plexus is fed and drained by interdigitating arteriolar and venular trees. A theoretical model is presented for the hemodynamics of the CAM, in which the capillary plexus is represented as a homogeneous porous medium. The model shows that multiple connections with the capillary plexus along the lengths of the arterioles and venules are important in the perfusion of the CAM, and provides a basis for analyzing growth and structural remodeling in the CAM microvasculature.
Acknowledgments
Grant numbers and sources of support: This work was supported by NIH grant HL034555.
Reference List
- 1.Al-Roubaie S, Jahnsen ED, Mohammed M, Henderson-Toth C, Jones EAV. Rheology of embryonic avian blood. Am J Physiol Heart Circ Physiol. 2011;301:H2473–H2481. doi: 10.1152/ajpheart.00475.2011. [DOI] [PubMed] [Google Scholar]
- 2.Beard DA, Bassingthwaighte JB. Modeling advection and diffusion of oxygen in complex vascular networks. Ann Biomed Eng. 2001;29:298–310. doi: 10.1114/1.1359450. [DOI] [PMC free article] [PubMed] [Google Scholar]
- 3.Burri PH, Hlushchuk R, Djonov V. Intussusceptive angiogenesis: its emergence, its characteristics, and its significance. Dev Dyn. 2004;231:474–488. doi: 10.1002/dvdy.20184. [DOI] [PubMed] [Google Scholar]
- 4.DeFouw D, Rizzo V, Steinfeld R, Feinberg R. Mapping of the microcirculation in the chick chorioallantoic membrane during normal angiogenesis. Microvascular Research. 1989;38:136–147. doi: 10.1016/0026-2862(89)90022-8. [DOI] [PubMed] [Google Scholar]
- 5.Dimitropoulou C, Malkusch W, Fait E, Maragoudakis ME, Konerding MA. The vascular architecture of the chick chorioallantoic membrane: sequential quantitative evaluation using corrosion casting. Angiogenesis. 1998;2:255–263. doi: 10.1023/A:1009210918738. [DOI] [PubMed] [Google Scholar]
- 6.Djonov V, Baum O, Burri PH. Vascular remodeling by intussusceptive angiogenesis. Cell and Tissue Research. 2003;314:107–117. doi: 10.1007/s00441-003-0784-3. [DOI] [PubMed] [Google Scholar]
- 7.Djonov V, Galli AB, Burri PH. Intussusceptive arborization contributes to vascular tree formation in the chick chorio-allantoic membrane. Anatomy and Embryology. 2000;202:347–357. doi: 10.1007/s004290000126. [DOI] [PubMed] [Google Scholar]
- 8.Djonov VG, Kurz H, Burri PH. Optimality in the developing vascular system: branching remodeling by means of intussusception as an efficient adaptation mechanism. Dev Dyn. 2002;224:391–402. doi: 10.1002/dvdy.10119. [DOI] [PubMed] [Google Scholar]
- 9.Gödde R, Kurz H. Structural and biophysical simulation of angiogenesis and vascular remodeling. Dev Dyn. 2001;220:387–401. doi: 10.1002/dvdy.1118. [DOI] [PubMed] [Google Scholar]
- 10.Guntheroth WG, Luchtel DL, Kawabori I. Pulmonary microcirculation: tubules rather than sheet and post. J Appl Physiol Respir Environ Exerc Physiol. 1982;53:510–515. doi: 10.1152/jappl.1982.53.2.510. [DOI] [PubMed] [Google Scholar]
- 11.Horsfield K. Morphometry of the small pulmonary arteries in man. Circulation Research. 1978;42:593–597. doi: 10.1161/01.res.42.5.593. [DOI] [PubMed] [Google Scholar]
- 12.Jacobsen JC, Gustafsson F, Holstein-Rathlou NH. A model of physical factors in the structural adaptation of microvascular networks in normotension and hypertension. Physiol Meas. 2003;24:891–912. doi: 10.1088/0967-3334/24/4/007. [DOI] [PubMed] [Google Scholar]
- 13.Jespersen SN, Østergaard L. The roles of cerebral blood flow, capillary transit time heterogeneity, and oxygen tension in brain oxygenation and metabolism. J Cereb Blood Flow Metab. 2012;32:264–277. doi: 10.1038/jcbfm.2011.153. [DOI] [PMC free article] [PubMed] [Google Scholar]
- 14.Kim E, Stamatelos S, Cebulla J, Bhujwalla ZM, Popel AS, Pathak AP. Multiscale imaging and computational modeling of blood flow in the tumor vasculature. Annals of Biomedical Engineering. 2012;40:2425–2441. doi: 10.1007/s10439-012-0585-5. [DOI] [PMC free article] [PubMed] [Google Scholar]
- 15.Lauwers F, Cassot F, Lauwers-Cances V, Puwanarajah P, Duvernoy H. Morphometry of the human cerebral cortex microcirculation: General characteristics and space-related profiles. Neuroimage. 2008;39:936–948. doi: 10.1016/j.neuroimage.2007.09.024. [DOI] [PubMed] [Google Scholar]
- 16.le Noble F, Fleury V, Pries AR, Corvol P, Eichmann A, Reneman RS. Control of arterial branching morphogenesis in embryogenesis: go with the flow. Cardiovascular Research. 2005;65:619–628. doi: 10.1016/j.cardiores.2004.09.018. [DOI] [PubMed] [Google Scholar]
- 17.Lee GS, Filipovic N, Miele LF, Lin M, Simpson DC, Giney B, Konerding MA, Tsuda A, Mentzer SJ. Blood flow shapes intravascular pillar geometry in the chick chorioallantoic membrane. J Angiogenes Res. 2010;2:11. doi: 10.1186/2040-2384-2-11. [DOI] [PMC free article] [PubMed] [Google Scholar]
- 18.Lee J, Niederer S, Nordsletten D, Le Grice I, Smail B, Kay D, Smith N. Coupling contraction, excitation, ventricular and coronary blood flow across scale and physics in the heart. Philosophical Transactions of the Royal Society A-Mathematical Physical and Engineering Sciences. 2009;367:2311–2331. doi: 10.1098/rsta.2008.0311. [DOI] [PubMed] [Google Scholar]
- 19.Ley K, Pries AR, Gaehtgens P. Topological structure of rat mesenteric microvessel networks. Microvascular Research. 1986;32:315–332. doi: 10.1016/0026-2862(86)90068-3. [DOI] [PubMed] [Google Scholar]
- 20.Lipowsky HH, Zweifach BW. Network analysis of microcirculation of cat mesentery. Microvascular Research. 1974;7:73–83. doi: 10.1016/0026-2862(74)90038-7. [DOI] [PubMed] [Google Scholar]
- 21.Maibier M, Reglin B, Nitzsche B, Xiang W, Rong W, Hoffmann B, Djonov V, Secomb TW, Pries AR. Structure and hemodynamics of vascular networks in the chorioallantoic membrane of the chicken. American Journal of Physiology – Heart and Circulatory Physiology. 2016 doi: 10.1152/ajpheart.00786.2015. Epub ahead of print. [DOI] [PubMed] [Google Scholar]
- 22.Nguyen TH, Eichmann A, le Noble F, Fleury V. Dynamics of vascular branching morphogenesis: The effect of blood and tissue flow. Physical Review e. 2006;73:061907. doi: 10.1103/PhysRevE.73.061907. [DOI] [PubMed] [Google Scholar]
- 23.Nowak-Sliwinska P, Segura T, Iruela-Arispe ML. The chicken chorioallantoic membrane model in biology, medicine and bioengineering. Angiogenesis. 2014;17:779–804. doi: 10.1007/s10456-014-9440-7. [DOI] [PMC free article] [PubMed] [Google Scholar]
- 24.Poiseuille JLM. Recherches sur les causes du mouvement du sang dans les vaisseaux capillaires. CR Acad Sci. 1835;6:554–560. [Google Scholar]
- 25.Pries AR, Secomb TW. Microvascular blood viscosity in vivo and the endothelial surface layer. Am J Physiol Heart Circ Physiol. 2005;289:H2657–H2664. doi: 10.1152/ajpheart.00297.2005. [DOI] [PubMed] [Google Scholar]
- 26.Pries AR, Secomb TW. Making microvascular networks work: angiogenesis, remodeling, and pruning. Physiology (Bethesda ) 2014;29:446–455. doi: 10.1152/physiol.00012.2014. [DOI] [PMC free article] [PubMed] [Google Scholar]
- 27.Pries AR, Secomb TW, Gaehtgens P. Design principles of vascular beds. Circulation Research. 1995;77:1017–1023. doi: 10.1161/01.res.77.5.1017. [DOI] [PubMed] [Google Scholar]
- 28.Pries AR, Secomb TW, Gaehtgens P. Structural adaptation and stability of microvascular networks: theory and simulations. Am J Physiol. 1998;275:H349–H360. doi: 10.1152/ajpheart.1998.275.2.H349. [DOI] [PubMed] [Google Scholar]
- 29.Reizis A, Hammel I, Ar A. Regional and developmental variations of blood vessel morphometry in the chick embryo chorioallantoic membrane. The Journal of Experimental Biology. 2005;208:2483–2488. doi: 10.1242/jeb.01662. [DOI] [PubMed] [Google Scholar]
- 30.Ribatti D. Chicken chorioallantoic membrane angiogenesis model. Methods in Molecular Biology. 2012;843:47–57. doi: 10.1007/978-1-61779-523-7_5. [DOI] [PubMed] [Google Scholar]
- 31.Ribatti D, Nico B, Vacca A, Roncali L, Burri PH, Djonov V. Chorioallantoic membrane capillary bed: a useful target for studying angiogenesis and anti-angiogenesis in vivo. The Anatomical Record. 2001;264:317–324. doi: 10.1002/ar.10021. [DOI] [PubMed] [Google Scholar]
- 32.Sakadzic S, Mandeville ET, Gagnon L, Musacchia JJ, Yaseen MA, Yucel MA, Lefebvre J, Lesage F, Dale AM, Eikermann-Haerter K, Ayata C, Srinivasan VJ, Lo EH, Devor A, Boas DA. Large arteriolar component of oxygen delivery implies a safe margin of oxygen supply to cerebral tissue. Nat Commun. 2014;5:5734. doi: 10.1038/ncomms6734. [DOI] [PMC free article] [PubMed] [Google Scholar]
- 33.Secomb TW, Alberding JP, Hsu R, Dewhirst MW, Pries AR. Angiogenesis: an adaptive dynamic biological patterning problem. PLoS Comput Biol. 2013;9:e1002983. doi: 10.1371/journal.pcbi.1002983. [DOI] [PMC free article] [PubMed] [Google Scholar]
- 34.Secomb TW, Hsu R. Simulation of O2 transport in skeletal muscle: diffusive exchange between arterioles and capillaries. Am J Physiol. 1994;267:H1214–H1221. doi: 10.1152/ajpheart.1994.267.3.H1214. [DOI] [PubMed] [Google Scholar]
- 35.Secomb TW, Hsu R, Park EY, Dewhirst MW. Green’s function methods for analysis of oxygen delivery to tissue by microvascular networks. Ann Biomed Eng. 2004;32:1519–1529. doi: 10.1114/b:abme.0000049036.08817.44. [DOI] [PubMed] [Google Scholar]
- 36.Shipley RJ, Chapman SJ. Multiscale modelling of fluid and drug transport in vascular tumours. Bulletin of Mathematical Biology. 2010;72:1464–1491. doi: 10.1007/s11538-010-9504-9. [DOI] [PubMed] [Google Scholar]
- 37.Smith AF, Shipley RJ, Lee J, Sands GB, Legrice IJ, Smith NP. Transmural variation and anisotropy of microvascular flow conductivity in the rat myocardium. Ann Biomed Eng. 2014;42:1966–1977. doi: 10.1007/s10439-014-1028-2. [DOI] [PMC free article] [PubMed] [Google Scholar]
- 38.Szczerba D, Kurz H, Szekely G. A computational model of intussusceptive microvascular growth and remodeling. Journal of Theoretical Biology. 2009;261:570–583. doi: 10.1016/j.jtbi.2009.09.018. [DOI] [PubMed] [Google Scholar]
- 39.Tabuchi A, Styp-Rekowska B, Slutsky AS, Wagner PD, Pries AR, Kuebler WM. Precapillary oxygenation contributes relevantly to gas exchange in the intact lung. American Journal of Respiratory and Critical Care Medicine. 2013;188:474–481. doi: 10.1164/rccm.201212-2177OC. [DOI] [PubMed] [Google Scholar]
- 40.West JB. Respiratory Physiology - The Essentials. Baltimore: Williams and Wilkins, Baltimore; 1974. [Google Scholar]
- 41.Zakrzewicz A, Secomb TW, Pries AR. Angioadaptation: keeping the vascular system in shape. News Physiol Sci. 2002;17:197–201. doi: 10.1152/nips.01395.2001. [DOI] [PubMed] [Google Scholar]


