

SUMMARY
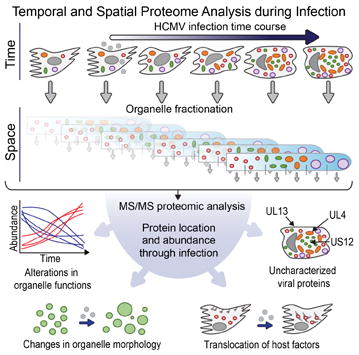
The organelles within a eukaryotic host are manipulated by viruses to support successful virus replication and spread of infection, yet the global impact of viral infection on host organelles is poorly understood. Integrating microscopy, sub-cellular fractionation, mass spectrometry, and functional analyses, we conducted a cell-wide study of organelles in primary fibroblasts throughout the timecourse of human cytomegalovirus (HCMV) infection. We used label-free and isobaric-labeling proteomics to characterize nearly 4,000 host and 100 viral proteins, then classified their specific subcellular locations over time using machine learning. We observed a global reorganization of proteins across the secretory pathway, plasma membrane, and mitochondria, including reorganization and processing of lysosomal proteins into distinct subpopulations and translocations of individual proteins between organelles at specific timepoints. We also demonstrate that MYO18A, an unconventional myosin that translocates from the plasma membrane to the viral assembly complex, is necessary for efficient HCMV replication. This study provides a comprehensive resource for understanding host and virus biology during HCMV pathogenesis.
Keywords: cytomegalovirus, HCMV, organelle, proteomics, spatial
Graphical abstract
INTRODUCTION
Organelles are subcellular structures that can adjust their functions in response to environmental cues through changes in their numbers, motility, localization, shape, and composition. These dynamic properties of organelles are essential for normal cellular functions, being critical in development (Hanna et al., 2013), differentiation (Forni et al., 2016), mitosis (Jongsma et al., 2015), and various forms of stress response (Farber-Katz et al., 2014; Zacharogianni et al., 2014). Consequently, organelle dysfunction is known to be the driver of severe human diseases, including disorders of the mitochondria (Reeve et al., 2013), endoplasmic reticulum (ER) (Kerbiriou et al., 2007), endosomes (Cataldo et al., 2008), lysosomes (Platt et al., 2012), and peroxisomes (Smith and Aitchison, 2013). The link between disease and organelle alterations is also evident in the context of viral infection, as these intracellular pathogens rely on organelles for virus replication and spread.
In general, the replication cycle of a virus, which can last from hours to several days, follows a series of basic, ordered steps. First, viral particles enter the cell to deposit their genetic information. Second, viral gene expression leads to the production of virus and host molecules (i.e., proteins, nucleotides, and lipids) that are necessary components for the formation of new viral particles. Lastly, viral particles are assembled into mature virions that exit the cell and infect neighboring cells. For most human viruses, progression through these steps requires the effective use and manipulation of organelle functions. Many viruses hijack the endosomal machinery to facilitate entry into the cell (Gruenberg and van der Goot, 2006). Upon viral gene expression, viral factors can activate the mitochondria to promote energy production and to regulate central carbon metabolism for the production of new viral components (Vastag et al., 2011). For example, in enveloped viruses, energy and metabolites are used late in infection by the ER, Golgi complex, endosomal system, and plasma membrane to generate lipid membranes for viral envelopes (Lorizate and Krausslich, 2011). Organelles are also necessary for the trafficking of viral proteins to sites of virion maturation (Checkley et al., 2011), as well as for the formation of these virus assembly sites (Alwine, 2012). Upon virion maturation, organelle components facilitate transport and release of the viral progeny (Hogue et al., 2016). Given their dependence on organelle functions, viruses need to actively modulate organelle dynamics throughout the progression of infection either by regulating host protein expression or by targeting viral proteins to specific organelles. Therefore, in addition to complications caused by viral replication, persistent infections can deteriorate organelle health (Kim et al., 2014) and may be a contributing factor to viral-induced pathologies. However, the understanding of the cell-wide viral impact on organelles remains limited, as no study has attempted to characterize global alterations in protein localization and organelle composition during infection.
Among human viruses, human cytomegalovirus (HCMV) has one of the most profound effects on organelle structure and function (Fig 1A). HCMV is an important human pathogen, with an incidence of 50-90% in the adult population (Cannon et al., 2010). It is a leading cause of virus-induced birth defects (Cheeran et al., 2009), a concern in immunocompromised patients (MacGregor et al., 1995), and it has been linked to cardiovascular disease (Courivaud et al., 2013). As described above, a series of organelle alterations occur in the cell to support HCMV replication. The most prominent organelle rearrangement is the formation of an Assembly Complex, a viral-induced structure formed by the reorganization of organelles from the endomembrane system (reviewed by (Alwine, 2012)). The Assembly Complex is observed in infected cells as a juxtanuclear cylindrical body made of endosome-derived vesicles and delimited at its periphery by the Golgi complex. Viral capsids enclosing the viral genome emerge from the nucleus and accumulate at the Assembly Complex to acquire their proteinaceous tegument layer and lipid viral envelope. Once mature, HCMV particles are trafficked to the cell membrane for egress.
Figure 1. Cytoplasmic organelles undergo changes in shape, size, number, and organization following HCMV infection.
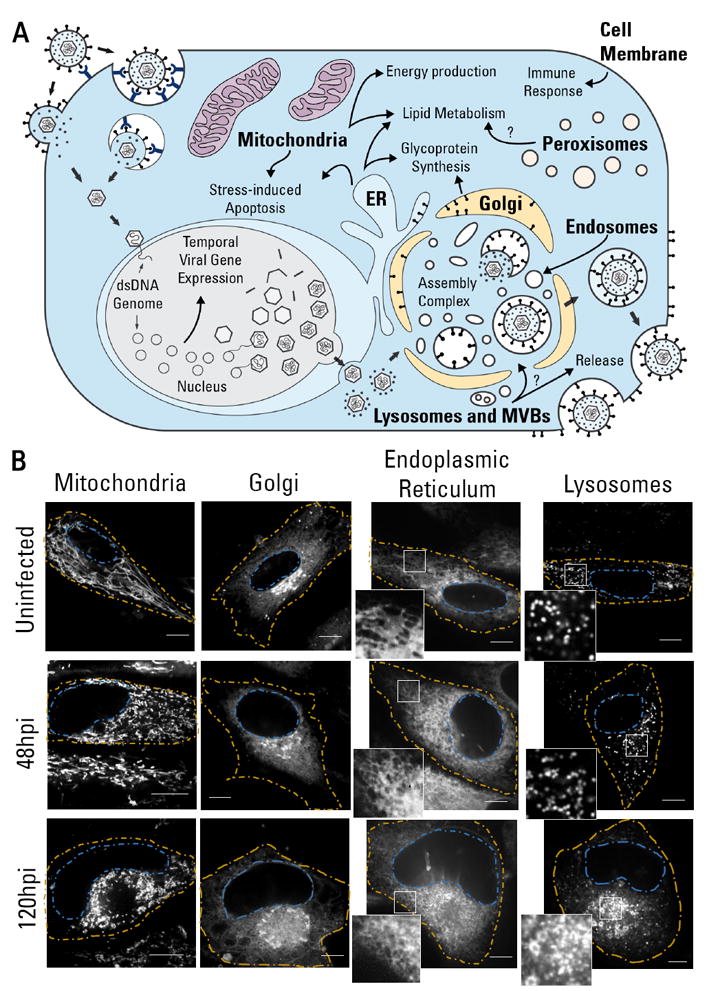
A HCMV life cycle and the functional roles of organelles in viral replication.
B Representative images of the structural reorganization of organelles in HCMV infection (n≥17). Images acquired from live cells (uninfected, 48 hpi, and 120 hpi) stained with dyes specific to each organelle. Yellow - cell periphery; Blue - nuclear periphery. Scale bar = 10μm.
See also movie S1 and fig S1.
Many of the factors responsible for these organelle alterations remain unknown. A global study on organelle alterations is needed to elucidate biological pathways and factors used by HCMV during organelle remodeling. Proteomic studies of HCMV infection have been performed (reviewed in (Jean Beltran and Cristea, 2014)), yet these are either broad analyses of whole cell proteomes with limited spatial information or targeted to a single organelle (Gudleski-O’Regan et al., 2012); Weekes et al., 2014). To understand organelle reorganization, several outstanding questions remain: (i) how organelle proteomes are altered and (ii) to what organelles are viral and host proteins targeted or translocated.
Recent developments in proteomic technologies allow detection of thousands of proteins in multiple subcellular compartments. This technology, referred to as spatial proteomics, uses density-gradient fractionation of organelles followed by mass-spectrometry (MS) analysis to determine the location of proteins based on their gradient profiles (reviewed by (Gatto et al., 2010)). Spatial proteomics has been applied using both label-based (LOPIT by (Dunkley et al., 2004)) or label-free (Foster et al., 2006) MS approaches, and has benefited from advances in the selection of organelle markers and data analysis methods (Christoforou et al., 2016). However, an inherent challenge in using spatial proteomics for studying infected cells is the dynamic nature of a viral infection, as cell changes occur throughout the time course of infection. Therefore, integrating a temporal component into spatial proteomics is required.
Here, we performed the first spatial and temporal analysis of organelles in virally infected cells. We integrated MS-based proteomics, label-free and label-based quantification, live cell microscopy, and functional analyses to determine spatial and temporal alterations in organelles throughout HCMV infection in human fibroblasts. We determine the viral proteins targeted to distinct organelles and define temporal changes in organelle composition, density and motility. We functionally characterize the division of organelles into distinct subpopulations and find translocations required for viral production.
RESULTS
HCMV infection causes changes in organelle structure and dynamics
We first used live fluorescence microscopy to monitor HCMV-induced morphological changes in organelles. Primary human fibroblasts were infected and imaged at 24, 48, 72, 96, and 120 hours post infection (hpi). These time points represent early, intermediate, and late stages of infection, thereby covering the life cycle of the virus. Green fluorescent protein (GFP)-expressing virus strain was used to confirm infection (Fig S1). Using fluorescent dyes to label the mitochondria, Golgi apparatus, ER, and lysosomes, we observed striking changes in organelle phenotypes, as illustrated for 48 and 120 hpi (Fig 1B, Movie S1).
HCMV infection causes mitochondrial fission, triggering anti-apoptotic effects (McCormick et al., 2003) and augmented respiration (Kaarbo et al., 2011). In agreement, mitochondria network fragmentation was observed at 48 hpi, increasing by 120 hpi. Mitochondria displayed elevated motility at 48 hpi, ranging from small movements to translocations across the cell (Movie S1). Mitochondria were excluded from the Assembly Complex, yet appeared enriched and less motile at the Assembly Complex periphery at 120 hpi. A dispersed Golgi was seen at 48 hpi, in contrast to its compact perinuclear arrangement in uninfected cells, which may represent an intermediate step in the process of encircling the Assembly Complex. Later in infection, the Golgi apparatus rearranges as a circle surrounding the Assembly Complex (Das and Pellett, 2011), as we observe at 120 hpi.
As expected (Das and Pellett, 2011), ER labeling was partially excluded from the Assembly Complex late in infection (Fig 1B). We observed increased ER motility at 48 hpi, particularly at the cell periphery (Movie S1). The ER acquires a tubular morphology when associated with cytoskeletal motors that increase its motility (Wozniak et al., 2009). Closer inspection of the ER in HCMV infected cells shows a likely tubular ER morphology, whereas lamellar ER is observed in uninfected cells (Fig 1B). Moreover, the ER became denser as the infection progressed. Since the smooth ER is more tubular, the increase in compact and tubular ER may be a result of the HCMV-induced lipogenesis to increase lipid production capacity at the smooth ER (Yu et al., 2013).
We also observed an increase in lysosome size and abundance at 120 hpi as expected (Das and Pellett, 2011). Additionally, the lysosome dynamics were different between infected and uninfected cells. In a scale of seconds, lysosomes from uninfected cells were virtually immobile, while lysosomes of infected fibroblasts displayed high mobility, with movements ranging from erratic localized movements to translocations across the cell.
Collectively, these live microscopy analyses show the broad impact of viral infection on organelle structure and dynamics, and the suitability of this model system (human fibroblasts) for characterizing organelle remodeling in space and time during infection.
Defining cell-wide organelle alterations by spatial and temporal proteome analysis during infection
To establish the molecular determinants for these structural organelle alterations during HCMV infection, we next designed a hybrid quantitative MS approach (Fig 2). Two complementary quantification methods were used to monitor both protein localization and abundance within organelles throughout infection. One spatial and temporal separated sample was analyzed by label-free quantification (Fig 2A) and another biological replicate sample was quantified by isobaric labeling using tandem mass tags (TMTs) (Fig 2B).
Figure 2. Proteomic approach to define spatial-temporal changes in organelle proteins throughout HCMV infection.
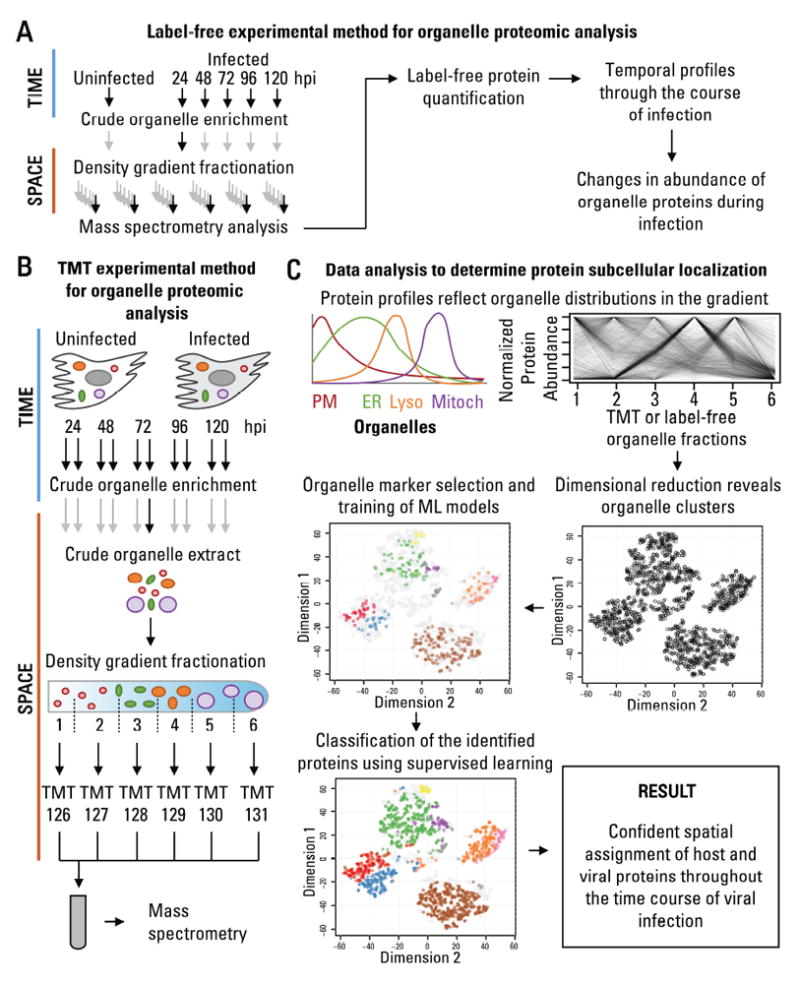
A Workflow to determine temporal changes in organelle proteins throughout infection.
B Workflow to determine changes in the subcellular localization of proteins throughout infection.
C Data analysis to determine protein subcellular localization. The relative abundance between organelle fractions collected using the methods in A or B are inspected by dimensional reduction. Manually-curated organelle markers are used to assess the quality of the organelle separation in the gradient and to determine the identity of each cluster. Organelle markers are used to train machine learning models, which then classify the remaining proteins, resulting in confident spatial assignment of proteins at each time point of viral infection.
See also fig S2.
The HCMV infectious cycle was separated into temporal and spatial components. Temporal separation was achieved by harvesting uninfected and infected fibroblasts throughout infection (24, 48, 72, 96, and 120 hpi). To achieve spatial separation, at each time point, we fractionated crude organelle extracts into six fractions by density gradient ultracentrifugation. The fractions, ranging from the lightest organelles (i.e., the plasma membrane and ER) to high density organelles (i.e., peroxisomes and mitochondria), were next analyzed by MS for protein identification and quantification.
A label-free MS approach was used for quantification of temporal changes in organelle protein abundances during infection (Fig 2A, Table S1). From the 36 spatial-temporal fractions (6 time points X 6 organelle fractions) analyzed, a total of 3,916 host and viral proteins were identified. All fractions in the gradient were quantified for each time point, and infection-induced variations in the fractionation process could be accounted for (discussed below). However, the stochastic nature of label-free quantification limits the spatial resolution, and, although subcellular protein localization could be obtained, we noticed that missing values impacted the reliable protein assignment to organelles (as also discussed in (Gatto et al., 2014a)).
For accurate analysis of the subcellular distribution of proteins at each infection time point we built an additional dataset using TMT-based quantification (Fig 2B and Table S2). The analysis was performed independently in 5 infected samples (24, 48, 72, 96, and 120 hpi), and in 5 parallel uninfected samples to control for possible changes in organelles during culture. The ability to multiplex the analysis using TMTs has the advantage of reduced variability and number of missing values in the quantification for improved accuracy of protein localization. A total of 3,340 proteins passed our quality criteria. The spatial information from this additional dataset compliments the temporal quantification of the label-free dataset.
Protein subcellular location was determined by matching protein profiles in the gradient to known organelle residents (i.e., markers) (Fig 2C). The quality of the selected markers and the data for subcellular localization was assessed by looking at the similarity of marker profiles, using t-Distributed Stochastic Neighbor Embedding (tSNE) for dimensional reduction. In two-dimensional space, as expected, we observed that organelle markers separate within distinct clusters, and an improved separation was seen for the TMT dataset (Fig S2). These organelle markers were then used to build machine learning models and define the subcellular location of the remaining proteins.
Temporal changes in the host organelle proteome throughout infection
The temporally modulated organelle pathways were investigated using hierarchical clustering to separate temporal profiles into five clusters (Fig 3). 796 proteins were downregulated (clusters 4-5), 676 displayed mild changes (cluster 3), and 593 were upregulated (clusters 1-2). Comparison of our results with a previous proteomic study of HCMV-infected whole cell lysates showed high agreement (p-value < 0.0001) for all comparable time points (24 to 96 hpi, Table S1C). The upregulated proteins increased continuously up to 120 hpi, while most downregulated proteins already reached their lower abundances at 48-72 hpi, suggesting that downregulation may be critical early, while upregulation is also important late in infection. We next determined how these abundance changes are reflected within specific organelles (Fig 3B). Both manually-curated organelle markers and the totality of proteins assigned by machine learning to individual organelles were analyzed. Something to consider is that, within each organelle, proteins can have distinct functions that may be differentially regulated during infection. Indeed, some organelles had a larger spread in protein fold changes (e.g., plasma membrane) likely due to multiple functions, while others showed clear trends supported by previous studies (e.g., mitochondria) (Kaarbo et al., 2011). In general, the spread of protein fold changes within organelles increased as infection progressed, suggesting that different proteins within the same organelle are differentially regulated late in infection. For instance, many proteins assigned to Golgi have functions in “intracellular transport” and “membrane organization”, and their levels were upregulated late in infection. In contrast, Golgi markers and assigned proteins with functions in “organic substance transport” had decreased levels late in infection.
Figure 3. Temporal label-free proteomic analysis of organelles throughout HCMV infection.
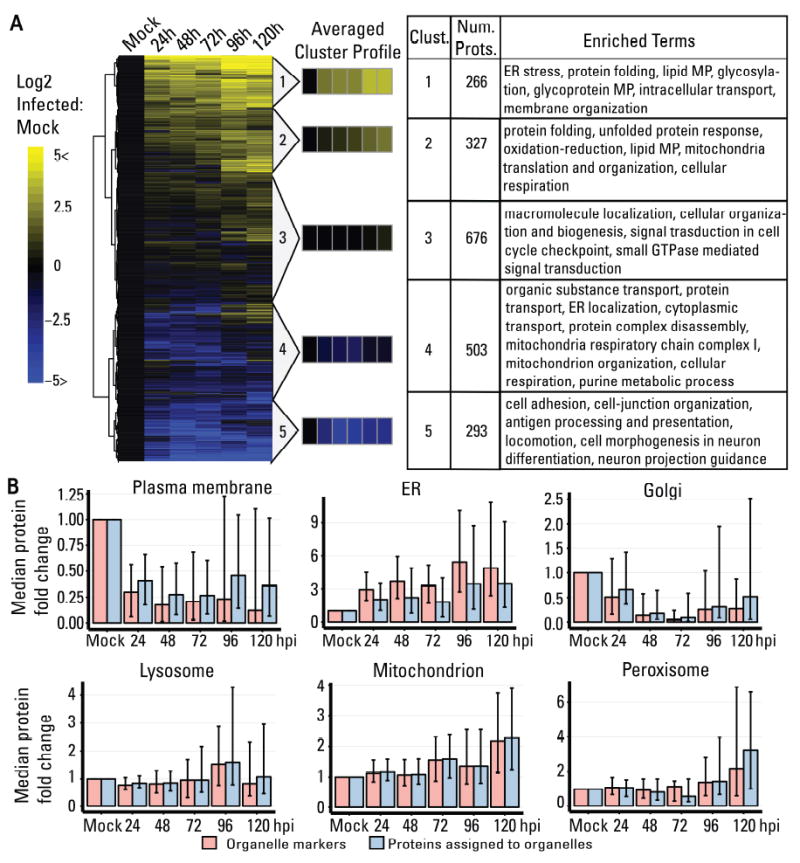
A Heatmap showing temporal changes of organelle proteins throughout infection. Only proteins with no missing values were displayed (2065 proteins). Hierarchical cluster determined five average cluster profiles. Significant gene ontology terms for each cluster are shown. MP = metabolic process.
B Temporal change in protein abundance grouped by organelle for organelle markers (red) and proteins from localizations predicted in this study (blue). The median fold change normalized to uninfected (mock) is displayed with the interquartile range shown as black bars.
Integrating organelle abundance changes (Fig 3B) with gene ontology analysis (Fig 3A, Table S1) provided insights into organelle-specific biological processes modulated by HCMV infection. Upregulated organelle proteins in our results included those functioning in protein folding and lipid metabolism (clusters 1-2, Fig 3A). ER stress response is known to be modulated by HCMV to maintain protein synthesis and induce the cell lipogenic program (Yu et al., 2013). Therefore, it is not surprising that ER proteins were the most upregulated compared to other organelles (Fig 3B), emphasizing a central role for ER in HCMV replication. The upregulated clusters also highlighted biological pathways relevant for viral assembly, maturation, and release. These include glycoprotein metabolism important for viral glycoprotein synthesis (Theiler and Compton, 2002) and intracellular transport and membrane organization important for virion trafficking and formation of the Assembly Complex. Mitochondria-related terms were observed in the upregulated cluster 2 and the downregulated cluster 4, suggesting differential regulation of mitochondria proteins during infection. However, an overall increase in mitochondria proteins was observed late in infection, supporting previous reports on increased mitochondria; biogenesis and selective upregulation of the electron transport chain complex IV (Kaarbo et al., 2011) during HCMV infection. Furthermore, the localization of mitochondria around the Assembly Complex (Fig. 1B) would suggest a role in cytoplasmic virion maturation. The TCA cycle activity of the mitochondria was reported to be modified to direct glucose catabolism towards fatty acid synthesis (Munger et al., 2008), and perhaps its localization is important to feed the lipid biosynthetic pathways for production of viral envelopes. Downregulated proteins were enriched in plasma membrane proteins involved in cell adhesion, cell-junction, and antigen presentation which may aid in viral immune evasion, also explaining their early downregulation. These results are in line with studies on the plasma membrane proteome of HCMV infected cells (Gudleski-O’Regan et al., 2012; Weekes et al., 2014). Also downregulated were several host secretory proteins, RAB5C, SNAP23, and CDC42. Accordingly, these were reported as targets of HCMV-encoded miRNAs, their knockdowns leading to structures resembling the Assembly Complex (Hook et al., 2014).
Spatial organization of the cell proteome throughout HCMV infection
As the TMT dataset provided a better separation of organelle components (Fig S2), it was used to determine the subcellular localization of proteins (Figs 4A and S3). By overlaying manually-curated organelle markers (Table S3), the clustered proteins were identified as plasma membrane, cytosol, ER, Golgi complex, lysosome, mitochondria, and peroxisome groups. Cytosolic proteins remaining after differential centrifugation were observed in the lightest gradient fraction and as a distinct cluster (Fig 4A; blue). By including cytosolic proteins in the rest of our analysis, we distinguished these from genuine organelle residents, yet they were not used in our interpretations as they do not represent the complete cytosol proteome. In infected cells, an additional cluster of nuclear proteins was observed (Fig 4A; grey). This was expected, as during HCMV infection the nucleus increases over 2-fold in diameter (Fig 1) and the nuclear lamina is disrupted, making it prone to rupture during lysis. A set of cytosolic proteins were seen in the densest fraction, having different profiles to cytosolic proteins from lighter fractions (Fig 4A; pink vs blue). These “dense” cytosolic proteins were components of large macromolecular complexes (i.e., proteasomes, ribosomes, cytoskeleton). To facilitate training of machine learning models in infected samples, we included nucleus and “dense” cytosol proteins as additional groups.
Figure 4. Protein subcellular localization assignment using organelle fractionation and alterations in the subcellular organization of lysosomal proteins.
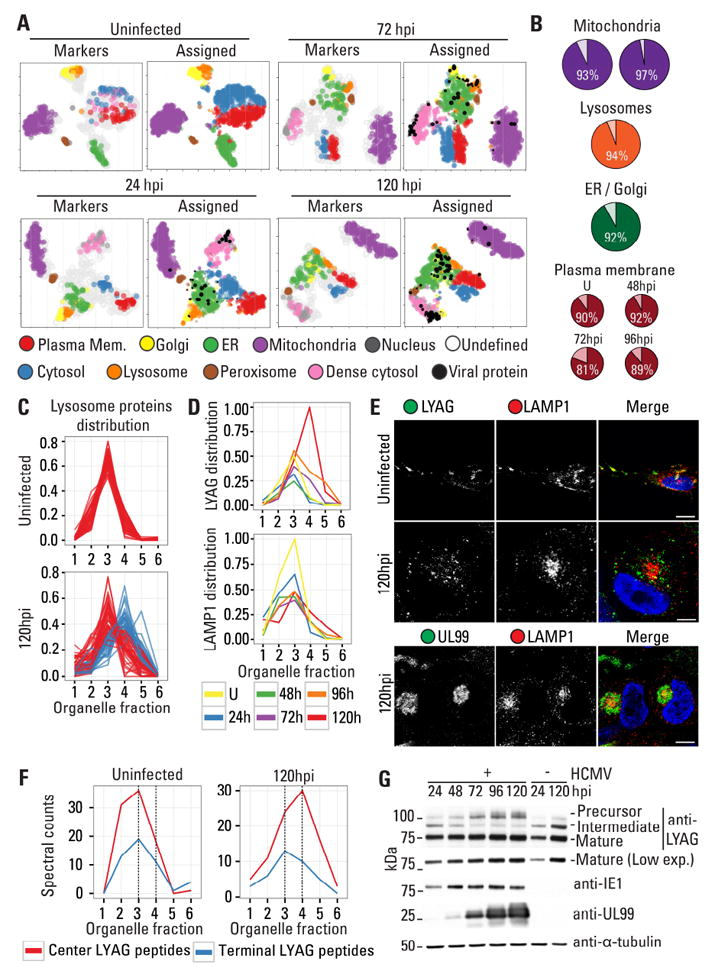
A 2-D representation of subcellular fractionation data using tSNE. The maps were overlaid with organelle markers (left) or assigned subcellular localizations using machine learning (right). Sizes are proportional to the probability scores for assignments. ER = endoplasmic reticulum.
B Percent agreement of the localization assignment with other datasets in uninfected cells for mitochondria (left (Calvo et al., 2016) and right (Rhee et al., 2013)), lysosomes (Lubke et al., 2009), ER/Golgi (Christoforou et al., 2016), and the PM (Weekes et al., 2014).
C Distribution of lysosomal proteins in the density gradient from uninfected and infected (120 hpi) cells. At 120 hpi, two distinct profiles are distinguished in fractions 3 (red) and 4 (blue).
D Distributions of two representative lysosome proteins that either remain in fraction 3 (LAMP1) or shift to fraction 4 (LYAG) at 24, 48, 72, 96, and 120 hpi, and in uninfected cells (U).
E IF images for endogenous LAMP1 and LYAG in uninfected and infected cells. At 120 hpi LAMP1 is enriched at the perinuclear Assembly Complex.
F Distribution of LYAG peptides across the density gradient, originating from precursor ends or the 76kDa mature form.
G WB showing differential LYAG processing at 72 hpi. IE1 (marker for early infection), UL99 (marker for late infection), and tubulin (loading control) are shown.
See also Fig S3, S4, and S5.
To predict subcellular location of non-marker proteins, we assessed the performance of multiple machine learning algorithms: support vector machines (svm), random forest (rf), and model averaged neural networks (nnet)( Fig S4). Nnet was preferred due to its performance and model averaging, which avoids overfitting. The classifier performed better for well-separated organelles (e.g., plasma membrane, mitochondria, and peroxisome). A decrease in performance was observed for the Golgi in infected samples, which was expected given the similarity of its profile to the ER during late infection.
The trained nnet models were then used to predict localization of non-marker proteins, including host and 93 viral proteins (Fig 4A right panels; Table S4), two of which, ORFL147C and ORFL86W, were unconventional HCMV proteins reported by (Stern-Ginossar et al., 2012). These predictions are accompanied by classification probability scores, which indicate the reliability of assignments to organelle groups. Lower scoring classification may indicate multiple localization, technical variability, or subcellular locations not modeled in the classiftying algorithm. To assess the quality of our results, we compared our predictions with previously published datasets of organelle compositions from uninfected cells (Fig 4B). Cross-validation of our mitochondrial predictions with the mitochondrial protein database MitoCarta 2.0 (Calvo et al., 2016) and with the mitochondrial matrix proteomic dataset by (Rhee et al., 2013) resulted in 93% and 97% agreement, respectively. For lysosome predictions, comparison with a manually curated set of lysosome proteins (Lubke et al., 2009) resulted in 94% agreement, and for ER and Golgi predictions, comparison with the LOPIT study of mice stem cells (Christoforou et al., 2016) resulted in 92% agreement, regardless of the difference in species. Lastly, we compared our dataset with a study of the plasma membrane proteome during HCMV infection (Weekes et al., 2014). As the that study was not aimed at defining plasma membrane residents, we used the ratio of peptides identified in the plasma membrane compared to whole cell lysates to identify proteins found predominantly in the plasma membrane. This cross-validation of the two studies resulted in 90% agreement in uninfected cells, and in 92% (48 hpi), 81% (72 hpi), and 89% (96 hpi) agreement during infection.
Our spatial analysis of the cell proteome throughout infection provides insight into several important aspects of viral infection: (i) infection-induced alterations in the global distribution of organelle proteins, (ii) subcellular location of viral proteins throughout infection, and (iii) infection-induced translocation of host proteins between organelles. These aspects were further explored and described in the following sections.
Lysosomes are remodeled into two distinct subpopulations during infection
To determine how organelle components are redistributed upon infection, we monitored the relative abundance across organelle markers in the density gradient. Two distinct redistributions were observed. One, exemplified by the ER and Golgi, is a redistribution from distinct profiles in uninfected cells to co-fractionating profiles during infection (Fig 4A, Mock vs 120 hpi). The opposite was also observed, as proteins from a single organelle divided into two or more distinct profiles upon infection. In the TMT dataset, lysosome proteins formed a single cluster in uninfected cells and early infection, yet two lysosome clusters were seen late in infection (Fig 4A, mock vs 120 hpi). This phenotype was reproducible, as a similar profile separation was observed in our label-free dataset (Fig 4C, Fig S5, and Table S5). This result suggests that a subset of lysosome proteins are redistributed to distinct compartments late in infection.
To test this, we focused on two lysosomal proteins with different profiles during infection, lysosomal alpha-glucosides (LYAG) and lysosome-associated membrane protein 1 (LAMP1). Upon infection, LYAG increased in abundance and shifted to fraction 4, while LAMP1 decreased in abundance and remained in fraction 3 (Fig 4D). The subcellular localization of LAMP1 and LYAG was assessed by immunofluorescence (IF) microscopy (Fig 4E). In uninfected cells these proteins colocalized, while upon infection their distributions became different. LAMP1 was localized to the Assembly Complex (marked by pUL99, Fig 4E), while LYAG was in dispersed punctate structures and did not localize to the Assembly Complex (Fig S5). Thus, the segregation of lysosome proteins into two profiles likely represents their localization to distinct subcellular compartments.
Given the distinct distribution of LYAG, we investigated the functional effect on its processing. LYAG catalyzes the breakdown of glycogen to glucose in lysosomes, and mutations in LYAG lead to a severe glycogen accumulation disorder that primarily affects muscle and liver tissue known as Pompe disease. LYAG is synthesized as a 110kDa precursor in the ER. As it moves to the lysosome, the precursor’s ends are cleaved by proteolysis into a 95kDa intermediate and then into two mature, catalytically active forms of 76 and 70kDa (Moreland et al., 2005). To determine whether the change in LYAG localization during infection was associated with its processing, we monitored LYAG peptides across the density gradient (Fig 4F). In uninfected cells, the spectral counts from LYAG ends (precursor forms) and center (all forms, including the mature form) were enriched in fraction 3. However, in infected cells, an increase in center peptides was observed in fraction 4 starting at 72 hpi, while the end peptides remained in fraction 3 (Fig S5). This suggested that the shift of LYAG center peptides to denser fractions at 72 hpi was due to an increase in the abundance of the mature form. We next investigated the abundance of the LYAG forms throughout infection using western blotting (WB) (Fig 4G). In agreement with the MS results, the abundance of the 95kDa form decreased, while the abundance of the precursor and 76kDa mature form increased in infected cells. This change is dependent on late viral gene expression, as treatment with phosphonoformate (PFA) that inihibits late gene expression rescued LYAG processing (Fig S5). Altogether, our microscopy, MS, and processing analyses demonstrate that LYAG processing is altered by HCMV infection, which may impact its activity late in infection.
Subcellular localization of viral proteins throughout the HCMV life cycle
Next, we investigated the temporal localization of viral proteins to distinct organelles. The 92 viral proteins were represented within a heat map, clustered according to their localizations in parallel to their temporal abundances (Fig 5A). A threshold was set to filter proteins with a low prediction score.
Figure 5. Temporal localizations and abundances of viral proteins throughout infection.
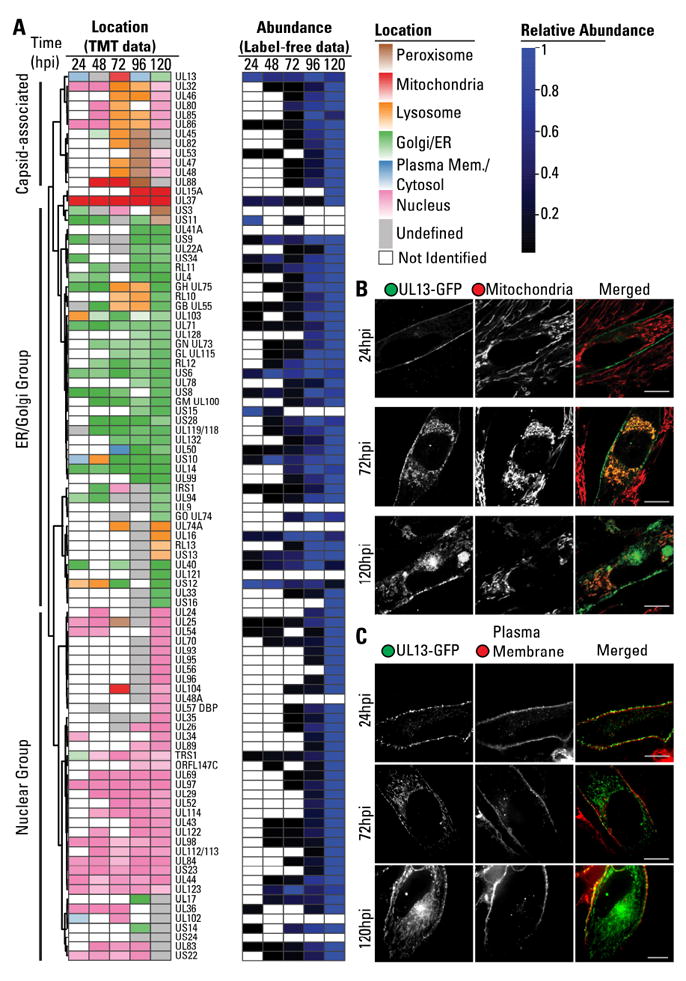
A Heatmap of the subcellular localization of viral proteins and their relative abundances throughout infection. Viral proteins were assigned localization to peroxisomes (brown), mitochondria (red), lysosomes (yellow), Golgi/ER (green), cytosol/PM (blue), and nucleus (pink). Darker colors indicate higher confidence in assignment. Identified proteins that did not pass the score threshold shown grey. Levels are normalized to the most abundant time point.
B UL13-GFP co-localization with mitochondria by live fluorescenct microscopy at 24, 72, and 120 hpi. Scale bar = 10μm.
C UL13-GFP co-localization with plasma membrane by live fluorescenct microscopy at 24, 72, and 120 hpi. Scale bar = 10μm.
See also Fig S6
Numerous viral proteins were observed to localize to the Golgi and ER. This group contained viral membrane glycoproteins involved in virion entry (gB, gH, gL, gM, gN, gO, UL128), IgG binding (UL119, RL 11, and RL12), putative glycoproteins (UL9, UL14, UL74A, UL121), as well as viral proteins with unknown functions (UL4, UL41A, UL132, RL10, and IR13). Viral proteins involved in secondary assembly and egress were also localized to the ER/Golgi (UL71, UL94, UL99, UL103), in agreement with the contribution of these organelles to the viral Assembly Complex. It is likely that some of the uncharacterized proteins assigned to this group function in secondary envelopment or are recruited for virion assembly. Membrane proteins targeted to the plasma membrane were also observed in this group, suggesting detection during synthesis or trafficking. These included glycoproteins (UL16) and G-protein coupled receptors homologues with known (UL33, UL78, US28) or unknown functions (US12, US13, US15, US16). While the abundances of these membrane proteins were higher at late time points (96-120 hpi), the uncharacterized protein US12 was most abundant at 24 hpi, indicating a likely role early in infection. Finally, viral proteins assigned to the ER/Golgi contained immune evasion proteins (UL22, UL40, UL50, US3, US10, US11, US34), including members of the US6 family (US6, US8, US9) that act by sequestration of HLA at the ER.
As expected, several viral proteins were assigned to the mitochondria. UL37 was consistently assigned to the mitochondria at all infection time points, in agreement with its known role in mitochondrial inhibition of apoptosis (McCormick et al., 2003). In addition, the uncharacterized proteins UL88 and UL15A were assigned to the mitochondria early or late in infection, respectively.
A group of viral proteins was also assigned to the nucleus. As expected, this group included proteins involved in capsid assembly, such as the capsid scaffold UL80, and regulators of transcription (UL122, UL123) and viral genome replication (UL44).
A small subset of viral proteins displayed dynamic organelle localizations at different time points of infection. Some of these were virion components, including core capsid (UL46, UL85, UL86), and capsid-associated tegument (UL32, UL45, UL82, UL47, UL48) proteins. Their gradient profiles were similar, indicating that they remain physically associated during fractionation. Since virion proteins were not set as a marker for classification, these are likely assigned to organelles that happen to have similar profiles at each time point. Two other proteins had similar profiles to these capsid components at 96 hpi and 120 hpi. The first is UL53, the NEC2 nuclear egress components, which remains associated with nuclear capsid after release to the cytoplasm. The second protein is UL88, which is predicted to have mitochondria localization at 48-72 hpi. However, UL88 has a profile similar to capsid proteins at 96hpi. Thus, we would predict that UL88 becomes capsid associated late in infection (96-120 hpi), consistent with its detection in purified virions (Varnum et al., 2004).
The dynamic localization observed for one uncharacterized protein was particularly striking to us: UL13, which was predicted to localize to the plasma membrane/cytoplasm at 24 hpi, to the mitochondria at 72 hpi, and then to the plasma membrane and ER/Golgi late in infection. Therefore, we further investigated its localization by live fluorescence microscopy using a virus strain expressing GFP-tagged UL13 (Fig 5B, 5C, and S6). In agreement with our prediction, at 24 hpi UL13-GFP was observed at the plasma membrane. At 72 hpi, UL13-GFP, while partly at plasma membrane, had prominent mitochondrial localization. At 120 hpi, UL13 was observed at the mitochondria, plasma membrane, and the Assembly Complex. The Assembly Complex localization is likely the predominant form detected, explaining its assignment to the ER/Golgi.
Translocation of host proteins upon HCMV infection
We next asked whether the infection process, in addition to altering the global distribution of organelle proteins, also triggers translocations of host proteins from one organelle to another. A protein was considered to translocate if it was consistently assigned to one location in uninfected cells and to a different location upon infection. 374 proteins showed translocation upon infection (Fig 6A-B; Table S6). To ensure that the detected translocations were due to infection rather than cell culture or technical variability, a similar analysis was performed in uninfected samples (Fig S7A; Table S6). Only 53 proteins were detected to translocate in uninfected cells and their patterns were different from infected cells.
Figure 6. Protein translocation upon HCMV infection.
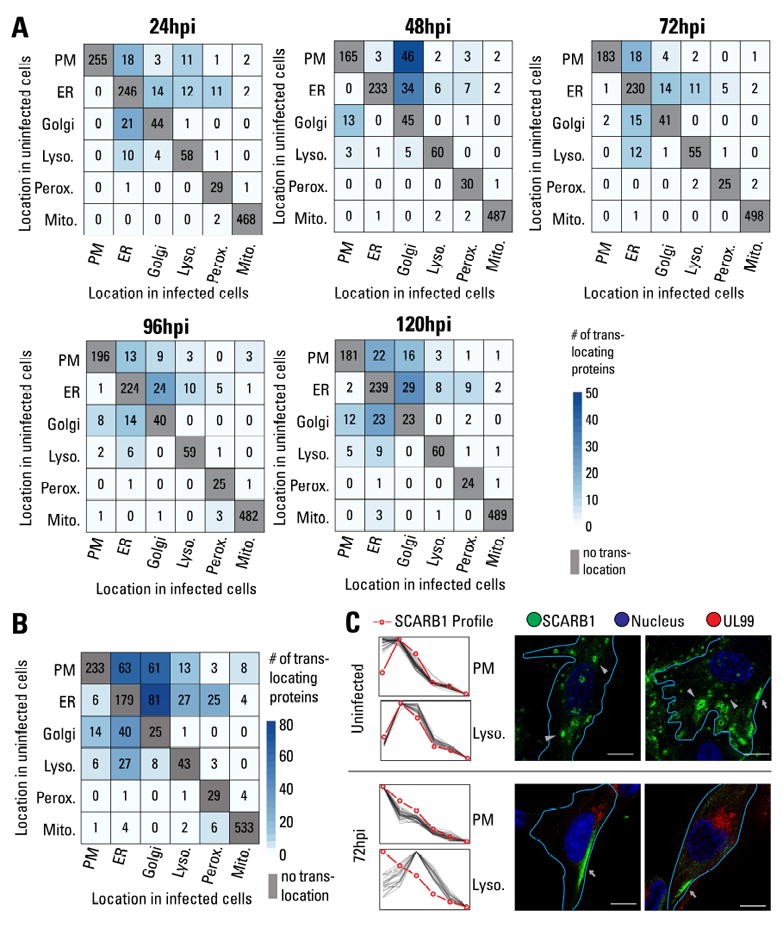
A Heatmap showing the number of translocation events at each time point of infection. Rows indicate location in uninfected samples, and columns indicate localization at a specific time point of infection. PM = plasma membrane.
B Sum of all translocation events throughout the course of infection.
C Profile of SCARB1 compared to plasma membrane (PM) or lysosome markers in uninfected samples and at 72 hpi (left). IF validation of SCARB1 translocation (right). In uninfected cells, SCARB1 is observed at intracellular vesicles (arrowheads) and partially at the PM (arrows). At 96 hpi, SCARB1 primarily localizes to the PM (arrows). Merged images show SCARB1 (green), nucleus (blue), UL99 (infection marker, red), and delineation of the cell periphery (aqua). Scale bar = 10μm.
See also Fig S7.
Most translocations occurred between the plasma membrane, ER, Golgi, and lysosomes. The endomembrane machinery traffics proteins through these organelles during secretion, transport to the cell periphery, or targeting to endosomal compartments, such as lysosomes. It is likely that HCMV alters this machinery, resulting in a large number of protein translocations. In support of our results, the translocation of MICA, a major stress signaling protein, was previously reported (Fielding et al., 2014). Notably, we observe directionality for these translocations; for instance, more proteins are translocated from the plasma membrane to other organelles than in the opposite direction (Fig 6B). In addition, temporality is evident in these translocation events. The number of translocations between the ER and Golgi increases with infection to a total of 52 translocations at 120 hpi. Although the ER and Golgi clusters merged at 120 hpi (Fig 4A), resulting in a decreased performance for Golgi classification, the ER classifier performed adequately (Fig S4). This could lead to an overestimation of Golgi-to-ER translocations. To assess the robustness of the ER vs Golgi classification late in infection, we analyzed the translocations of the markers. Should these translocations derive from poor classification algorithm performance, then random marker translocations may be seen. However, none of the ER markers were assigned to Golgi, while 2 out of 12 Golgi markers were assigned to the ER group at 120 hpi (Table S4). In contrast, when analyzing all proteins (markers and predicted localizations), a significantly larger proportion of Golgi-to-ER translocations (40%) was seen at 120 hpi. Some of these translocations were also seen at earlier times, when the Golgi classifier performed better, suggesting that most Golgi-to-ER translocations are likely not due to poor classification. The large number of translocations in the endomembrane system late in infection is likely associated with Assembly Complex formation. Notably, although the mitochondria contained the largest number of identified proteins, very few translocation events were detected, suggesting that functional alterations in the mitochondria are mainly due to changes in abundances or post-translational modifications.
To test our translocation predictions, we selected two proteins for validation, SCARB1 and MYO18A. The scavenger receptor class B member 1 (SCARB1), a receptor for high density lipoprotein cholesterol is found at the cell periphery and internally (Ji et al., 2011). SCARB1 was predicted to translocate from lysosomes to the plasma membrane during infection (Table S6C and Fig 6C). When visualizing endogenous SCARB1 by IF, in uninfected cells it localized to intracellular vesicles and partially to the plasma membrane. These vesicles had lysosomal properties, as SCARB1 co-localized with LYAG (Fig S7B). In agreement with our MS prediction, at 72hpi SCARB1 localized primarily to the cell periphery, supporting a viral-induced translocation of SCARB1 (Figs 6C and S7C). As cholesterol is required for virion infectivity and infection increases intracellular cholesterol (Gudleski-O’Regan et al., 2012), SCARB1 translocation may be a part of the viral regulation to increase intracellular cholesterol.
MYO18A participates in late stages of HCMV replication
One translocation of interest was that of the unconventional myosin MYO18A. MYO18A is involved in actin retrograde flow at the cell lamella (Tan et al., 2008) and traffic of Golgi-derived vesicles (Farber-Katz et al., 2014). In contrast to typical myosins, MYO18A has a catalytically inactive motor and an N-terminal PDZ domain for protein interactions. MYO18A interacts with conventional class-2 non-muscle myosins (NM2) becoming an adaptor between catalytically active myosins and cellular targets (Billington et al., 2015).
Due to the functional diversity of MYO18A and our evidence for its translocation, we further investigated it during viral infection. While assigned to the plasma membrane in uninfected cells, MYO18A was in the lysosome cluster after infection (Fig 7A). In addition, several host proteins that did not co-fractionate with MYO18A in uninfected samples had similar profiles upon infection (Fig 7A-B). These included the Golgi-localizing COPI tethering protein, GOLGB1, and the NM2 proteins, MYH9 and MYH10. Our results suggest that upon translocation from the plasma membrane, MYO18A may be targeted to NM2- and GOLGB1-intracellular vesicles. Several viral proteins relevant late in infection, such as gB (viral envelope), UL71, and UL99 (tegument and secondary envelopment), also had similar profiles with MYO18A, indicating its possible function late in infection (Fig 7A, C).
Figure 7. MYO18A translocates to the viral Assembly Complex and is important for viral production.

A 2-D visualization for MYO18A gradient profile and its relation to other organelle-assigned proteins.
B Gradient profile for MYO18A, MYO18A-associated host proteins (MYH9/10 and GOLGB1), and markers for the PM and lysosome.
C Gradient profiles for MYO18A, viral proteins with similar profiles, and lysosome markers.
D IF microscopy of MYO18A and Golgi marker (GOLGB1). Anti-MYO18A antibody detects both the full and the truncated (lacking the PDZ domain) isoforms. Scale bar = 10μm.
E Co-staining of MYO18A and UL99 (Assembly Complex marker) by IF under different permeabilization conditions. Scale bar = 10μm.
F RNAi-mediated knockdown of Myo18A decreases infectious particle production, as measured by IE1-positive infectious units (IU) per ml. Error bars show 95% C.I. Statistical significance (**) was assessed by two-sided student t-test for siCtrl vs siMyo18A-1 (p=9.7×10⁻⁵) and siCtrl vs siMyo18A-2 (p=8.9×10⁻⁴).
G Hypothetical model for MYO18A function in HCMV replication.
To confirm MYO18A translocation, we used IF microscopy (Fig 7D). MYO18A enrichment at the plasma membrane was exclusively observed in uninfected cells. At 120 hpi, MYO18A formed punctate intracellular structures, few adjacent to GOLGB1-stained vesicles. We next tested the localization of MYO18A relative to the viral Assembly Complex by assessing its co-localization with UL99 (Fig 7E). UL99 is an Assembly Complex marker and is also observed in vesicular structures co-localized with UL71 outside of the Assembly Complex (Womack and Shenk, 2010). During IF optimization, we noticed that a mild permeabilization of cells (Tween-20) preserved MYO18A staining adjacent to UL99-containing vesicles outside the Assembly Complex, but limited its detection within the Assembly Complex. In strongly permeabilized samples (methanol), MYO18A puncta was consistently observed at the Assembly Complex, co-localized with UL99, and occasionally at the Assembly Complex periphery (Fig 7E; MetOH). These results suggest that MYO18A may associate with late viral vesicles outside the Assembly Complex, and may be involved in viral production or release. To test this, we utilized two different RNAi-mediated knockdowns of MYO18A (Fig 7F, right). MYO18A knockdown resulted in a significant decrease in virus production (Fig 7F, left). In summary, our proteomic and functional analyses demonstrate a new role of MYO18A in HCMV late replication. Our microscopy results validate the translocation predicted by the TMT dataset and are complemented by the functional analysis of MYO18A in infection, demonstrating the potential of this resource in predicting functions in infection for observed organelle protein alterations.
DISCUSSION
The cell is a carefully organized system composed of subcellular components with diverse and specialized functions. Here, we utilized live cell microscopy, quantitative MS-based proteomics, and functional analyses to define the dynamics of organelles upon pathogenic invasion. This multidisciplinary analysis allowed us to (i) establish the viral proteins that target distinct organelles during infection, (ii) monitor temporal changes in organelle protein abundance, (iii) predict alterations in organelle subpopulations, and (iv) determine host proteins that are translocated from one organelle to another upon HCMV infection. Altogether, this study has provided a resource of information for functional analyses aimed to understand organelle function and regulation during infection, and their connection to viral replication and pathogenesis. Two functional avenues further pursued in this study are discussed below.
Spatial rearrangement of lysosomes late in infection
Lysosomes are part of a tightly-regulated membrane trafficking system. In addition to their primary catabolic role, lysosome components can have storage and secretion functions, such as within lysosome-related organelles (LROs). Our results showing two lysosomal subpopulations suggest that HCMV hijacks lysosome components for roles not present in uninfected fibroblasts. The lysosome proteins that shifted to denser fractions were largely involved in carbohydrate catabolism, such as LYAG, thus possibly increasing the vesicle size and/or density through accumulation of non-lipid molecules. In agreement, we (current study) and others observe an increased lysosome size (Das and Pellett, 2011). As HCMV infection increases glycolytic flux (Munger et al., 2008), lysosomes may participate in degrading complex carbohydrates to feed the central carbon metabolism.
The proteins retained in the lighter fractions were mainly lysosome membrane proteins, such as LAMP1, which we observed at the Assembly Complex. Prior studies indicate that lysosome-related pathways may control HCMV assembly or secretion. LAMPs are dynamic, as they can form part of LROs, and LAMP1 can regulate exocytosis (Yogalingam et al., 2008). Furthermore, Rab27a, a regulator of LROs, is required for virus transport (Fraile-Ramos et al., 2010). Finally, depletion of UL71 results in defective final envelopment and accumulation of large vesicles with lysosomal properties (Womack and Shenk, 2010). Therefore, our investigation offers critical information about which lysosomal proteins are differentially regulated, opening new avenues of research to determine lysosome function late in infection.
HCMV-induced translocations and the role of MYO18A in infection
A protein translocation can be defined as a movement from one compartment to another upon a stimulus. Mechanisms for translocation include active targeting or transport between compartments (e.g., nuclear/cytoplasmic shuttling) or compartment-specific changes in abundance (e.g., degradation). Experimentally, translocations can be assessed by microscopy or by measuring changes in abundance between compartments. Here, we determine translocations by comparing the spatial profile of proteins to well-defined markers of organelles. This minimized the effect of sample, technical, and biological variability, such as structural organelle changes induced by infection.
One complication is given by proteins with multiple localizations. For instance, 15% of the proteins in uninfected samples had more than one predicted localization. Although the extent of multi-localizing proteins is not clear, 60% of the human proteins in Uniprot have multiple localization annotations (Gatto et al., 2014a). Therefore, our assignments likely capture the predominant state of the protein in the cell, and many of these proteins could be simultaneously found in multiple organelles. This is exemplified by the viral protein UL13, which was observed in multiple compartments at 72 and 120 hpi, and the host protein SCARB1 in uninfected cells. Although we cannot say with confidence which proteins may be found in multiple compartments, lower assignment scores may result from two or more mixed distributions across the density gradient. This would result in a new joint distribution that differs from the distributions of organelle markers. Finally, translocation events observed upon infection may not necessarily imply that the protein is absent from its original compartment, but rather that its primary location may change.
Our follow up analysis on the translocation of MYO18A demonstrates the functional importance of translocations in infection. Based on our results, we propose a model (Fig 7G) in which MYO18A is translocated to the Assembly Complex to tether viral loaded vesicles and motor proteins like the NM2, MYH9/10. HCMV virions undergo their final envelopment in vesicles that contain both trans-Golgi network (TGN) and endosomal markers, and it is known that MYO18A binds to TGN vesicles (Farber-Katz et al., 2014). As MYO18A is involved in hepatitis C virus secretion (Bishe et al., 2012), this may be a common mechanism for enveloped viruses. HCMV egress is an active process regulated by UL103 (Ahlqvist and Mocarski, 2011), yet it is unknown whether host factors participate in this process. MYO18A function in regulating vesicle movement makes it a good candidate for HCMV egress. Our results highlight the importance for future investigations of MYO18A in the context of viral assembly and egress and as a potential antiviral target to limit HCMV spread.
Supplementary Material
Acknowledgments
We thank T. M. Greco for support with the TMT experiment and Prof. T. Shenk for the UL13-GFP strain. We are grateful for funding from the NIH (grants GM114141 and AI102187) to IMC and a NHMRC of Australia Early CJ Martin Fellowship (APP1037043) to RAM.
Footnotes
AUTHOR CONTRIBUTION
PMJ, RAM, and IMC designed research. PMJ and RAM performed experiments. PMJ, RAM, and IMC analyzed data. PMJ and IMC wrote the manuscript.
Publisher's Disclaimer: This is a PDF file of an unedited manuscript that has been accepted for publication. As a service to our customers we are providing this early version of the manuscript. The manuscript will undergo copyediting, typesetting, and review of the resulting proof before it is published in its final citable form. Please note that during the production process errors may be discovered which could affect the content, and all legal disclaimers that apply to the journal pertain.
References
- Ahlqvist J, Mocarski E. Cytomegalovirus UL103 controls virion and dense body egress. J Virol. 2011;85:5125–5135. doi: 10.1128/JVI.01682-10. [DOI] [PMC free article] [PubMed] [Google Scholar]
- Alwine JC. The human cytomegalovirus assembly compartment: a masterpiece of viral manipulation of cellular processes that facilitates assembly and egress. PLoS Pathog. 2012;8:e1002878. doi: 10.1371/journal.ppat.1002878. [DOI] [PMC free article] [PubMed] [Google Scholar]
- Billington N, Beach JR, Heissler SM, Remmert K, Guzik-Lendrum S, Nagy A, Takagi Y, Shao L, Li D, Yang Y, et al. Myosin 18A coassembles with nonmuscle myosin 2 to form mixed bipolar filaments. Curr Biol. 2015;25:942–948. doi: 10.1016/j.cub.2015.02.012. [DOI] [PMC free article] [PubMed] [Google Scholar]
- Bishe B, Syed GH, Field SJ, Siddiqui A. Role of phosphatidylinositol 4-phosphate (PI4P) and its binding protein GOLPH3 in hepatitis C virus secretion. J Biol Chem. 2012;287:27637–27647. doi: 10.1074/jbc.M112.346569. [DOI] [PMC free article] [PubMed] [Google Scholar]
- Calvo SE, Clauser KR, Mootha VK. MitoCarta2.0: an updated inventory of mammalian mitochondrial proteins. Nucleic Acids Res. 2016;44:D1251–1257. doi: 10.1093/nar/gkv1003. [DOI] [PMC free article] [PubMed] [Google Scholar]
- Cannon MJ, Schmid DS, Hyde TB. Review of cytomegalovirus seroprevalence and demographic characteristics associated with infection. Rev Med Virol. 2010;20:202–213. doi: 10.1002/rmv.655. [DOI] [PubMed] [Google Scholar]
- Cataldo AM, Mathews PM, Boiteau AB, Hassinger LC, Peterhoff CM, Jiang Y, Mullaney K, Neve RL, Gruenberg J, Nixon RA. Down syndrome fibroblast model of Alzheimer-related endosome pathology: accelerated endocytosis promotes late endocytic defects. Am J Pathol. 2008;173:370–384. doi: 10.2353/ajpath.2008.071053. [DOI] [PMC free article] [PubMed] [Google Scholar]
- Checkley MA, Luttge BG, Freed EO. HIV-1 envelope glycoprotein biosynthesis, trafficking, and incorporation. J Mol Biol. 2011;410:582–608. doi: 10.1016/j.jmb.2011.04.042. [DOI] [PMC free article] [PubMed] [Google Scholar]
- Cheeran MC, Lokensgard JR, Schleiss MR. Neuropathogenesis of congenital cytomegalovirus infection: disease mechanisms and prospects for intervention. Clin Microbiol Rev. 2009;22:99–126. doi: 10.1128/CMR.00023-08. Table of Contents. [DOI] [PMC free article] [PubMed] [Google Scholar]
- Christoforou A, Mulvey CM, Breckels LM, Geladaki A, Hurrell T, Hayward PC, Naake T, Gatto L, Viner R, Arias AM, et al. A draft map of the mouse pluripotent stem cell spatial proteome. Nat Commun. 2016;7:9992. doi: 10.1038/ncomms9992. [DOI] [PMC free article] [PubMed] [Google Scholar]
- Courivaud C, Bamoulid J, Chalopin JM, Gaiffe E, Tiberghien P, Saas P, Ducloux D. Cytomegalovirus exposure and cardiovascular disease in kidney transplant recipients. The Journal of infectious diseases. 2013;207:1569–1575. doi: 10.1093/infdis/jit064. [DOI] [PubMed] [Google Scholar]
- Cox J, Mann M. MaxQuant enables high peptide identification rates, individualized p.p.b.- range mass accuracies and proteome-wide protein quantification. Nat Biotechnol. 2008;26:1367–1372. doi: 10.1038/nbt.1511. [DOI] [PubMed] [Google Scholar]
- Das S, Pellett PE. Spatial relationships between markers for secretory and endosomal machinery in human cytomegalovirus-infected cells versus those in uninfected cells. J Virol. 2011;85:5864–5879. doi: 10.1128/JVI.00155-11. [DOI] [PMC free article] [PubMed] [Google Scholar]
- Dunkley TP, Watson R, Griffin JL, Dupree P, Lilley KS. Localization of organelle proteins by isotope tagging (LOPIT) Mol Cell Proteomics. 2004;3:1128–1134. doi: 10.1074/mcp.T400009-MCP200. [DOI] [PubMed] [Google Scholar]
- Farber-Katz SE, Dippold HC, Buschman MD, Peterman MC, Xing M, Noakes CJ, Tat J, Ng MM, Rahajeng J, Cowan DM, et al. DNA damage triggers Golgi dispersal via DNA-PK and GOLPH3. Cell. 2014;156:413–427. doi: 10.1016/j.cell.2013.12.023. [DOI] [PMC free article] [PubMed] [Google Scholar]
- Fielding CA, Aicheler R, Stanton RJ, Wang EC, Han S, Seirafian S, Davies J, McSharry BP, Weekes MP, Antrobus PR, et al. Two novel human cytomegalovirus NK cell evasion functions target MICA for lysosomal degradation. PLoS Pathog. 2014;10:e1004058. doi: 10.1371/journal.ppat.1004058. [DOI] [PMC free article] [PubMed] [Google Scholar]
- Forni MF, Peloggia J, Trudeau K, Shirihai O, Kowaltowski AJ. Murine Mesenchymal Stem Cell Commitment to Differentiation Is Regulated by Mitochondrial Dynamics. Stem Cells. 2016;34:743–755. doi: 10.1002/stem.2248. [DOI] [PMC free article] [PubMed] [Google Scholar]
- Foster LJ, de Hoog CL, Zhang Y, Zhang Y, Xie X, Mootha VK, Mann M. A mammalian organelle map by protein correlation profiling. Cell. 2006;125:187–199. doi: 10.1016/j.cell.2006.03.022. [DOI] [PubMed] [Google Scholar]
- Fraile-Ramos A, Cepeda V, Elstak E, van der Sluijs P. Rab27a is required for human cytomegalovirus assembly. PLoS One. 2010;5:e15318. doi: 10.1371/journal.pone.0015318. [DOI] [PMC free article] [PubMed] [Google Scholar]
- Gatto L, Breckels LM, Burger T, Nightingale DJ, Groen AJ, Campbell C, Nikolovski N, Mulvey CM, Christoforou A, Ferro M, et al. A foundation for reliable spatial proteomics data analysis. Mol Cell Proteomics. 2014a;13:1937–1952. doi: 10.1074/mcp.M113.036350. [DOI] [PMC free article] [PubMed] [Google Scholar]
- Gatto L, Breckels LM, Wieczorek S, Burger T, Lilley KS. Mass-spectrometry-based spatial proteomics data analysis using pRoloc and pRolocdata. Bioinformatics. 2014b;30:1322–1324. doi: 10.1093/bioinformatics/btu013. [DOI] [PMC free article] [PubMed] [Google Scholar]
- Gatto L, Vizcaino JA, Hermjakob H, Huber W, Lilley KS. Organelle proteomics experimental designs and analysis. Proteomics. 2010;10:3957–3969. doi: 10.1002/pmic.201000244. [DOI] [PubMed] [Google Scholar]
- Gruenberg J, van der Goot FG. Mechanisms of pathogen entry through the endosomal compartments. Nat Rev Mol Cell Biol. 2006;7:495–504. doi: 10.1038/nrm1959. [DOI] [PubMed] [Google Scholar]
- Gudleski-O’Regan N, Greco TM, Cristea IM, Shenk T. Increased expression of LDL receptor-related protein 1 during human cytomegalovirus infection reduces virion cholesterol and infectivity. Cell Host Microbe. 2012;12:86–96. doi: 10.1016/j.chom.2012.05.012. [DOI] [PMC free article] [PubMed] [Google Scholar]
- Hanna M, Wang L, Audhya A. Worming our way in and out of the Caenorhabditis elegans germline and developing embryo. Traffic. 2013;14:471–478. doi: 10.1111/tra.12044. [DOI] [PMC free article] [PubMed] [Google Scholar]
- Hogue IB, Scherer J, Enquist LW. Exocytosis of Alphaherpesvirus Virions, Light Particles, and Glycoproteins Uses Constitutive Secretory Mechanisms. MBio. 2016:7. doi: 10.1128/mBio.00820-16. [DOI] [PMC free article] [PubMed] [Google Scholar]
- Hook LM, Grey F, Grabski R, Tirabassi R, Doyle T, Hancock M, Landais I, Jeng S, McWeeney S, Britt W, et al. Cytomegalovirus miRNAs target secretory pathway genes to facilitate formation of the virion assembly compartment and reduce cytokine secretion. Cell Host Microbe. 2014;15:363–373. doi: 10.1016/j.chom.2014.02.004. [DOI] [PMC free article] [PubMed] [Google Scholar]
- Jean Beltran PM, Cristea IM. The life cycle and pathogenesis of human cytomegalovirus infection: lessons from proteomics. Expert Rev Proteomics. 2014;11:697–711. doi: 10.1586/14789450.2014.971116. [DOI] [PMC free article] [PubMed] [Google Scholar]
- Ji A, Meyer JM, Cai L, Akinmusire A, de Beer MC, Webb NR, van der Westhuyzen DR. Scavenger receptor SR-BI in macrophage lipid metabolism. Atherosclerosis. 2011;217:106–112. doi: 10.1016/j.atherosclerosis.2011.03.017. [DOI] [PMC free article] [PubMed] [Google Scholar]
- Jongsma ML, Berlin I, Neefjes J. On the move: organelle dynamics during mitosis. Trends Cell Biol. 2015;25:112–124. doi: 10.1016/j.tcb.2014.10.005. [DOI] [PubMed] [Google Scholar]
- Joshi P, Greco TM, Guise AJ, Luo Y, Yu F, Nesvizhskii AI, Cristea IM. The functional interactome landscape of the human histone deacetylase family. Mol Syst Biol. 2013;9:672. doi: 10.1038/msb.2013.26. [DOI] [PMC free article] [PubMed] [Google Scholar]
- Kaarbo M, Ager-Wick E, Osenbroch PO, Kilander A, Skinnes R, Muller F, Eide L. Human cytomegalovirus infection increases mitochondrial biogenesis. Mitochondrion. 2011;11:935–945. doi: 10.1016/j.mito.2011.08.008. [DOI] [PubMed] [Google Scholar]
- Kerbiriou M, Le Drevo MA, Ferec C, Trouve P. Coupling cystic fibrosis to endoplasmic reticulum stress: Differential role of Grp78 and ATF6. Biochim Biophys Acta. 2007;1772:1236–1249. doi: 10.1016/j.bbadis.2007.10.004. [DOI] [PubMed] [Google Scholar]
- Kim SJ, Syed GH, Khan M, Chiu WW, Sohail MA, Gish RG, Siddiqui A. Hepatitis C virus triggers mitochondrial fission and attenuates apoptosis to promote viral persistence. Proc Natl Acad Sci U S A. 2014;111:6413–6418. doi: 10.1073/pnas.1321114111. [DOI] [PMC free article] [PubMed] [Google Scholar]
- Lorizate M, Krausslich HG. Role of lipids in virus replication. Cold Spring Harb Perspect Biol. 2011;3:a004820. doi: 10.1101/cshperspect.a004820. [DOI] [PMC free article] [PubMed] [Google Scholar]
- Lubke T, Lobel P, Sleat DE. Proteomics of the lysosome. Biochim Biophys Acta. 2009;1793:625–635. doi: 10.1016/j.bbamcr.2008.09.018. [DOI] [PMC free article] [PubMed] [Google Scholar]
- MacGregor RR, Pakola SJ, Graziani AL, Montzka DP, Hodinka RL, Nichols CW, Friedman HM. Evidence of active cytomegalovirus infection in clinically stable HIV-infected individuals with CD4+ lymphocyte counts below 100/microliters of blood: features and relation to risk of subsequent CMV retinitis. J Acquir Immune Defic Syndr Hum Retrovirol. 1995;10:324–330. [PubMed] [Google Scholar]
- McCormick AL, Smith VL, Chow D, Mocarski ES. Disruption of mitochondrial networks by the human cytomegalovirus UL37 gene product viral mitochondrion-localized inhibitor of apoptosis. J Virol. 2003;77:631–641. doi: 10.1128/JVI.77.1.631-641.2003. [DOI] [PMC free article] [PubMed] [Google Scholar]
- Moorman NJ, Sharon-Friling R, Shenk T, Cristea IM. A targeted spatial-temporal proteomics approach implicates multiple cellular trafficking pathways in human cytomegalovirus virion maturation. Mol Cell Proteomics. 2010;9:851–860. doi: 10.1074/mcp.M900485-MCP200. [DOI] [PMC free article] [PubMed] [Google Scholar]
- Moreland RJ, Jin X, Zhang XK, Decker RW, Albee KL, Lee KL, Cauthron RD, Brewer K, Edmunds T, Canfield WM. Lysosomal acid alpha-glucosidase consists of four different peptides processed from a single chain precursor. J Biol Chem. 2005;280:6780–6791. doi: 10.1074/jbc.M404008200. [DOI] [PubMed] [Google Scholar]
- Munger J, Bennett BD, Parikh A, Feng XJ, McArdle J, Rabitz HA, Shenk T, Rabinowitz JD. Systems-level metabolic flux profiling identifies fatty acid synthesis as a target for antiviral therapy. Nat Biotechnol. 2008;26:1179–1186. doi: 10.1038/nbt.1500. [DOI] [PMC free article] [PubMed] [Google Scholar]
- Platt FM, Boland B, van der Spoel AC. The cell biology of disease: lysosomal storage disorders: the cellular impact of lysosomal dysfunction. J Cell Biol. 2012;199:723–734. doi: 10.1083/jcb.201208152. [DOI] [PMC free article] [PubMed] [Google Scholar]
- Reeve A, Meagher M, Lax N, Simcox E, Hepplewhite P, Jaros E, Turnbull D. The impact of pathogenic mitochondrial DNA mutations on substantia nigra neurons. J Neurosci. 2013;33:10790–10801. doi: 10.1523/JNEUROSCI.3525-12.2013. [DOI] [PMC free article] [PubMed] [Google Scholar]
- Reimand J, Kull M, Peterson H, Hansen J, Vilo J. g:Profiler--a web-based toolset for functional profiling of gene lists from large-scale experiments. Nucleic Acids Res. 2007;35:W193–200. doi: 10.1093/nar/gkm226. [DOI] [PMC free article] [PubMed] [Google Scholar]
- Rhee HW, Zou P, Udeshi ND, Martell JD, Mootha VK, Carr SA, Ting AY. Proteomic mapping of mitochondria in living cells via spatially restricted enzymatic tagging. Science. 2013;339:1328–1331. doi: 10.1126/science.1230593. [DOI] [PMC free article] [PubMed] [Google Scholar]
- Silva MC, Yu QC, Enquist L, Shenk T. Human cytomegalovirus UL99-encoded pp28 is required for the cytoplasmic envelopment of tegument-associated capsids. J Virol. 2003;77:10594–10605. doi: 10.1128/JVI.77.19.10594-10605.2003. [DOI] [PMC free article] [PubMed] [Google Scholar]
- Smith JJ, Aitchison JD. Peroxisomes take shape. Nat Rev Mol Cell Biol. 2013;14:803–817. doi: 10.1038/nrm3700. [DOI] [PMC free article] [PubMed] [Google Scholar]
- Stern-Ginossar N, Weisburd B, Michalski A, Le VT, Hein MY, Huang SX, Ma M, Shen B, Qian SB, Hengel H, et al. Decoding human cytomegalovirus. Science. 2012;338:1088–1093. doi: 10.1126/science.1227919. [DOI] [PMC free article] [PubMed] [Google Scholar]
- Tan I, Yong J, Dong JM, Lim L, Leung T. A tripartite complex containing MRCK modulates lamellar actomyosin retrograde flow. Cell. 2008;135:123–136. doi: 10.1016/j.cell.2008.09.018. [DOI] [PubMed] [Google Scholar]
- Theiler RN, Compton T. Distinct glycoprotein O complexes arise in a post-Golgi compartment of cytomegalovirus-infected cells. J Virol. 2002;76:2890–2898. doi: 10.1128/JVI.76.6.2890-2898.2002. [DOI] [PMC free article] [PubMed] [Google Scholar]
- van der Maaten L, Hinton G. Visualizing Data using t-SNE. J Mach Learn Res. 2008;9:2579–2605. [Google Scholar]
- Varnum SM, Streblow DN, Monroe ME, Smith P, Auberry KJ, Pasa-Tolic L, Wang D, Camp DG, 2nd, Rodland K, Wiley S, et al. Identification of proteins in human cytomegalovirus (HCMV) particles: the HCMV proteome. J Virol. 2004;78:10960–10966. doi: 10.1128/JVI.78.20.10960-10966.2004. [DOI] [PMC free article] [PubMed] [Google Scholar]
- Vastag L, Koyuncu E, Grady SL, Shenk TE, Rabinowitz JD. Divergent effects of human cytomegalovirus and herpes simplex virus-1 on cellular metabolism. PLoS Pathog. 2011;7:e1002124. doi: 10.1371/journal.ppat.1002124. [DOI] [PMC free article] [PubMed] [Google Scholar]
- Vizcaino JA, Csordas A, Del-Toro N, Dianes JA, Griss J, Lavidas I, Mayer G, Perez-Riverol Y, Reisinger F, Ternent T, et al. 2016 update of the PRIDE database and its related tools. Nucleic Acids Res. 2016;44:D447–456. doi: 10.1093/nar/gkv1145. [DOI] [PMC free article] [PubMed] [Google Scholar]
- Wang D, Bresnahan W, Shenk T. Human cytomegalovirus encodes a highly specific RANTES decoy receptor. Proc Natl Acad Sci U S A. 2004;101:16642–16647. doi: 10.1073/pnas.0407233101. [DOI] [PMC free article] [PubMed] [Google Scholar]
- Weekes MP, Tomasec P, Huttlin EL, Fielding CA, Nusinow D, Stanton RJ, Wang EC, Aicheler R, Murrell I, Wilkinson GW, et al. Quantitative temporal viromics: an approach to investigate host-pathogen interaction. Cell. 2014;157:1460–1472. doi: 10.1016/j.cell.2014.04.028. [DOI] [PMC free article] [PubMed] [Google Scholar]
- Womack A, Shenk T. Human cytomegalovirus tegument protein pUL71 is required for efficient virion egress. MBio. 2010;1 doi: 10.1128/mBio.00282-10. [DOI] [PMC free article] [PubMed] [Google Scholar]
- Wozniak MJ, Bola B, Brownhill K, Yang YC, Levakova V, Allan VJ. Role of kinesin-1 and cytoplasmic dynein in endoplasmic reticulum movement in VERO cells. J Cell Sci. 2009;122:1979–1989. doi: 10.1242/jcs.041962. [DOI] [PMC free article] [PubMed] [Google Scholar]
- Yogalingam G, Bonten EJ, van de Vlekkert D, Hu H, Moshiach S, Connell SA, d’Azzo A. Neuraminidase 1 is a negative regulator of lysosomal exocytosis. Dev Cell. 2008;15:74–86. doi: 10.1016/j.devcel.2008.05.005. [DOI] [PMC free article] [PubMed] [Google Scholar]
- Yu Y, Pierciey FJ, Jr, Maguire TG, Alwine JC. PKR-like endoplasmic reticulum kinase is necessary for lipogenic activation during HCMV infection. PLoS Pathog. 2013;9:e1003266. doi: 10.1371/journal.ppat.1003266. [DOI] [PMC free article] [PubMed] [Google Scholar]
- Zacharogianni M, Gomez AA, Veenendaal T, Smout J, Rabouille C. A stress assembly that confers cell viability by preserving ERES components during amino-acid starvation. Elife. 2014;3 doi: 10.7554/eLife.04132. [DOI] [PMC free article] [PubMed] [Google Scholar]
- Zhu H, Shen Y, Shenk T. Human cytomegalovirus IE1 and IE2 proteins block apoptosis. J Virol. 1995;69:7960–7970. doi: 10.1128/jvi.69.12.7960-7970.1995. [DOI] [PMC free article] [PubMed] [Google Scholar]
Associated Data
This section collects any data citations, data availability statements, or supplementary materials included in this article.