Abstract
Background
Motion artifacts pose significant problems for the acquisition of MR images in pediatric populations.
Objective
To evaluate temporal motion metrics in MRI scanners and their effect on image quality in pediatric populations in neuroimaging studies.
Materials and methods
We report results from a large pediatric brain imaging study that shows the effect of motion on MRI quality. We measured motion metrics in 82 pediatric patients, mean age 13.4 years, in a T1-weighted brain MRI scan. As a result of technical difficulties, 5 scans were not included in the subsequent analyses. A radiologist graded the images using a 4-point scale ranging from clinically non-diagnostic because of motion artifacts to no motion artifacts. We used these grades to correlate motion parameters such as maximum motion, mean displacement from a reference point, and motion-free time with image quality.
Results
Our results show that both motion-free time (as a ratio of total scan time) and average displacement from a position at a fixed time (when the center of k-space was acquired) were highly correlated with image quality, whereas maximum displacement was not as good a predictor. Among the 77 patients whose motion was measured successfully, 17 had average displacements of greater than 0.5 mm, and 11 of those (14.3%) resulted in non-diagnostic images. Similarly, 14 patients (18.2%) had less than 90% motion-free time, which also resulted in non-diagnostic images.
Conclusion
We report results from a large pediatric study to show how children and young adults move in the MRI scanner and the effect that this motion has on image quality. The results will help the motion-correction community in better understanding motion patterns in pediatric populations and how these patterns affect MR image quality.
Keywords: Artifacts, Brain, Children, Motion measurements, Motion, Magnetic resonance imaging
Introduction
Motion is the most prevalent MRI artifact that results in non-diagnostic brain scans, especially in pediatric populations. In current clinical practice, most young children are either sedated or anesthetized in order to have a successful imaging session. However concern has been raised about possible long-term adverse effects resulting from sedation and anesthesia [1–4]. For example, a recent report stated that 8.6% of all children under sedation/anesthesia experienced an adverse event, most of which were minor, and 57.7% of those events occurred during MRI scans, more often than any other ordered procedure [5]. In view of studies such as this, there is an increasing need to develop techniques for motion-robust MRI in young patients to help avoid using sedation in these patients. In some cases where sedation is not possible because of a child's health condition, CT is used, but CT includes radiation exposure and has poor contrast in the brain. The need for sedation also limits the use of MRI in pediatric research studies because sedation and anesthesia are generally considered to present greater than minimal risk to subjects.
Although motion is a known source of artifacts in pediatric MRI, in clinical practice many scans containing motion artifacts are still used for routine evaluation and diagnosis. Because some of these studies are accepted as diagnostic and some are not, it's very important to understand what types of motion lead to acceptable images and which types do not. The purpose of this study was to better understand what patterns of motion lead to pediatric brain MRI scans with diagnostic images. To study this, we prospectively measured motion in 82 T1-weighted pediatric brain scans with electromagnetic motion trackers in real time and retrospectively performed a blind radiologic evaluation of the quality of each scan's images. We computed several metrics from the motion measurements that summarized the statistics of motion in each scan, and we evaluated the relationship between those statistics and the radiologic evaluations.
Certain aspects of the problem of motion have been studied extensively. For example, numerous approaches have been published on the topic of motion correction in MRI [6–13], such as PROPELLER (Periodically Rotated Overlapping Parallel Lines with Enhanced Reconstruction) [11]. Some of these methods, such as navigators and PROPELLER, are used in clinical practice, but none completely eliminates this source of artifacts in widespread clinical practice. Some studies have shown the effects of motion in functional MRI [14, 15] and diffusion tensor imaging [16] and in volumetric studies [17]. Although these are interesting studies showing how motion can create artifacts in brain function and structure analysis, they do not answer how much and what types of motion are expected in a pediatric population. Such statistics would be helpful in motion-correction literature to establish thresholds in guiding motion correction. They also might be used to help identify non-diagnostic scans before the acquisition is completed. The goal of this paper is to contribute our findings in this area to help elucidate how these different aspects of motion affect everyday radiology practice.
Materials and methods
Patient population
The study was performed at our hospital from January 2015 to September 2015. The institutional review board approved this study and waived the need for informed consent. A total of 82 pediatric patients (38 males, 44 females) were successively recruited from the outpatient facility and were scanned while real-time motion measurements were recorded. Mean age of the group was 13.4 years, with a minimum of 5 years and a maximum of 24 years. Patients were selected from those who required a brain screen study and were cleared to be scanned without sedation or anesthesia. Clearance was done by a verbal evaluation by a nursing team and was based on the ability to follow instructions. Five scans were removed from the study because of technical problems with the motion measurement system, i.e. the system reported errors or we encountered difficulties with sensor placement. This resulted in a cohort of 77 patients (35 males, 42 females), with a mean age of 13.3 years and standard deviation of 4.1 years.
Motion measurement system
Motion was measured using an electromagnetic tracker [18] developed by Robin Medical Inc. (Baltimore, MD). The tracker had two sensors, which were attached to the tracking system by wires that were placed on subjects' foreheads and whose locations and orientations were recorded in real time. We used a modified T1-weighted 3-D gradient recalled echo (GRE) sequence as our test sequence. The product sequence was modified to include short- and low-amplitude bipolar gradients in the x-y-z axes after each radiofrequency pulse. The sensors used these gradients to measure the changes in the magnetic field and estimate motion parameters. At each point where an activation gradient was played out, the system reported three parameters defining the x-y-z position for each sensor, relative to the isocenter of the magnet, and two additional vectors defining the orientation of the sensor in 3-D space. Under the assumption of rigid body motion, the distance between the two sensors should remain constant, and therefore this was used as a measure of error in the system or to detect detached sensors. The other components of the motion tracking system were located in the scanner room, where all data were processed, recorded and communicated to a user interface showing tracking results in real time. We found that the tracking system had an accuracy of +/- 0.1 mm in prior phantom experiments. For this work we defined displacement as the 3-D vector between two positions, calculated as the Euclidean distance for each sensor and reported as the mean displacement of the two sensors.
MR image acquisition
The study was done on a 3-T TRIO scanner (Siemens Healthcare, Erlangen, Germany). A 32-channel head coil was used and padding was placed between each subject's head and coil to reduce motion, as is typically done in clinical practice. Each patient was first scanned with a standard clinical brain screen protocol consisting of a T1-weighted magnetization-prepared rapid gradient echo (MP-RAGE) sequence, a T2-weighted fast spin echo (FSE) sequence, a T2-weighted fluid-attenuated inversion recovery (FLAIR) sequence and a 30-direction diffusion-weighted scan. The motion-tracked T1-weighted 3-D GRE sequence was acquired after these sequences. Sequence parameters for this scan were echo time/repetition time (TE/TR) 2.93/15 ms, flip angle 20°, with a 1-mm isotropic resolution. Field of view was 220 mm with a matrix size of 220, and parallel imaging was used with an acceleration factor of 2. This scan was acquired in the same sagittal orientation as the MP-RAGE sequence and the phase-encoding direction was anterior-posterior. The scan time for the motion-tracked sequence was the same as that of the MP-RAGE sequence, 5 min 40 s. The total scan time of the study was 30–45 min.
Data acquisition and analysis
All motion measurement data and MR images were analyzed retrospectively. We used three criteria to characterize motion: maximum displacement from a reference position, mean displacement from a reference position, and motion-free time. The reference position for each scan was set as the position when the center of k-space was acquired, which happens in the middle of the scan. This choice resulted in a larger weighting for motion that happened near the acquisition of the center of k-space. This reference position was chosen because motion that happens during the acquisition of low frequencies in k-space generates larger motion artifacts. Motion-free time was defined as the percentage of the scan duration for which the position was less than 0.2-mm from the reference position. Additionally, the age and gender of each patient were noted and used for analysis of the effect of these parameters on the motion statistics. The sample size led us to divide patients into 3 age groups: (1) younger than 10 years, (2) 10–16 years and (3) older than 16 years.
Radiologic evaluation
A radiologist with more than 15 years of experience graded the scans according to the severity of their motion artifacts, using a Likert scale [19] of 1 to 4: (1) images contain severe motion artifacts and cannot be used for diagnosis, (2) images contain motion artifacts but can be used for gross diagnostic implications, (3) images contain some motion artifacts and can be used for diagnostic purposes and (4) images do not contain visible motion artifacts. We used these grades to classify what kind of motion patterns might result in non-diagnostic images.
Statistical analysis
For each motion metric, we applied a statistical test to determine whether the metric correlates with the radiologic evaluation grade and calculated a P-value to find out whether it is statistically significant. Also we applied a Student's t-test to gender and age data to determine whether the difference in motion parameters is statistically different between these groups. We also calculated the 25th and 75th percentiles of each motion measurement for each motion grade and age group, and also the 95% confidence intervals.
Results
Representative images from each grade category are shown in sagittal, axial and coronal views in Fig. 1.
Fig. 1.
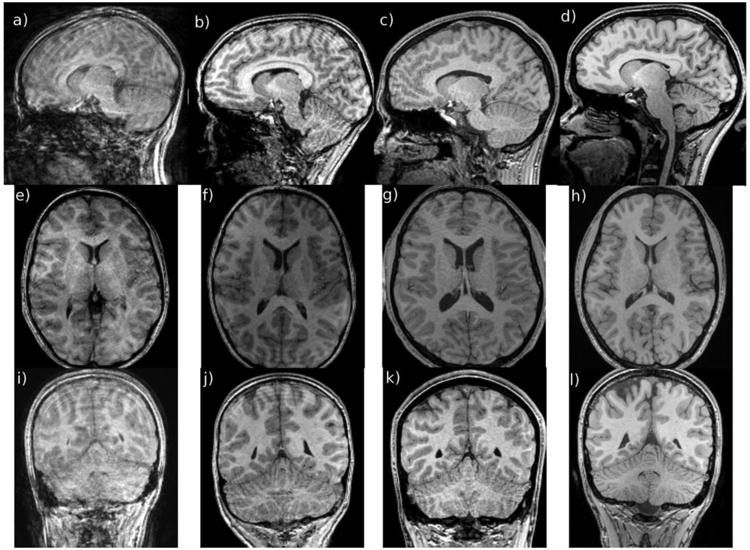
Examples of images with different motion grades, as evaluated by a radiologist with more than 15 years of experience, shown in sagittal (a–d), axial (e–h) and coronal (i–l) orientations. Image grade increases from left (1, meaning non-diagnostic because of motion artifacts, here in a 13-year-old boy) to right (4, meaning no visible motion artifacts, here in a 17-year-old boy). Image grades corresponding to 2 and 3 were from a 14-year-old boy and a 16-year-old girl
Figure 2 shows motion measurements corresponding to the cases from Fig. 1, with different motion grades from 1 (top) to 4 (bottom). The y-axis shows the sensor displacement from the reference position for the whole scan, whose duration was 5 min 40 s. The x-axis shows the time sample index. In this particular sequence, the number of time samples was equal to the number of radiofrequency pulses in the sequence because the sequence had extra gradients that were played out after each radiofrequency pulse. Therefore the sampling period was equal to a repetition time of 15 ms.
Fig. 2.
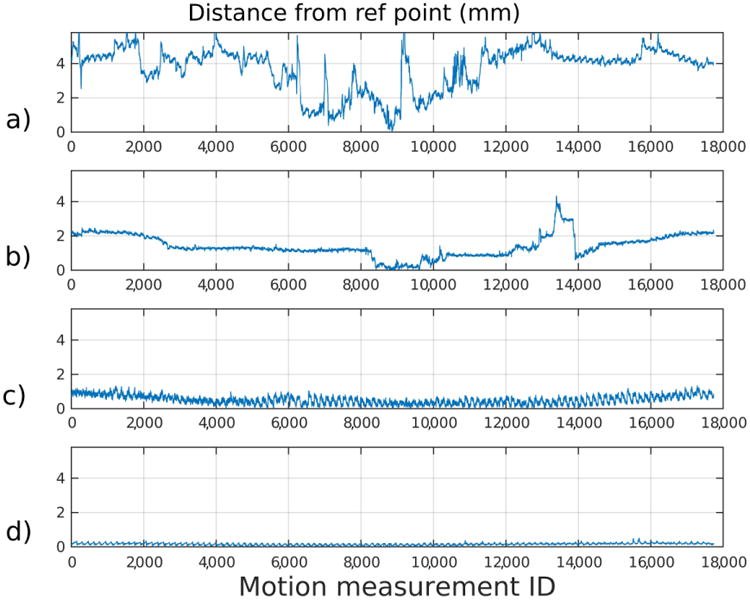
Sensor motion displayed in millimeters (mm) from the same children as shown in Fig. 1, ordered vertically according to image grade (a grade 1, b grade 2, c grade 3, d grade 4). The y-axis shows the sensor displacement from the reference position for the whole scan. The x-axis shows the time sample index. The motion shown in (a) resulted in a non-diagnostic image (in a 13-year-old boy), whereas the motion shown (d) resulted in an image evaluated as containing “no visible motion artifacts” (in a 17-year-old boy). Image grades corresponding to 2 and 3 were from 14-year old male and 16-year old female.
Figure 3 summarizes our findings about the relationship between the motion criteria and the motion artifact grades. The median motion-free times, as a ratio of total scan duration, for grades 1 to 4 were 0.38, 0.74, 0.96 and 0.99, respectively. The median mean displacements from the reference point were 1.63 mm for grade 1, 0.68 mm for grade 2, 0.41 mm for grade 3 and 0.28 mm for grade 4. Finally, the median of maximum displacements from the reference point were 3.7 mm for grade 1, 2.01 mm for grade 2, 1.15 mm for grade 3 and 0.81 mm for grade 4. The average displacements and motion-free times showed higher correlation (Pearson correlation coefficient of 0.77 and 0.75) with the radiologic evaluation and were statistically significant (P<0.001 for each metric), whereas maximum displacements showed lower correlation (Pearson correlation coefficient of 0.59) and were not statistically significant (P=0.31). Median, standard deviation and number of subjects for each grade can be found in Table 1.
Fig. 3.
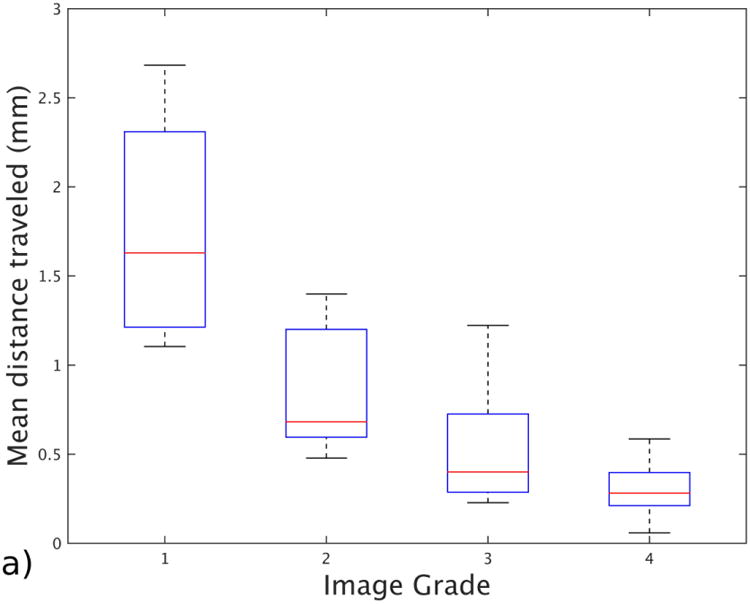

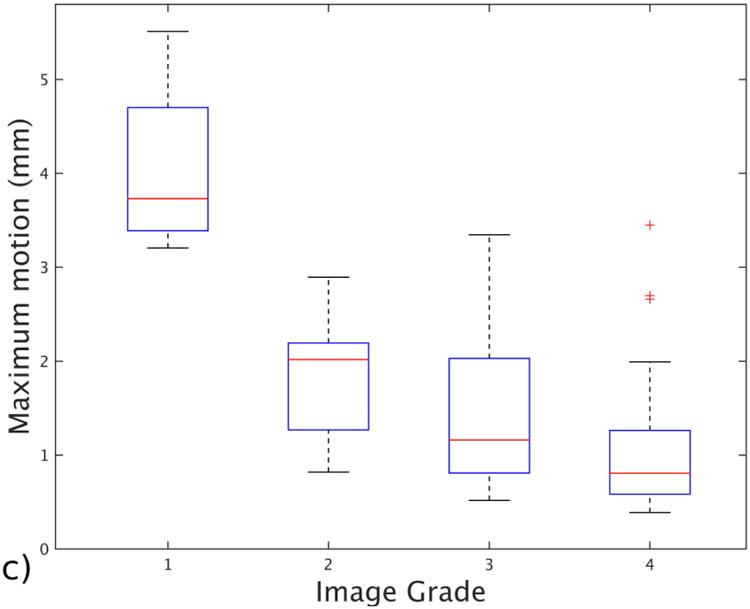
Box and whisker plot shows the effect of different motion statistics on image grade assigned by a radiologist with more than 15 years of experience. a Image shows mean distance traveled from the reference point for each grade group. b Image shows motion-free time as a ratio for each grade. c Image shows maximum displacement recorded for patients in each grade group. The bars show the 25th and 75th percentiles of each motion measurement for each motion grade, and brackets show the 95% confidence intervals
Table 1. The relationship between motion statistics and the radiologic evaluation, reported as median ± standard deviation.
| Grade 1 (n=6) | Grade 2 (n=8) | Grade 3 (n=19) | Grade 4 (n=44) | |
|---|---|---|---|---|
| Mean distance traveled (mm) | 1.63 ± 0.71 | 0.68 ± 0.36 | 0.41 ± 0.31 | 0.28 ± 0.31 |
| Motion-free time (ratio) | 0.38 ± 0.21 | 0.74 ± 0.27 | 0.97 ± 0.17 | 0.99 ± 0.03 |
| Maximum motion (mm) | 3.71 ± 1.02 | 2.01 ± 0.65 | 1.15 ± 1.37 | 0.81 ± 0.64 |
Figure 4 summarizes the relationship between the age of the subjects and their motion statistics. The median motion-free time ratio was 0.96 for group 1 (ages <10), 0.98 for group 2 (ages 11–16) and 0.99 for group 3 (ages >16). Median ages for each group were 7.8 years, 13.1 years and 17.2 years. The median of the mean displacements for the same groups were 0.43 mm for the youngest group, 0.34 mm for the middle group and 0.31 mm for the oldest group. The medians of the maximum displacements for these groups were 1.19 mm for the youngest, 0.82 mm for the middle and 1.11 mm for the oldest. None of the metrics showed a significant correlation with the age groups: P-value was 0.1 for motion-free time ratio, 0.07 for mean displacement and 0.5 for maximum displacement. Median, standard deviation and number of subjects for each age group can be found in Table 2.
Fig. 4.
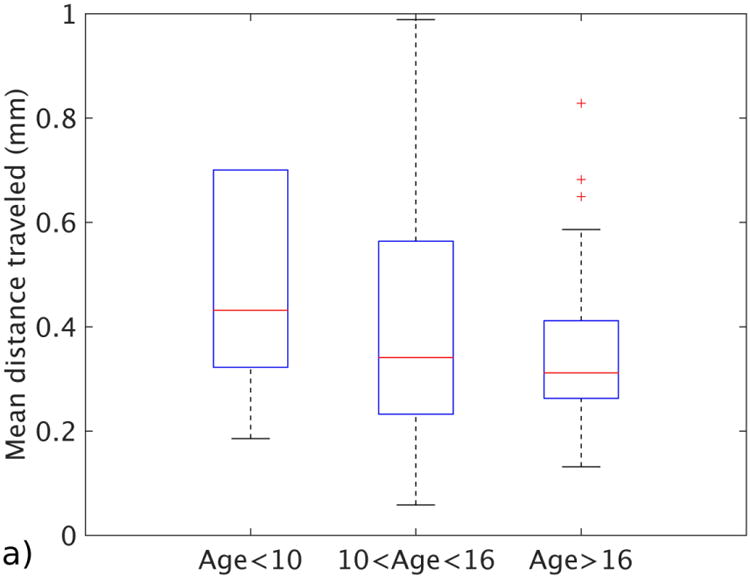
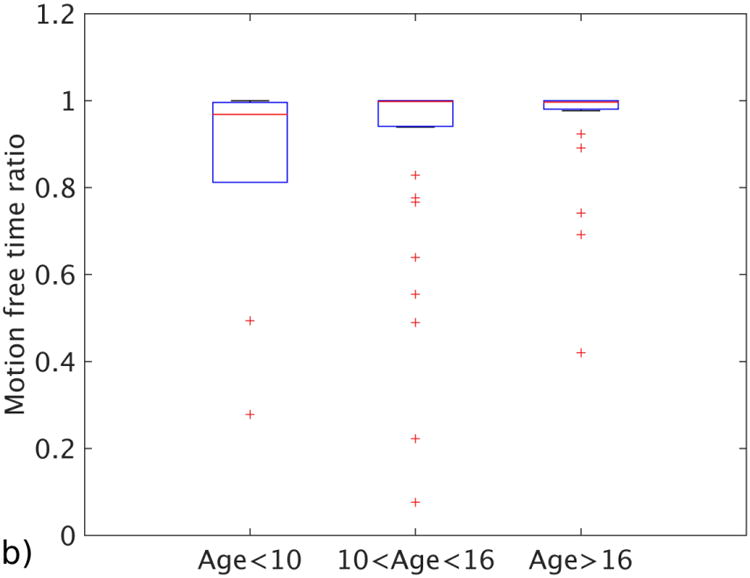
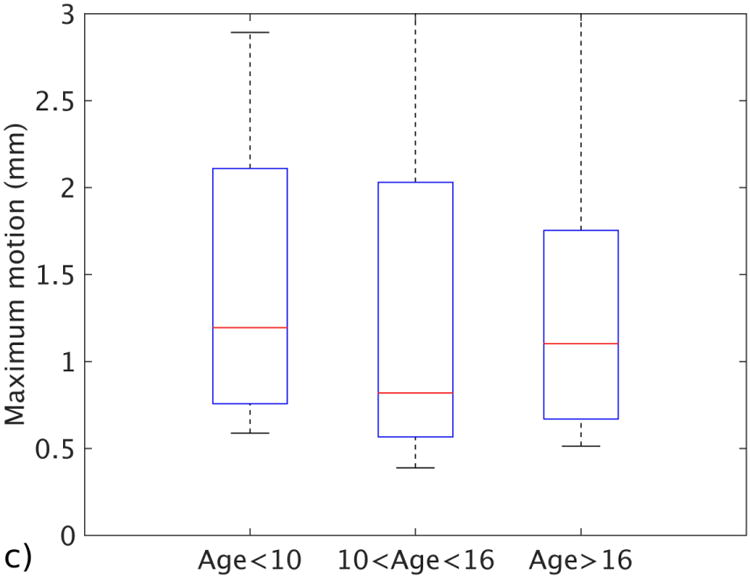
Motion statistics plotted against different age groups. a Image shows mean distance traveled for each age group. b Image shows motion-free time as a ratio for each age group. c Image shows the maximum displacement for patients in each age group. The bars show the 25th and 75th percentiles of each motion measurement for each motion grade, and brackets show the 95% confidence intervals
Table 2. The relationship between motion statistics and age of the subject, reported as median ± standard deviation.
| Age <10 (n=17) | Age 10–16 (n=32) | Age >16 (n=28) | |
|---|---|---|---|
| Mean distance traveled (mm) | 0.43 ± 0.79 | 0.34 ± 0.58 | 0.31 ± 0.22 |
| Motion-free time (ratio) | 0.96 ± 0.27 | 0.98 ± 0.22 | 0.99 ± 0.15 |
| Maximum motion (mm) | 1.19 ± 1.59 | 0.82 ± 1.63 | 1.11 ± 0.7 |
In Table 3 we report the relationship between the gender of the subjects and their motion statistics. For males (n=35), the mean ratio for motion-free time was 0.88, the average of the mean displacement was 0.54 mm and the average of the maximum displacement was 1.52 mm, whereas for females (n=42) the mean parameters were 0.92, 0.42 mm and 1.29 mm, respectively. Among all three metrics, motion-free time was statistically different between males and females, with a P-value of 0.04; mean displacement (P=0.12) and maximum displacement (P=0.31) were not.
Table 3. The relationship between motion statistics and subject gender, which shows that on average, females (n=42) moved less than males (n=35).
| Males (n=35) | Females (n=42) | |
|---|---|---|
| Mean distance traveled (mm) | 0.54 ± 0.27 | 0.42 ± 0.16 |
| Motion-free time (ratio) | 0.88 ± 0.11 | 0.92 ± 0.08 |
| Maximum motion (mm) | 1.52 ± 0.69 | 1.29 ± 0.42 |
Discussion
Our results show that it is possible to compute motion statistics that are highly correlated with an expert's radiologic evaluation of motion artifact. Specifically, we found that the maximum displacement, mean displacement and ratio of motion-free time were each correlated with image quality. In our study, mean displacement and motion-free time were especially correlated with motion grade. Surprisingly, maximum displacement was less correlated with the motion grade than were the other two statistics. We found that very large motions (maximum displacements >3 mm) result in non-diagnostic images, but in scans with smaller motions the motion-free time and mean displacement were better indicators of the presence of motion artifacts in the resulting images. This contradicts the popular belief that the smaller head size of children, as compared to adults, is what results in more room to move within a head coil, and hence larger motion. We did not find any statistically significant correlation between largest motion and age. In our study, the higher correlation with motion-free time and mean displacement suggests that it is more important to consider how much and how often the subject moves throughout the scan, because it may not be practical to design head coils or restraints that can sufficiently limit the maximum displacement (e.g., <1.7 mm). Moreover, these results underscore the importance of training and monitoring children in pediatric MRI, as well as the need for more robust image acquisition and motion-correction strategies to increase motion-free time and therefore improve image quality.
As expected, the younger children in our study moved more than the older ones. The difference was not as large as expected, most likely because the younger children in this study were cleared by staff to be scanned without sedation or anesthesia, which means that they were screened and then judged to be able to comply with instructions. It should also be noted that even though our population consists of cooperative kids, they still moved on average nearly half a voxel (average of mean displacements = 0.47 mm) during a scan. Previous studies on motion correction reported that any motion bigger than a fraction of a voxel could cause motion artifacts [20]. This result shows that motion might be a major problem even for older and more cooperative pediatric populations, and certainly for younger ones.
Among the 77 patients for whom motion was measured successfully, 17 had average displacements larger than 0.5 mm, and this resulted in non-diagnostic images in 11 (14.3%). Similarly, 14 patients had a ratio of less than 0.9 motion-free time, which also led to non-diagnostic images. It should also be noted that the reason the scan was ordered for a particular patient is also an important factor in identifying whether the scan needs to be repeated.
For a routine brain screening study, scans with grades 1 and 2 would need to be repeated (14.3%), whereas in studies ordered to look for potentially more subtle abnormalities (e.g., focal cortical dysplasia), grades 1, 2 and 3 would all require repeating. In our study, this means that 35% of scans would need to be repeated, increasing total study costs, increasing patient risks, and decreasing patient comfort.
Our study has implications for ongoing research on motion correction. Our results show that only 7% of the patients had motion-free time ratios less than 0.6. And in most cases motion was found to be continuous in small periods followed by periods where the subject stayed still. This implies that a method that acquires small segments of data and then corrects for the motion occurring in between acquisitions of these small segments might be a good strategy for reducing motion artifacts in the pediatric age group [21, 22]. In general, the importance of motion-free time uncovered by our study suggests that there is a need for new image-acquisition and motion-correction strategies that are specifically designed to increase motion-free time [23].
Another interesting finding was the difference between genders. Overall we found that females move less than males, both in terms of duration and magnitude of motion. This result is in agreement with previous literature on the subject [24]. A larger and more comprehensive study would be required to conclude this result.
The electromagnetic tracker we used provided motion measurements with both high accuracy and frequency. Because of the system's low sampling period (15 ms), we were able to capture even very fast subject motions in the scanner. Two sensors were used simultaneously to identify potential problems with sensor displacement during the scan. A potential limitation of our motion measurement approach could be the sensor placement issues. The sensors were attached either to the skin of the patients or to the video goggles that they were wearing. In both cases, there is the potential for small additional motions of the sensor that do not correspond to actual head motions. Nevertheless, our results suggest that the statistics we computed were robust to this source of noise.
Our study had certain limitations. It should be noted that this study was performed using a 3-D sequence, a common practice at our hospital. Although this sequence was acquired in the sagittal plane, in terms of motion measurement and artifacts, we don't expect any differences as long as the phase-encoding direction is the same. If the phase-encoding direction is changed, then motion artifacts will occur more frequently in the new direction because this direction is acquired more slowly than the other two directions. Motion artifacts might be different with 2-D sequences, especially for the 2-D single-shot sequences typically used in functional MRI and diffusion-weighted MRI. These types of studies might have additional factors to consider, such as signal loss from intra-slice motion and also the availability of inter-slice motion-correction strategies such as image-registration methods. Two-dimensional sequences might also be affected more by spin-history artifacts. These topics could be addressed in a future study. This study was done on a 3-T scanner, but we expect the results would be same on a 1.5-T scanner with the assumption that the spatial resolution is the same. Also, because most children younger than 6 years are sedated for MRI scans at our hospital, most children in this study were ages 7–18 years. Children younger than 7 years old have different cognitive function from teenagers, so some of the conclusions cannot be generalized for younger children. It should also be noted that using video goggles is a common practice at our hospital and it might have reduced the amount of motion compared to a setup where no visual stimuli is used.
Conclusion
In this work we report results from a large pediatric study to investigate how children move in the MRI scanner and the effects this motion has on image quality. The results will help the motion-correction community in better understanding motion patterns in pediatric populations and how these patterns affect image quality. Our results might also be beneficial to guide clinical practice by establishing thresholds on motion metrics that would result in non-diagnostic images. With real-time motion measurements and thresholds on motion metrics, it would be possible to stop a scan in the middle of an acquisition expected to result in a non-diagnostic image and provide feedback to the children before starting a re-acquisition. This might save half of the scan time for each scan that would have been corrupted if fully acquired.
Acknowledgments
This work was funded in part by National Institutes of Health grants 5R42MH086984, 1R01EB019483, 5R01EB018988 and 5R01EB013248.
Footnotes
Compliance with ethical standards: Conflicts of interest None
References
- 1.Cote CJ, Wilson S Work Group on Sedation. Guidelines for monitoring and management of pediatric patients during and after sedation for diagnostic and therapeutic procedures: an update. Paediatr Anaesth. 2008;18:9–10. doi: 10.1111/j.1460-9592.2007.02404.x. [DOI] [PubMed] [Google Scholar]
- 2.Becke K, Landsleitner B, Reinhold P, et al. Diagnostic and interventional operations in childhood: anesthesiology management. Anaesthesist. 2010;59:1013–1020. doi: 10.1007/s00101-010-1781-z. [DOI] [PubMed] [Google Scholar]
- 3.Krauss B, Green SM. Training and credentialing in procedural sedation and analgesia in children: lessons from the United States model. Paediatr Anaesth. 2008;18:30–35. doi: 10.1111/j.1460-9592.2007.02406.x. [DOI] [PubMed] [Google Scholar]
- 4.Schulte-Uentrop L, Goepfert MS. Anaesthesia or sedation for MRI in children. Curr Opin Anaesthesiol. 2010;23:513–517. doi: 10.1097/ACO.0b013e32833bb524. [DOI] [PubMed] [Google Scholar]
- 5.Havidich JE, Beach M, Dierdorf SF, et al. Preterm versus term children: analysis of sedation/anesthesia adverse events and longitudinal risk. Pediatrics. 2016;137:1–9. doi: 10.1542/peds.2015-0463. [DOI] [PMC free article] [PubMed] [Google Scholar]
- 6.Aksoy M, Forman C, Straka M, et al. Real-time optical motion correction for diffusion tensor imaging. Magn Reson Med. 2011;66:366–378. doi: 10.1002/mrm.22787. [DOI] [PMC free article] [PubMed] [Google Scholar]
- 7.Ooi MB, Aksoy M, Maclaren J, et al. Prospective motion correction using inductively coupled wireless RF coils. Magn Reson Med. 2013;70:639–647. doi: 10.1002/mrm.24845. [DOI] [PMC free article] [PubMed] [Google Scholar]
- 8.Thesen S, Heid O, Mueller E, Schad LR. Prospective acquisition correction for head motion with image-based tracking for real-time fMRI. Magn Reson Med. 2000;44:457–465. doi: 10.1002/1522-2594(200009)44:3<457::aid-mrm17>3.0.co;2-r. [DOI] [PubMed] [Google Scholar]
- 9.Tisdall MD, Hess AT, Reuter M, et al. Volumetric navigators for prospective motion correction and selective reacquisition in neuroanatomical MRI. Magn Reson Med. 2012;68:389–399. doi: 10.1002/mrm.23228. [DOI] [PMC free article] [PubMed] [Google Scholar]
- 10.Van der Kouwe AJ, Benner T, Dale AM. Real-time rigid body motion correction and shimming using cloverleaf navigators. Magn Reson Med. 2006;56:1019–1032. doi: 10.1002/mrm.21038. [DOI] [PubMed] [Google Scholar]
- 11.Pipe JG. Motion correction with PROPELLER MRI: application to head motion and free-breathing cardiac imaging. Magn Reson Med. 1999;42:963–969. doi: 10.1002/(sici)1522-2594(199911)42:5<963::aid-mrm17>3.0.co;2-l. [DOI] [PubMed] [Google Scholar]
- 12.White N, Roddey C, Shankaranarayanan A, et al. PROMO: real-time prospective motion correction in MRI using image-based tracking. Magn Reson Med. 2010;63:91–105. doi: 10.1002/mrm.22176. [DOI] [PMC free article] [PubMed] [Google Scholar]
- 13.Zaitsev M, Dold C, Sakas G, et al. Magnetic resonance imaging of freely moving objects: prospective real-time motion correction using an external optical motion tracking system. Neuroimage. 2006;31:1038–1050. doi: 10.1016/j.neuroimage.2006.01.039. [DOI] [PubMed] [Google Scholar]
- 14.Power JD, Barnes KA, Snyder AZ, et al. Spurious but systematic correlations in functional connectivity MRI networks arise from subject motion. Neuroimage. 2012;59:2142–2154. doi: 10.1016/j.neuroimage.2011.10.018. [DOI] [PMC free article] [PubMed] [Google Scholar]
- 15.Van Dijk KR, Sabuncu MR, Buckner RL. The influence of head motion on intrinsic functional connectivity MRI. Neuroimage. 2012;59:431–438. doi: 10.1016/j.neuroimage.2011.07.044. [DOI] [PMC free article] [PubMed] [Google Scholar]
- 16.Yendiki A, Koldewyn K, Kakunoori S, et al. Spurious group differences due to head motion in a diffusion MRI study. Neuroimage. 2014;88:79–90. doi: 10.1016/j.neuroimage.2013.11.027. [DOI] [PMC free article] [PubMed] [Google Scholar]
- 17.Reuter M, Tisdall MD, Qureshi A, et al. Head motion during MRI acquisition reduces gray matter volume and thickness estimates. Neuroimage. 2015;107:107–115. doi: 10.1016/j.neuroimage.2014.12.006. [DOI] [PMC free article] [PubMed] [Google Scholar]
- 18.Gholipour A, Polak M, Van der Kouwe A, et al. Motion-robust MRI through real-time motion tracking and retrospective super-resolution volume reconstruction. Conf Proc IEEE Eng Med Biol Soc. 2011;2011:5722–5725. doi: 10.1109/IEMBS.2011.6091385. [DOI] [PMC free article] [PubMed] [Google Scholar]
- 19.Likert R. A technique for the measurement of attitudes. Arch Psych. 1932;22:1–55. [Google Scholar]
- 20.Maclaren J, Herbst M, Speck O, Zaitsev M. Prospective motion correction in brain imaging: a review. Magn Reson Med. 2013;69:621–636. doi: 10.1002/mrm.24314. [DOI] [PubMed] [Google Scholar]
- 21.Gholipour A, Afacan O, Aganj I, et al. Super-resolution reconstruction in frequency, image, and wavelet domains to reduce through-plane partial voluming in MRI. Med Phys. 2015;42:6919–6932. doi: 10.1118/1.4935149. [DOI] [PMC free article] [PubMed] [Google Scholar]
- 22.Gholipour A, Estroff J, Warfield SK. Robust super-resolution volume reconstruction from slice acquisitions: application to fetal brain MRI. IEEE Trans Med Imaging. 2010;29:1739–1758. doi: 10.1109/TMI.2010.2051680. [DOI] [PMC free article] [PubMed] [Google Scholar]
- 23.Erem B, Afacan O, Gholipour A, et al. A system identification approach to estimating a dynamic model of head motion for MRI motion correction. [Accessed June 14, 2016];Intelligent MRI Workshop MICCAI. 2014 http://crl.med.harvard.edu/publications/Year/2014%20Papers/Erem2014IntellMRWorkshopMICCAI.pdf.
- 24.Yuan W, Altaye M, Ret J, et al. Quantification of head motion in children during various fMRI language tasks. Hum Brain Mapp. 2009;30:1481–1489. doi: 10.1002/hbm.20616. [DOI] [PMC free article] [PubMed] [Google Scholar]


