Abstract
Objectives:
To investigate the diagnostic value of tumour blood flow (TBF) obtained with pseudocontinuous arterial spin labelling for the differentiation of squamous cell carcinoma (SCC) and inverted papilloma (IP) in the nasal or sinonasal cavity.
Methods:
We retrospectively analysed the cases of 33 patients with SCC and 8 patients with IP in the nasal or sinonasal cavity. Pseudocontinuous arterial spin labelling scanning was performed for all patients using a 3.0-T MR unit. Quantitative TBF values were measured by two neuroradiologists by respectively delineating the whole-tumour regions of interest, and the mean of them was determined as TBF value in each patient. Additionally, the presence of imaging findings of convoluted cerebriform pattern (CCP) on MR T2 weighted images was determined in all patients. As a subgroup analysis, patients with IP were divided into aggressive and non-aggressive IPs depending on their progression range. First, an intraclass correlation coefficient (ICC) of TBF values between two neuroradiologists was determined. Next, a statistical comparison of the TBF value by a Mann–Whitney U test between the patients with SCC and IP was performed. Additionally, the comparison by an ANOVA with a post hoc test of Tukey's method among the SCC, non-aggressive IP and aggressive IP groups was also performed. If significance was observed, the diagnostic accuracy to differentiate SCCs from IPs was calculated. Diagnostic accuracy by CCP findings alone and by the combination of CCP findings and TBF were also assessed.
Results:
The ICC of TBF values between two neuroradiologists was 0.82. The mean TBF values in the patients with SCC, all patients with IP, those with aggressive IP and those with non-aggressive IP were 141.2 ± 33.1, 77.8 ± 31.5, 109.4 ± 16.7 and 58.8 ± 19.9 ml 100 g−1 min−1, respectively. A significant difference was observed between SCC and IP (p < 0.001), SCC and non-aggressive IP (p < 0.01) and non-aggressive IP and aggressive IP (p < 0.01). The diagnostic accuracy values obtained with receiver operating characteristic curve analysis for the differentiation of SCC from IP and for SCC from non-aggressive IP were 0.90 and 0.92, respectively. The diagnostic accuracy was elevated (0.95 from 0.88) by adding the TBF value to CCP findings.
Conclusions:
The pseudocontinuous arterial spin labelling technique can be a useful non-invasive diagnostic tool to differentiate SCC from IP in nasal or sinonasal cavity.
Keywords: magnetic resonance imaging, perfusion, head and neck neoplasms, carcinoma, squamous cell, papilloma, inverted
Introduction
Inverted papilloma (IP) is the most common benign epithelial tumour in the nasal and sinonasal cavity.1 The treatment of IP has mainly been surgical treatment only and occasionally clinical follow-up without surgical treatment.2 When IP is suspected in the lesion of nasal or sinonasal cavity, it is clinically very important to exclude squamous cell carcinoma (SCC), which is the most common tumour among nasal and sinonasal cavity malignancies.3 The treatment of SCCs includes surgical treatment, chemotherapy, radiotherapy and combinations of these.4 When the diagnosis of SCC is obtained, early treatment is recommended before more advanced tumour progression. The differentiation of SCC and IP is important, as the progression rate and treatment strategy are quite different between SCC and IP.
The gold standard for the definitive diagnosis of SCC and that of IP has been the histopathological findings. However, the diagnosis is sometimes missed by a surgical biopsy; this is because tissue containing tumour cells is not always obtained in a biopsy, owing to peripheral inflammatory tissue. Concomitant or simultaneous inflammation in particular is commonly observed in the nasal and sinonasal cavity.5 By contrast, a conventional MRI finding was reported to be useful for the differentiation of SCC and IP: a characteristic imaging finding of a band-like region formed by hyperintense and hypointense signals observed on T2 weighted images (T2WI) and post-contrast-enhanced T1 weighted images (CE-T1WI), the so-called convoluted cerebriform pattern (CCP) indicating an IP.6,7 However, this imaging finding of the CCP was also observed in several SCCs.7 In addition, a type of IP that is an aggressive type with bone erosion or destruction has also been observed. These findings of overlap between SCC and IP make it difficult to differentiate SCCs and IPs. New methods to assist the diagnoses of SCC and IP are needed.
The pseudocontinuous arterial spin labelling (pCASL) MRI technique that is currently widely used for the non-invasive measurement of tissue blood flow uses protons in arterial water as an intrinsic tracer.8 pCASL MRI is a new arterial spin labelling technique that has the potential of combining advantages of continuous arterial spin labelling and pulsed arterial spin labelling. pCASL MRI is an intermediate technique between continuous arterial spin labelling and pulsed arterial spin labelling, which utilizes a series of discrete radiofrequency pulses to mimic the continuous arterial spin labelling method for spin labelling. The reliability of pCASL for use in head and neck tumours was described recently.9 The pCASL parameter of tumour blood flow (TBF) reflects tissue physiological information that differs from the histological and anatomical information of an imaging finding of the CCP. This physiological information can contribute to the differentiation of SCC and IP.
The aim of the present study was to investigate the diagnostic value of TBF obtained with pCASL for the differentiation of SCC and IP in the nasal or sinonasal cavity.
Methods and materials
Patients' characteristics
The study protocol was approved by the institutional review board at Hokkaido University Hospital. We retrospectively evaluated the cases of 33 patients with SCC and 8 patients with IP in the nasal or sinonasal cavity, using the following inclusion criteria: (1) the patient was diagnosed histopathologically as having SCC or IP and (2) MR scanning including pCASL was performed within 1 month before the histopathological diagnosis. The histopathological diagnosis was performed following a biopsy or resection in the patients with SCC and only by resection in the patients with IP with confirmation of the absence of malignancy such as SCC. The patients with SCC were 28 males (mean age, 61.8 years; range, 46–79 years) and 5 females (mean age, 59.2 years; range, 43–89 years). The primary sites of the 33 patients with SCC were the maxillary sinus in 29 patients and the nasal cavity in 4 patients. The patients with IP were six males (mean age, 63 years; range, 55–70 years) and two females (49 and 64 years). The primary sites of the IPs were the nasal cavity in four patients, the ethmoid sinus in two and the sphenoid sinus in two.
Imaging parameters
All MRI was performed using a 3.0-T unit (Achieva® TX; Philips Healthcare, Best, Netherlands) with a 16-channel neurovascular coil. First, conventional MR images were obtained to evaluate the primary tumour. These images included axial (Ax.) T1WI with a spin echo sequence [repetition time (TR), 450 ms; echo time (TE), 10 ms; field of view (FOV), 240 × 240 mm; 512 × 512 matrix; slice thickness, 5 mm; interslice gap, 30%; scanning time, 2 min 12 s] and Ax. and coronal (Cor.) T2WI with a turbo-spin echo (TSE) sequence with fat suppression (Ax.: TR, 4500 ms; TE, 70 ms; TSE factor, 9; FOV, 240 × 240 mm; 512 × 512 matrix, slice thickness, 5 mm; interslice gap, 30%; scanning time, 2 min 6 s. Cor.: TR, 4365 ms; TE, 80 ms; TSE factor, 10; FOV, 240 × 240 mm; 512 × 512 matrix; slice thickness, 4 mm; interslice gap, 30%; scanning time, 2 min 15 s).
Additionally, in all of the patients with IP, Ax. T2WI without fat suppression (TR, 4000 ms; TE, 70 ms; TSE factor, 9; FOV, 240 × 240 mm; 512 × 512 matrix; slice thickness, 5 mm; interslice gap, 30%; scanning time, 2 min 1 s), coronal T1WI (TR, 521 ms; TE, 10 ms; FOV, 240 × 240 mm; 512 × 512 matrix; slice thickness, 4 mm; interslice gap, 30%; scanning time, 3 min 44 s) and non-enhanced CT images were also obtained. The CT examinations were performed with a 320-slice multidetector row CT scanner (Aquilion One™ ViSION Edition, Toshiba Medical Systems, Otawara, Japan). The settings used for CT scanning were 120 kVp, 65 mA, 0.75 s per rotation and helical pitch = 0.638. CT images in the axial, coronal and sagittal planes were reconstructed at a thickness of 2 mm. The CT images of the paranasal sinus and nasal cavity examinations were performed at the bone window and soft-tissue window settings, respectively.
In pCASL scanning, the acquisition was performed by using multishot spin echo echoplanar imaging to obtain control and labelled images. The labelling slab was placed just under the bifurcation of the internal and external carotid arteries by using the coronal T2WI as a reference with the labelling efficiency of 0.85. The MR parameters of the pCASL were as follows: labelling duration, 1650 ms; post-label delay, 1280 ms; TR, 3619 ms; TE, 18 ms; flip angle, 90°; number of shots, 2; echo train length, 17; bandwidth, 2668 Hz per pixel; FOV, 230 × 230 mm; matrix, 80 × 80; slice thickness, 5 mm; number of slices, 15; acceleration factor for parallel imaging, 2; number of excitations, 20; and scanning time, 5 min 11 s. The patients were instructed not to swallow, move their tongues, open their mouths or make any other voluntary motion during pCASL scanning. In addition, their heads were fixed firmly with the coil to prevent movement during the scan.
A T1 map was also obtained to measure the longitudinal relaxation in the tumour tissue, and it was used for TBF quantification. For the T1 map, a gradient echo sequence with look locker readout by constant flip angle was used with the following parameters: TR, 7 ms; TE, 1.7 ms; flip angle, 7°; FOV, 230 × 230 mm; matrix, 256 × 256; slice thickness, 10 mm (single-slice acquisition); scanning time, 6 s.
Data analysis
Tumour blood flow calculation by pseudocontinuous arterial spin labelling
We calculated the TBF of the pCASL (f) images from the signal difference (ΔM), which was calculated by subtracting the labelled image from the control image, using the previously described equation:10
| (1) |
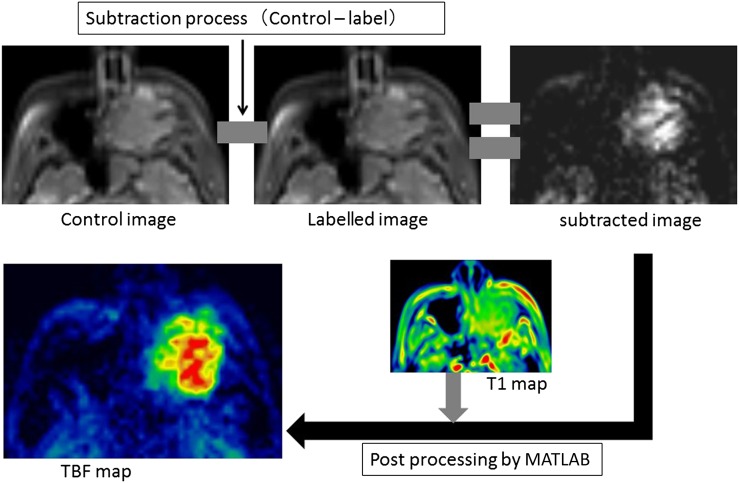
where R1a is the longitudinal relaxation rate of blood (0.67 s−1), γ is the labelling time (1.65 s), ω is the post-labelling delay time (1.28 s), α is the labelling efficiency (0.85) and λ is the blood/tumour-tissue water partition coefficient (1.0 g ml−1).11,12 M0 is the equilibrium magnetization of the tumour tissue, which was estimated from the signal intensity of the control image and the tumour longitudinal relaxation rate obtained by the T1 map. Using Equation (1), we created the TBF maps on a pixel-by-pixel basis. We used the self-developed program by mathematical software (MATLAB® v. 2012a; MathWorks®, Natick, MA) to calculate the TBF values. All post-processing was performed by this software. This process is illustrated in Figure 1.
Figure 1.
Image processing of pseudocontinuous arterial spin labelling (pCASL) data. From pCASL image data, subtracted image was generated by subtracting the labelled image from control image. Subtracted image was post-processed based on the equation for tumour blood flow (TBF) quantification to generate TBF map with the use of T1 map.
Tumour region of interest delineation and quantification
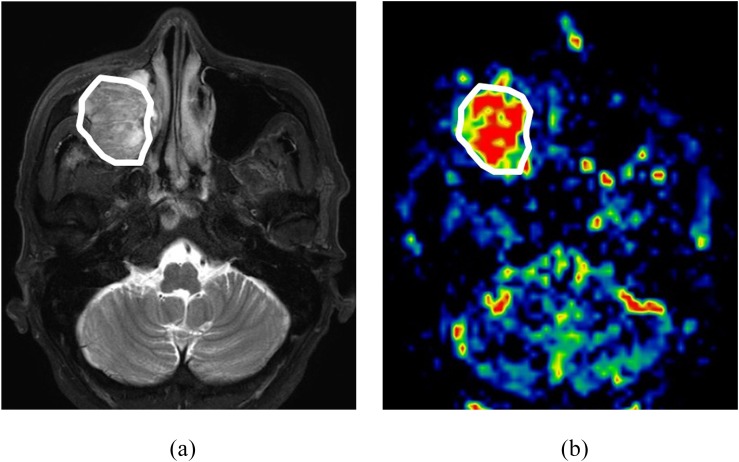
The primary tumour in both SCC and IP was outlined by two board-certified neuroradiologists with 11 and 18 years' experience (NF and AT), blinded to the histopathological diagnosis. The delineation was performed on the axial T2WI with a polygonal region of interest (ROI), and the ROI was then copied onto a TBF map (Figure 2). The T1WI was also used as a guide to determine the ROI. To avoid vascular artefacts in the ROI, the area of the vessel signal void was also delineated on the T2WI, and this area was excluded from the TBF measurement. Any strong high-signal areas on T2WI which suggested necrosis were also excluded.
Figure 2.
Tumour region of interest (ROI) delineation. A sample case of tumour ROI delineation. (a) The tumour was delineated on the axial T2 weighted images with a polygonal ROI. (b) After the delineation, the ROI was copied to the corresponding tumour blood flow map.
On the TBF map, the mean of the TBF values in the delineated ROI was calculated. Finally, TBF value in each patient was determined as the mean value of two ROIs, respectively, delineated by two neuroradiologists. If the tumour extended into two or more slices on the TBF map, the mean TBF values of all pixels in all ROIs of the tumour was calculated as the TBF value.
Group division in inverted papilloma
Because there are various types of IP in light of its aggressiveness, we also performed a subgroup analysis by dividing the patients with IP into non-aggressive IP and aggressive IP groups. Aggressive IP was defined as follows: there was clear bone destruction in any bone around the tumour or invasion of the orbit space or skull base. If such changes were not observed, the IP was defined as non-aggressive IP. Imaging findings related to aggressive IP were used to assess the imaging of axial and coronal T1WI, T2WI and CT by the same board-certified neuroradiologist who performed the tumour ROI delineation (AT).
Assessment of the CCP findings
For the assessment of CCP finding, the presence of CCP on axial T2WI in each patient was determined by the neuroradiologist who performed ROI delineation (AT), blinded to the histopathological diagnosis. If the finding of CCP was observed in at least one slice including the tumour, such a patient was determined positive CCP, and if CCP was not observed in all slices, such a patient was determined negative CCP.
Statistical analysis
An intraclass correlation coefficient (ICC) of the calculated TBF values between two ROIs, respectively, delineated by two neuroradiologists was calculated. The ICCs were set as follows: r < 0.2, poor agreement; r = 0.2–0.4, fair agreement; r = 0.41–0.6, moderate agreement; r = 0.61–0.8, good agreement; r > 0.81, excellent agreement. A Mann–Whitney U test was used to compare TBF values between the patients with SCC and IP. In the subgroup analysis, an ANOVA was used for comparisons among the three groups of patients with SCC, aggressive IP and non-aggressive IP. When a difference was significant, we used a post hoc test (Tukey's method) to determine the pair with a significant difference. If a significant difference was observed between SCC and IP, aggressive IP or non-aggressive IP, the receiver operating characteristic curve was constructed for the calculation of area under curve and for the determination of best diagnostic accuracy by using the closest point to the upper left corner of receiver operating characteristic curve; in addition, the threshold of sensitivity of 1.0 and that of specificity of 1.0 was, respectively, determined.
For the assessment including CCP findings, at first, diagnostic accuracy was determined for the differentiation of SCC and IP based on only the presence of CCP findings. Next, the best diagnostic accuracy by the combination of CCP findings and TBF value was determined for assessment of elevation in diagnostic accuracy by adding the TBF value.
A p-value of <0.05 was considered to indicate a significant difference.
Results
pCASL scanning and TBF measurement were successfully performed in all of the eight patients with IP, three of whom were found to have aggressive IP and the other five had non-aggressive IP.
The ICC of TBF values between the two neuroradiologists revealed excellent agreement (ICC = 0.82). The mean TBF values in the patients with SCC, all patients with IP, those with aggressive IP and those with non-aggressive IP were 141.2 ± 33.1, 77.8 ± 31.5, 109.4 ± 16.7 and 58.8 ± 19.9 ml 100 g−1 min−1, respectively.
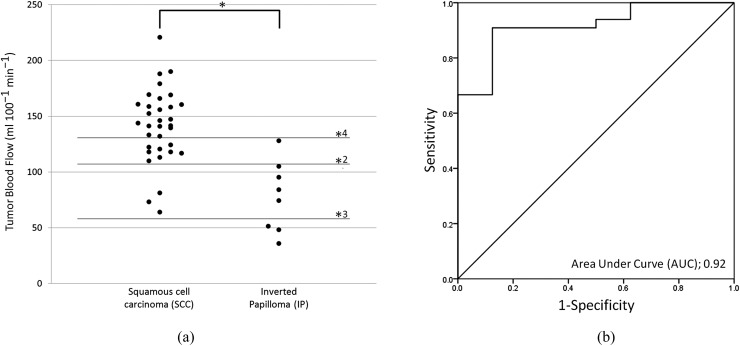
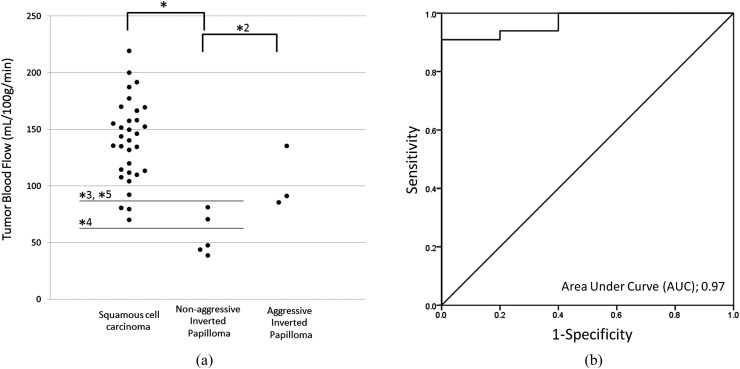
There was a significant difference in TBF values between the SCC and IP groups (p < 0.001) (Figure 3). In the subgroup analysis, significant differences in TBF among the three groups were revealed by ANOVA. Post hoc tests revealed significant differences between SCC and non-aggressive IP (p < 0.01), and between the aggressive IP and non-aggressive IP (p < 0.01). By contrast, there was no significant difference between the SCC and aggressive IP cases (Figure 4).
Figure 3.
(a) Tumour blood flow (TBF) in patients with squamous cell carcinoma (SCC) or inverted papilloma (IP). (b) Receiver operating characteristic (ROC) curve for the determination of diagnostic accuracy. The TBF values in the 33 patients with SCC (141.2 ± 33.1 ml 100 g−1 min−1) were significantly lower than those in the 8 patients with IP (77.8 ± 31.5 ml 100 g−1 min−1) [(a): *p < 0.001]. In the ROC curve analysis (b), the area under curve (AUC), sensitivity, specificity and accuracy for the differentiation of SCC and IP were 0.92, 0.91 (30/33), 0.86 (7/8) and 0.90 (37/41) with the threshold of 106–109 ml 100 g−1 min−1 [(a): *2]. Lines of thresholds for the sensitivity of 1.0 [(a): *3, 64 ml 100 g−1 min−1] and specificity of 1.0 [(a): *4, 127 ml 100 g−1 min−1] are also presented.
Figure 4.
(a) Tumour blood flow (TBF) in patients with squamous cell carcinoma (SCC), aggressive inverted papilloma (IP) or non-aggressive IP. (b) Receiver operating characteristic (ROC) curve for the determination of diagnostic accuracy between SCC and non-aggressive IP. Among these three groups, significant differences in TBF values were observed between SCC (141.2 ± 33.1 ml 100 g−1 min−1) and non-aggressive IP (58.8 ± 19.9 ml 100 g−1 min−1) [(a): *, p < 0.01] and between the aggressive IP (109.4 ± 16.7 ml 100 g−1 min−1) and non-aggressive IP cases [(a): *2, p < 0.01]. No significant difference was observed between SCC and aggressive IP. In the ROC curve analysis (b), the AUC, sensitivity, specificity and accuracy for the differentiation of SCC and IP were 0.97, 0.91 (30/33), 1.0 (5/5) and 0.92 (35/38) with the threshold of 85–109 ml 100 g−1 min−1 [(a); *3]. Lines of thresholds for the sensitivity of 1.0 [(a): *4, 52–64 ml 100 g−1 min−1] and specificity of 1.0 [(a): *5, 85–109 ml 100 g−1 min−1] are shown.
In the receiver operating characteristic curve analysis, the area under curve, sensitivity, specificity and accuracy for the differentiation of SCC and IP were 0.92, 0.91 (30/33), 0.87 (7/8) and 0.90 (37/41) with the threshold of 106–109 ml 100 g−1 min−1. The thresholds on the sensitivity of 1.0 and specificity of 1.0 were 64 and 127 ml 100 g−1 min−1 (Figure 3). In addition, the area under curve, sensitivity, specificity and accuracy for the differentiation of SCC and non-aggressive IP were 0.97, 0.91 (30/33), 1.0 (5/5) and 0.92 (35/38) with the threshold of 85–109 ml 100 g−1 min−1. The thresholds on the sensitivity of 1.0 and specificity of 1.0 were 52–64 and 85–109 ml 100 g−1 min−1, respectively (Figure 4).
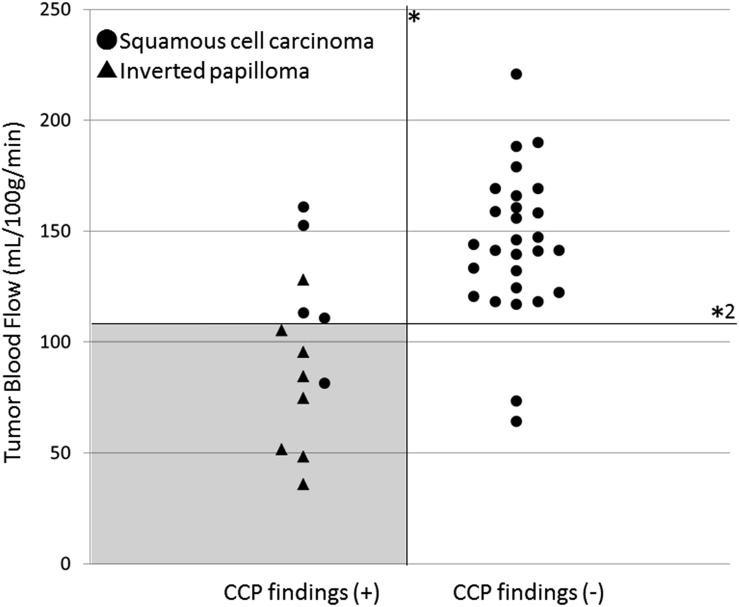
In the assessment of CCP findings, all patients with IP were determined the positive CCP. In patients with SCC, 5 were determined the positive CCP and 28 were negative CCP. Diagnostic sensitivity, specificity and accuracy were 0.85 (28/33), 1.0 (8/8) and 0.88 (36/41), respectively, only by using CCP findings. By combining the CCP findings and the TBF value for differentiation of IP and SCC, the diagnostic accuracy was elevated to 0.95 (39/41) with the sensitivity of 0.97 (32/33) and specificity of 0.87 (7/8) (Figure 5).
Figure 5.
Two-dimensional plot graph with the presence of convoluted ceribriform pattern (CCP) findings and tumour blood flow (TBF). Two-dimensional plot graph with the TBF values on the vertical axis and the presence of CCP findings on the horizontal axis was shown. By the combination use of CCP findings (*) and setting the range of 106–109 ml 100 g−1 min−1 at the threshold of TBF (*2), the highest diagnostic accuracy of 0.95 (39/41) with sensitivity of 0.97 (32/33) and specificity of 0.87 (7/8) was obtained. Most of the patients with IP can be successfully detected by using this threshold and the imaging findings of CCP with few overlaps with patients with squamous cell carcinoma (grey area).
A case example of the TBF map in both SCC and IP is, respectively, shown in Figure 6.
Figure 6.
Case examples of tumour blood flow (TBF) maps of squamous cell carcinoma (SCC) and inverted papilloma (IP) cases. T2 weighted images (T2WI) and TBF map in a patient with SCC (a, b) and a patient with a non-aggressive IP (c, d). From these T2WI images, the differentiation of SCC and IP was difficult. However, higher TBF was observed in the TBF map of the SCC patient (b, arrows), whereas low/moderate TBF was observed in that of the patient with IP (d, arrowheads). This TBF difference contributed to the differentiation.
Discussion
Our study's results revealed a significant difference in TBF between the SCC and IP cases. The viability and blood supply in malignant tumours such as SCCs have been considered large because of their high progression rate and metabolism.13,14 The pCASL technique has been used to reveal such higher vascularity in SCCs non-invasively. By contrast, the TBF values in our present study's patients with IP were significantly lower than those in the SCC group. We suspect that this is because such a large blood supply was not necessary for the IPs that were benign and did not have a high progression rate such as that of SCCs.
In light of these findings, we propose that the measurement of TBF values can be used as one of the diagnostic tools for the differentiation of SCC and IP. Although there were several overlaps in TBF values of our patients with SCC and IP, 100% sensitivity was revealed for the TBF value of 64 ml 100 g−1 min−1 and 100% specificity was also revealed for 127 ml 100 g−1 min−1. These values can be useful as additional information for differentiating SCC and IP.
To our knowledge, there has been no report describing the diagnostic value of TBF values to differentiate SCC and IP, and the present study is the first to indicate the utility of TBF for this differentiation with excellent interobserver agreement of TBF measurement. Moreover, pCASL can be performed completely non-invasively because it does not require a contrast agent. The clinical utility of TBF measurement using pCASL is apparent, especially for patients with renal failure, as its use avoids the risk of contrast agent-induced nephropathy and nephrogenic systemic fibrosis.
To differentiate SCCs and IPs, a well-known criterion is the conventional MRI finding of CCP, which was described as a band-like appearance of high and low intensity on T2WI or CE-T1WI. Several studies reported a high detection rate of the CCP (80–100%) in patients with IP.6,7,15 Especially, Jeon et al7 reported that the CCP was detected by CE-T1WI in all 30 patients with IP in their study population. This indicates that the imaging finding of CCP has very high sensitivity for the detection of IP. However, Jeon et al7 reported that the CCP was also detected in several patients with SCC; this overlap was considered to make it difficult to differentiate SCCs and IPs. Actually, study population of the present study of five patients with SCC were detected CCP findings on T2WI. In addition, the detection of the CCP from MR images of T2WI or CE-T1WI was considered sometimes difficult for radiologists who are not familiar with the interpretation of MR images in IP cases. Moreover, it was reported that the CCP was not detected in a few patients with IP by only T2WI, although the CCP was successfully detected by CE-T1WI. Compared with the imaging finding of the CCP, a TBF evaluation has an advantage because, with it, it is easy to determine the diagnosis by simply using the TBF value itself with a certain threshold, with no need for time-consuming image interpretation to detect the finding of the CCP. Depending on various clinical situations, we can set the threshold for high sensitivity or high specificity as needed. By using the combination of CCP findings and TBF values, the present study revealed the elevation of diagnostic accuracy for the differentiation of SCC and IP. As mentioned above, CCP findings were sometimes detected in SCC as well as IP. However, from the findings of the present study, we can indicate the diagnosis of SCC when much higher TBF was observed by pCASL, even if imaging findings of CCP were observed in the tumour. From this point of view, if possible, assessment of both CCP findings and TBF value by pCASL will be suggested more useful for the accurate diagnosis.
Another notable finding of the present study is the significant difference in TBF that was observed between the aggressive IP and non-aggressive IP cases. This finding indicates that the range of TBF values differs between aggressive and non-aggressive type IPs. We suspect that there is another possibility for the assessment of IPs by using the TBF value. In a long-term follow-up, IP was reported to have turned out to be an IP with malignancy; typically, SCC was arisen.16 It is likely that a non-aggressive IP changed gradually to the aggressive type of IP and had an increased tendency of invasion and destruction of the peripheral structure, and it finally completely turned into SCC. By using fluorine-18 fludeoxyglucose positron emission tomography/CT, the maximum standardized uptake value was reported to be useful for the differentiation of IPs with malignancy and without malignancy.17 By contrast, in light of the results of the present study, the TBF in an IP will be expected to increase when the tumour is turning into the aggressive type or into a malignant tumour from a non-aggressive IP. The TBF value can thus also be useful as a follow-up tool for the detection of IPs with malignancy from those without malignancy (such as the maximum standardized uptake value obtained by fluorine-18 fludeoxyglucose positron emission tomography/CT).
Our study has one major limitation: the number of patients with IP (n = 8) was very small. However, it may be difficult to match the patient numbers between IP and SCC cases because IPs are not common. Furthermore, long-term studies of greater numbers of patients with IP are needed.
Conclusions
In conclusion, pCASL technique can be a useful non-invasive diagnostic tool for the differentiation of SCCs and IPs in the nasal or sinonasal cavity.
Contributor Information
N Fujima, Email: Noriyuki.Fujima@mb9.seikyou.ne.jp.
Y Nakamaru, Email: nmaru@med.hokudai.ac.jp.
References
- 1.Outzen KE, Grøntveld A, Jørgensen K, Clausen PP, Ladefoged C. Inverted papilloma: incidence and late results of surgical treatment. Rhinology 1996; 34: 114–18. [PubMed] [Google Scholar]
- 2.Carta F, Blancal JP, Verillaud B, Tran H, Sauvaget E, Kania R, et al. Surgical management of inverted papilloma: approaching a new standard for surgery. Head Neck 2013; 35: 1415–20. doi: 10.1002/hed.23159 [DOI] [PubMed] [Google Scholar]
- 3.Sanghvi S, Khan MN, Patel NR, Yeldandi S, Baredes S, Eloy JA. Epidemiology of sinonasal squamous cell carcinoma: a comprehensive analysis of 4994 patients. Laryngoscope 2014; 124: 76–83. doi: 10.1002/lary.24264 [DOI] [PubMed] [Google Scholar]
- 4.Jégoux F, Métreau A, Louvel G, Bedfert C. Paranasal sinus cancer. Eur Ann Otorhinolaryngol Head Neck Dis 2013; 130: 327–35. doi: 10.1016/j.anorl.2012.07.007 [DOI] [PubMed] [Google Scholar]
- 5.Pal I, Gupta A, Sengupta S. An attempt to define the type of biopsy in a sinonasal lesion showing bony erosion. Indian J Otolaryngol Head Neck Surg 2010; 62: 92–5. doi: 10.1007/s12070-010-0003-y [DOI] [PMC free article] [PubMed] [Google Scholar]
- 6.Ojiri H, Ujita M, Tada S, Fukuda K. Potentially distinctive features of sinonasal inverted papilloma on MR imaging. AJR Am J Roentgenol 2000; 175: 465–8. doi: 10.2214/ajr.175.2.1750465 [DOI] [PubMed] [Google Scholar]
- 7.Jeon TY, Kim HJ, Chung SK, Dhong HJ, Kim HY, Yim YJ, et al. Sinonasal inverted papilloma: value of convoluted cerebriform pattern on MR imaging. AJNR Am J Neuroradiol 2008; 29: 1556–60. doi: 10.3174/ajnr.A1128 [DOI] [PMC free article] [PubMed] [Google Scholar]
- 8.Telischak NA, Detre JA, Zaharchuk G. Arterial spin labeling MRI: clinical applications in the brain. J Magn Reson Imaging 2015; 41: 1165–80. doi: 10.1002/jmri.24751 [DOI] [PubMed] [Google Scholar]
- 9.Fujima N, Kudo K, Tsukahara A, Yoshida D, Sakashita T, Homma A, et al. Measurement of tumor blood flow in head and neck squamous cell carcinoma by pseudo-continuous arterial spin labeling: comparison with dynamic contrast-enhanced MRI. J Magn Reson Imaging 2015; 41: 983–91. doi: 10.1002/jmri.24637 [DOI] [PubMed] [Google Scholar]
- 10.Wang Z, Aguirre GK, Rao H, Wang J, Fernandez-Seara MA, Childress AR, et al. Empirical optimization of ASL data analysis using an ASL data processing toolbox: ASLtbx. Magn Reson Imaging 2008; 26: 261–9. doi: 10.1016/j.mri.2007.07.003 [DOI] [PMC free article] [PubMed] [Google Scholar]
- 11.Wheeler RH, Ziessman HA, Medvec BR, Juni JE, Thrall JH, Keyes JW, et al. Tumor blood flow and systemic shunting in patients receiving intraarterial chemotherapy for head and neck cancer. Cancer Res 1986; 46: 4200–4. [PubMed] [Google Scholar]
- 12.van Osch MJ, Teeuwisse WM, van Walderveen MA, Hendrikse J, Kies DA, van Buchem MA. Can arterial spin labeling detect white matter perfusion signal? Magn Reson Med 2009; 62: 165–73. doi: 10.1002/mrm.22002 [DOI] [PubMed] [Google Scholar]
- 13.Razek AA, Elsorogy LG, Soliman NY, Nada N. Dynamic susceptibility contrast perfusion MR imaging in distinguishing malignant from benign head and neck tumors: a pilot study. Eur J Radiol 2011; 77: 73–9. doi: 10.1016/j.ejrad.2009.07.022 [DOI] [PubMed] [Google Scholar]
- 14.Fujima N, Kudo K, Yoshida D, Homma A, Sakashita T, Tsukahara A, et al. Arterial spin labeling to determine tumor viability in head and neck cancer before and after treatment. J Magn Reson Imaging 2014; 40: 920–8. doi: 10.1002/jmri.24421 [DOI] [PubMed] [Google Scholar]
- 15.Wang X, Zhang Z, Chen X, Li J, Xian J. Value of magnetic resonance imaging including dynamic contrast-enhanced magnetic resonance imaging in differentiation between inverted papilloma and malignant tumors in the nasal cavity. Chin Med J (Engl) 2014; 127: 1696–701. [PubMed] [Google Scholar]
- 16.Mirza S, Bradley PJ, Acharya A, Stacey M, Jones NS. Sinonasal inverted papillomas: recurrence, and synchronous and metachronous malignancy. J Laryngol Otol 2007; 121: 857–64. doi: 10.1017/S002221510700624X [DOI] [PubMed] [Google Scholar]
- 17.Jeon TY, Kim HJ, Choi JY, Lee IH, Kim ST, Jeon P, et al. 18F-FDG PET/CT findings of sinonasal inverted papilloma with or without coexistent malignancy: comparison with MR imaging findings in eight patients. Neuroradiology 2009; 51: 265–71. doi: 10.1007/s00234-009-0510-2 [DOI] [PubMed] [Google Scholar]


