

Abstract
Little is known about the inter-individual variation of cytokine responses to different pathogens in healthy individuals. To systematically describe cytokine responses elicited by distinct pathogens, and to determine the impact of genetic variation on cytokine production, we profiled cytokines produced by peripheral blood mononuclear cells from 197 individuals of European origin from the 200 Functional Genomics (200FG) cohort within the Human Functional Genomics Study (www.humanfunctionalgenomics.org), obtained over three different years. By comparing bacteria- and fungi-induced cytokine profiles, we show that most cytokine responses are organized around a physiological response to specific pathogens, rather than around a particular immune pathway or cytokine. We then correlated genome-wide SNP genotypes with cytokine abundance and identified six cytokine QTLs. Among them, a cytokine QTL at NAA35-GOLM1 locus markedly modulates IL-6 production in response to multiple pathogens, and associated with susceptibility to candidemia. Furthermore, the cytokine QTLs we identified are enriched among SNPs previously associated with infectious diseases and heart diseases. These data reveal and begin to explain the variability in cytokine production by human immune cells in response to pathogens.
Infections have shaped the human immune system1,2, with genetic variability contributing to differential susceptibility to infections3,4. However, a specific genetic variant that may confer protection against one infection could prove deleterious for other infections, and this is determined by the local infection burden in different geographical locations2. Moreover, the shaping of the immune system by infections also has direct consequences for the susceptibility to autoimmune and inflammatory diseases5–7. Unravelling the interplay between environmental factors, such as infections, and the genetic variation in a population is crucial for understanding the pathogenesis of common autoimmune and infectious diseases, and for designing novel therapeutic strategies.
The study of healthy population-based cohorts in the context of appropriate microbial stimulations can be used to assess inter-individual variability and to identify genetic loci that regulate immune responses8–12. However, practically all the genome-wide studies done to date have emphasized the regulatory effect of genetic variation on gene expression by focusing on transcript abundance8–12. Since protein quantities are more precise regulators of cellular phenotypes13, characterizing the genetic loci that regulate protein abundances and biological processes is a crucial next step towards mechanistic insights14.
Here we stimulated peripheral blood mononuclear cells (PBMCs), rather than isolated immune cell populations, to capture interactions between different immune cell types (e.g. between monocytes and T cells) that are very important for the natural immune responses. We studied inter-individual and inter-stimulus variation in production of cytokines, and we identified independent genome-wide significant cytokine quantitative trait loci (cQTLs). The regulatory consequences of these cQTLs on downstream genes were characterized by performing the expression-QTL (eQTL) using stimulation-specific expression data15. By comparing the bacterial and fungal induced cytokine profiles and cQTLs, we show that the genetic variability in the immune genes/pathways is organized around a physiological response to specific pathogens, rather than a response aiming to modulate production of a specific cytokine. In addition, we have identified and validated a cytokine QTL that reveals a novel trans-regulatory network in the context of cytokine responses to important human pathogens.
Results
Stimulation increases inter-individual variability in cytokine levels
To systematically determine the impact of genetic variation on cytokine production, we obtained PBMCs from 197 individuals of European origin from the 200 Functional Genomics (200FG) cohort within the Human Functional Genomics Study (www.humanfunctionalgenomics.org) in three different years (Supplementary Table 1), and profiled cytokines secreted in response to a variety of bacterial and fungal pathogens (Supplementary Table 2). In the first study we measured seven cytokines induced by ten different stimuli in 73 healthy volunteers (year 2009 cohort). After stringent quality control of cytokine distributions (see Methods), we obtained a total of 62 (cytokine-stimuli pairs) different cytokine measurements (Supplementary Table 3). Cytokine production follows a non-Gaussian or bimodal distribution, with a few exceptions (Figs. 1a–d). Individuals exhibit significantly increased inter-individual variability (P < 0.01) in cytokine secretion upon stimulation, compared to basal unstimulated state (Figs. 1e–f and Supplementary Fig. 1). We obtained similar results from the other two datasets measured in 2011 and 2013 (Supplementary Fig. 2).
Figure 1. Inter-individual variability in cytokine production upon PBMC stimulation.

(a) PBMCs were cultured with the indicated pathogen-related stimuli for 24 hours time period. Cytokine abundance was measured by ELISA. The distributions of raw cytokine levels from the 2009-cohort were tested using the Shapiro-Wilk normality test Blue indicates normal (P > 0.05); yellow indicates non-normal (p<0.05); and grey indicates distributions not tested due to unavailability of the measurements in 2009 dataset. (b) Distribution of Candida albicans-induced IL-1β. (c–d) Distributions of Candida albicans-induced IFN-γ (c) and Candida albicans-induced IL-17 (d). P values shown in the panels (b–d) were obtained from the Shapiro-Wilk normality test. (e–f) Log-transformed abundance of (e) IL-6 and (f) TNF-α produced upon indicated stimulation. The length of the box in the box-plot is interquartile range (=Q3-Q1). The whiskers indicate the range of one and a half times the length of the box from either end of the box. The equality of variance of cytokine levels before and after stimulation was tested using Levene’s test. The stars on the box plots depict the significance (*, P < 0.01; **, P < 0.001; ***, P < 0.0001; ****, P <0.00001). RPMI, unstimulated state; Bfrag, Bacteroides fragilis; CA, Candida albicans; CAhy, Candida albicans hyphae; Ecoli, Escherichia coli; FSL, lipopeptide; LPS, lipopolysaccharide; MDP, muramyl dipeptide; MTB, Mycobacterium tuberculosis; Pam3Cys, a synthetic triacylated lipopeptide; Saureus, Staphylococcus aureus. The data shown is from one independent experiment from 2009 cohort.
Cytokine responses are organized in a pathogen-specific manner
It is possible that an individual could be either a high or low responder when considering all cytokines (e.g. TNF-α, IL-6 and IL-10) produced in response to one microorganism. Alternatively an individual could be a high or low responder for a particular cytokine in response to stimulation with any type of pathogen. To examine this, we performed a unsupervised clustering of the cytokine responses induced by the various pathogens and microbial ligands. Correlations between levels of various cytokines were found in response to stimulation with a certain pathogen, rather than within a cytokine pathway, and this conclusion was validated by additional analyses in the cohort studies performed in 2011 and 2013 (Fig. 2a) (Supplementary Figs. 3 and 4). For example, bacterial (LPS, E. coli and M. tuberculosis) induced cytokines (TNF-α, IL-6 and IL-10) were strongly clustered together and were clearly separated from fungus (C. albicans) induced cytokine cluster (Fig. 2a).
Figure 2. Cytokine responses are organized around a physiological response towards specific pathogens.
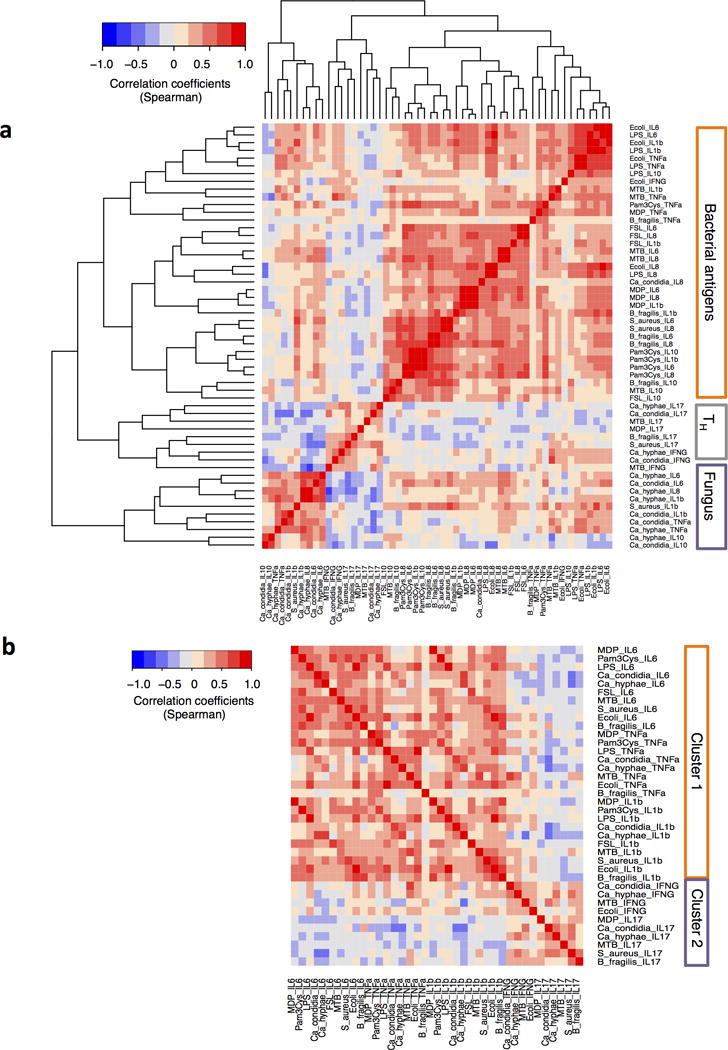
(a) Unsupervised hierarchical clustering of cytokine responses performed using Spearman correlation as the measure of similarity. Red depicts a strong positive correlation whereas blue indicates a strong negative correlation. TH cluster, cytokines derived from T helper cells; Fungus cluster, Candida albicans induced cytokines. (b) Pair-wise correlation coefficients of production of monocyte-derived cytokines and T lymphocyte-derived cytokines. Cluster 1, monocyte-derived cytokines; Cluster 2, TH1 and TH17-derived cytokines. The data shown is from one independent experiment from 2009 cohort.
IFN-γ and IL-17 production were exceptions to this rule, however; the magnitude of IFN-γ or IL-17 production by PBMCs from any individual correlated independently of the identity of the pathogen stimulus (Fig. 2a). This suggests an important evolutionary role for TH17 responses, which may be a general host defence pathway for both bacteria and fungi. Secondly, the differentiation of naïve T cells into TH1 or TH17 effector lymphocytes is under the control of monocyte-derived cytokines16. Therefore, a strong or weak monocyte-dependent cytokine production capacity may be associated with strong or weak helper T cell responses. However, upon pair-wise correlation of cytokines we observed two clusters (Fig. 2b) in which Cluster 1 consists of cytokines mainly produced by monocytes, while Cluster 2 consists of cytokines known to be released mainly by T-cells. Although concentrations of IL-12, IL-18 and IL-23 were very low in our system, and could not be used to assess correlations (data not shown), other monocyte-derived cytokines such as IL-1β and IL-6, which have been reported to induce TH17 responses17, were easily detectable. However, there was a poor correlation between monocyte-derived cytokine production and T cell cytokine production (Figs. 2b–e). Moreover, TH1 and TH17 responses did not strongly correlate with each other, although the correlation was somewhat stronger than between monocyte and lymphocyte responses. This was also consistent when we focused specifically on one type of stimulation. For example, we observed strong correlation between Candida-induced IL-6 and IL-8 and between Candida-induced IL-10 and TNF-α, while IL-17 showed poor correlation with any of the other cytokines (Supplementary Figs. 5a–c). This demonstrates that one particular individual could be a high responder in terms of one set of cytokines but a low responder for other cytokines.
Genome-wide cQTL mapping identifies cell-count independent cQTLs
We generated both genotype and cytokine data for 107 individuals (Supplementary Table 1) We used the 2013 dataset as a discovery cohort to identify genome-wide significant cQTLs since this cohort contained the largest numbers of individuals (n=79). Genotyping was performed using Illumina HumanOmniExpressExome SNP chip and was imputed to obtain genotypes at ~ 7 million SNPs. We selected ~ 4 million SNPs that showed minor allele frequency ≥ 5% and passed other standard quality filters. The cytokine and genotype data available enabled us to study cQTLs for three stimuli: a Gram-negative stimulus (LPS), a mycobacterium (M. tuberculosis; MTB) and a fungus (C. albicans), which provided 18 measurements (3 stimulations×6 cytokines; IL-6, IL-8, IL-10, IL1-Ra, IL-1β, TNF-α). IFN-γ and IL-17 measurements were not available for the 2013 dataset. Upon quality check for cytokine distributions, we obtained 17 stimulation-cytokine pairs (Supplementary Fig. 2) for which the data were reliable to correlate with genotypes at ~ 4 million SNPs. Raw cytokine levels were first log-transformed then mapped to genotype data using a linear regression model with age and gender as covariates. This analysis revealed six significant cQTLs (P < 5 ×10⁻⁸) (Supplementary Tables 4–5). We identified two independent cQTLs for C. albicans-induced IL-6 levels (Figs. 3a–c), two independent cQTLs for MTB-induced IL-8 levels (Figs. 3d–f), one for C. albicans-induced TNF-α and one for LPS-induced IL-10 levels while no cQTLs were identified for IL-1β and IL-1Ra. The total number cQTLs at different thresholds are listed in Supplementary Table 6.
Figure 3. Genome-wide cytokine QTL mapping identifies stimulation-induced cQTLs.

Manhattan plots showing the genome-wide QTL mapping results for (a) Candida albicans-induced IL-6 levels and (d) Mycobacterium tuberculosis-induced IL-8 levels. Horizontal dashed line corresponds to P < 5 × 10⁻⁸. Boxplots showing the association of genotypes at (b) chromosome 9 SNP rs11141235, (c) chromosome 15 SNP rs77181278 with Candida albicans induced IL-6 levels and (e) chromosome 1 SNP rs75839717, (f) chromosome 7 SNP rs74513903 with Mycobacterium tuberculosis induced IL-8 levels. The number of individuals per genotype is shown in parenthesis below each boxplot. The length of the box in the box-plot is interquartile range (=Q3-Q1). The whiskers indicate the range of one and a half times the length of the box from either end of the box. P values were from the linear regression analysis of cytokine on genotype data. The data shown is from one independent experiment from 2013 cohort.
We next tested whether different immune cell counts in PBMC preparations influence the cQTLs. For this we made use of the FACS assessment in the 500 Functional Genomics study (500FG cohort), in which cell populations are examined in detail (see Methods) and measured Candida-induced IL-6 and TNF-α levels. First, we analysed the correlation structure between cell counts and cytokine measurements (Supplementary Fig. 6) and observed weak correlations (mean correlation coefficients across five cell types = 0.062). For example, Candida-induced IL-6 levels in PBMCs showed a weak correlation with monocyte counts, but not with other cell types. We tested the association of Candida-induced cQTLs with cytokine levels in 500FG cohort upon correcting for age, gender and cell counts. Among those three cQTLs tested, SNP rs11141235, associated with Candida-induced IL-6 levels, showed a clear replication of association (Supplementary Table 4; P = 0.017) even after correction for monocyte cell counts (P = 0.030). In contrast, none of the 6 cQTLs were directly associated with cell counts (data not shown), suggesting the independent role of genetic variation on regulating cytokine production.
Correlations between cytokine responses are partially genetically determined
The clustering of cytokine responses (Fig. 2) showed correlations of cytokines induced by specific pathogens, as well as distinct clusters separating the monocyte-derived cytokine production from T cell-derived cytokines induced by various stimuli. To assess whether this observation may show a genetic component, we tested whether strong cQTLs of one pathogen-induced cytokine (P < 1.0×10⁻⁵) could also be associated with cytokine levels induced by other pathogens albeit with nominal significance (P < 0.05). QTLs of IL-10 were more likely to be pathogen-specific (Supplementary Fig. 7a), while QTLs of other cytokines (IL-6, IL-8 and TNF-α) were more likely to be shared genetic loci that respond to all pathogens (Supplementary Figs. 7b–c). We found similar results with different P value thresholds (Supplementary Fig. 8). We also found that all six GWAS-significant cQTLs were associated with cytokines induced by other bacterial and fungal stimulations (Fig. 4a). SNPs affecting fungus-induced IL-6 and IL-8 were also strongly associated with bacteria-induced IL-6 and IL-8 levels, but not with IL-10 and TNF-α (Fig. 4a). This indicates that the SNPs associated with IL-6 and IL-8 levels are pathogen-independent, maybe because these SNPs are acting on genes/proteins that are downstream of pathogen recognition receptors and therefore are shared between pathogens. These results suggest that the correlation between monocyte-derived cytokines (Fig. 2) may be partly genetically determined. The top association for Candida-induced IL-6 at the chr9q21 locus provides an illustrative example for a strong shared cQTL (Figs. 4b–c), where the minor allele C at SNP rs11141235 was not only associated with lower C. albicans-induced IL-6 production (Fig. 3b), but also with LPS-induced (Fig. 4b) and MTB induced IL-6 production (Fig. 4c). Importantly, the cQTLs identified in the 2013 cohort were all validated in the other cohorts, demonstrating the robustness of the associations identified (Supplementary Fig. 9).
Figure 4. Genome-wide significant cQTLs affect cytokine production induced by both bacterial and fungal stimulation.

(a) The P values of six significant cQTLs for other cytokine levels. The colour legend for the heat map indicates the range of P values from QTL mapping. P values were from the linear regression analysis of cytokine on genotype data. (b,c) Correlation of SNP rs11141235, genotype with IL-6 induced by LPS (b) and by Mycobacterium tuberculosis (c). The length of the box in the box-plot is interquartile range (=Q3-Q1). The whiskers indicate the range of one and a half times the length of the box from either end of the box. The number of individuals per genotype is shown in parenthesis below each boxplots. (d) P values for differential expression of genes (±250 kb around the SNP) selected from genome-wide significant cQTL loci upon different stimulations in human PBMCs (n=8). P values were from differential expression analysis using threshold of FDR=0.05 and fold change > 2. Genes were selected based on their physical positions which are within ±250 kb window around the SNP. PBMC stimulations were done for either 4 h or 24 h. The figure show results from both 4h and 24h. Red: up-regulation; Blue: down-regulation; *, genes with suggestive eQTLs in RNAseq data. e) GOLM1 expression levels upon C. albicans stimulation in PBMCs of 70 samples.
A cQTL gene GOLM1 on chr9q21 modulates cytokine production
To identify the putative causal genes at six significant cQTLs, we tested the expression levels of all genes located within a 500kb cis-window of the 6 cQTLs in PBMCs stimulated with different microbial antigens (Fig. 4d). Genes identified by this differential expression analysis were not cytokine genes, suggesting that the cQTLs identified are mainly trans-QTLs of regulatory genes modulating cytokine production.
The top associated cQTL rs11141235 on the chromosome 9q21 region was associated with Candida-induced IL-6 levels (Fig. 3a). To identify the causal mechanism at this locus, we generated gene expression data by RNA sequencing in PBMCs from 70 individuals18 with and without Candida stimulation. We reconfirmed the significant differential expression of GOLM1 in response to Candida stimulation in this larger cohort (Fig. 4e). Next, we mapped Candida-response eQTL at rs11141235 and at another SNP rs11141242 in the locus (D′=0.95), which is a more frequent polymorphism. The eQTL results indicated that rs11141242 was significantly (P = 0.016) associated with the expression levels of GOLM1 (Golgi membrane protein 1), where the minor allele was associated with lower levels of GOLM1 (Fig. 5a), while rs11141235 showed a similar trend (Fig. 5b), suggesting the role of haplotypes in regulating GOLM1 expression.
Figure 5.

GOLM1 is involved in IL-6 production. Boxplots showing the correlation between gene expression levels of GOLM1 of 69 PBMC samples and SNPs (a) rs11141242 (P value = 0.017) and (b) rs11141235 upon C. albicans stimulation. c) Co-expression network for GOLM1 built using gene expression data using Spearman correlation from 70 PBMC samples stimulated with C. albicans. The red lines depict the correlation coefficient of more than 0.7 between other genes and GOLM1 in the network. (d) Pathway enrichment analysis on genes that are highly correlated with GOLM1 (Spearman correlation coefficient > 0.7) based on Reactome pathway database. (e) Correlation between secreted IL-6 levels and genotypes at rs7036187 of 117 candidemia patients (Student t test P = 0.015). The length of the box in the box-plot is interquartile range (=Q3-Q1). The whiskers indicate the range of one and a half times the length of the box from either end of the box. There are 111 patients with AA genotype and 6 patients with AG genotype.
GOLM1 cQTL is associated with susceptibility to candidemia
GOLM1 encodes a 73kDa Golgi protein and is upregulated in response to viral infection19. We assessed whether genetic variants in GOLM1 locus could influence susceptibility to disseminated infection with C. albicans in a previously described cohort of 225 European patients with candidemia20. Since the genotype data at rs11141235 was not available from this cohort, we tested another variant, rs7036187, that is in linkage disequilibrium with rs11141235 (D′ =1) in the GOLM1 locus and found it to be associated with candidemia, where the risk allele A was more frequent in cases (P = 0.016, Odds ratio= 2.36). To test whether the GOLM1 cQTL affects candidemia through the IL-6 pathway we built a co-expression network around the GOLM1 using gene expression data from PBMCs of 70 healthy volunteers either upon Candida stimulation (Fig. 5c) or without stimulation (Supplementary Fig. 10). Pathway enrichment analysis on strongly co-expressed genes (r2 < 0.8) with GOLM1 during Candida stimulation showed GOLM1 co-expressed genes to be enriched for cytokine production pathways, which suggests that GOLM1 is associated with cytokine signaling (Fig. 5d). The enrichment of genes for cytokine signalling after stimulation could be also the consequence of the stimulation and not necessarily specific to GOLM1 co-expression. Therefore, we tested whether the extent of gene enrichment for IL-6 signaling was specifically linked to GOLM1 upon Candida stimulation (see Methods), when compared to randomly chosen differentially expressed genes in response to Candida stimulation. This analysis showed a significantly stronger enrichment of genes co-expressed with GOLM1 for IL-6 signaling than randomly chosen genes (Supplementary Figs. 11a–b). In addition, in patients with candidemia, we also assessed the effects of the rs7036187 polymorphism, a SNP associated to susceptibility to disease, on serum IL-6 concentrations. This SNP was associated with circulating IL-6 concentration (Fig. 5e), where AG genotypes were associated with lower levels of IL-6 (P = 0.015) suggesting that the polymorphisms in the GOLM1 locus may influence Candida-induced cytokines and susceptibility to candidemia.
Cytokine QTLs overlap with human disease associated SNPs
We tested whether SNPs previously associated with human diseases and particularly with infectious diseases are enriched with cQTLs. We extracted GWAS SNPs from the NHGRI GWAS catalog21 and binned them into eight categories based on their association with different human phenotypes (See Methods). Next we identified all cQTLs that were associated with cytokine levels with a P value < 0.05 (Supplementary Table 6) and tested whether these cQTLs are linked to GWAS SNPs or their proxies. Sixty-one percent of infectious-disease-associated SNPs were also cQTLs, and 43% of immune-mediated-disease associated SNPs were also cQTLs (Fig. 5a). We used height-associated SNPs as background SNPs (or null set of SNPs) to test whether cQTLs are more often associated with a particular human disease. 38.5% of height associated SNPs were also cQTLs. We observed a significant enrichment (P < 9.99 ×10⁻⁸) of cQTLs among infectious disease-associated SNPs. A proportion of heart disease-associated SNPs were also cQTLs, suggesting a role for cytokine pathways in the pathogenesis of cardiovascular diseases (Fig. 6a). We found similar results when we selected cQTLs with a different P value (P < 0.01, Supplementary Table 6) threshold (Supplementary Fig. 12) to test for their enrichment among GWAS SNPs. However, the sensitivity of the enrichment results dropped when we used more stringent P values to call putative cQTLs since the number of cQTLs available to perform enrichment analysis was reduced.
Figure 6. Association of cQTLs with infectious diseases.

(a) The percentage of SNPs associated with each category of disease that also qualify as suggestive cytokine QTLs (P value <0.05). Dotted line indicates the percentage of cQTLs that overlapped with height-associated SNPs, which served as reference set (null set). Enrichment analysis from Fisher exact test are indicated by red “stars” (***, P < 10−8; **, P < 10−4; *, P < 0.05). (b–c) QTLs associated with indicated stimulus-cytokine pairs (rows) compared with SNPs associated with susceptibility to the indicated pathogens (columns) (b) and with IBD (c). The colours represent the –log10P values of cytokine QTLs. P values were obtained from linear regression model of cytokine levels on genotype data. Red and blue indicate association with upregulated or downregulated cytokine levels, respectively.
Furthermore, we tested whether infectious and autoimmune disease-associated SNPs are predominantly associated with increased or decreased cytokine production. We observed no significant difference between the numbers of autoimmune disease risk alleles associated with increased or decreased cytokine production (Supplementary Fig. 8). In contrast, risk alleles of infectious disease SNPs, with the exception of malaria- associated SNPs, are mostly associated with lower cytokine production capacity (Fig. 6b). These patterns suggest that the genetic alterations associated with autoimmune diseases are correlated with both increased and decreased cytokine production capacity, whereas susceptibility to infections is associated with a lower capacity for cytokine production from monocytes or lymphocytes, depending on the type of infection. Inflammatory bowel disease (IBD) is a chronic immune-mediated disease of the human gastrointestinal tract. We observed a trend where high proportion of risk alleles of IBD-associated SNPs were associated with lower cytokine production capacity (Fig. 6c), suggesting the role of infectious agents in IBD. These results again highlight the importance of response QTLs to understanding complex human diseases.
Discussion
While several recent studies investigated immune traits during steady-state conditions22–24 or serologic responses to past infections25, an important question remains regarding the architecture of the immune response and its relation to genetic variation. While several eQTL studies addressed this important question using different immune cell populations either without or upon stimulation8,9,11,12, they have two intrinsic limitations: they only used stimulation of purified cell populations with purified ligands (with the exception of influenza virus stimulation in one of the studies), and eQTLs only interrogate transcript levels which are known to correlate only partially with protein abundance13,26–29. The present study therefore addresses the importance of understanding human immune responses to pathogens by assessing the architecture of one of the most important steps in the activation of the immune responses: cytokine production.
First, our study not only confirms the non-parametric nature of cytokine production distribution of monocyte-derived pro-inflammatory cytokines30,31, but also extend this to T-lymphocyte derived cytokines. The non-Gaussian or bi-modal distribution of cytokine production identifies low- and high-producers, giving scope to the hypothesis that the cytokine synthesis phenotype may have a strong effect on susceptibility to immune-mediated diseases.
Second, the production capacity of various cytokines strongly correlates when cells were stimulated with a specific pathogen, while the correlation was poor when comparing bacterial versus fungal stimulation. This observation makes sense from both an evolutionary point of view, as immune responses mainly need to have plasticity to respond to specific infectious pressures in a certain geographic area2, and from a biological point of view in which Toll-like receptors are the main receptor pathway recognizing bacteria, while C-type lectin receptors mainly recognize fungi. Importantly, regulation of the pathogen-specific cytokine responses is most likely only partially genetic, as some genetic polymorphisms regulate multiple cytokine responses to a certain pathogen (especially for monocyte-derived production), while others regulate the monocyte-derived production of cytokine responses due to multiple pathogens (see below). It is therefore likely that non-genetic external factors encountered during one’s lifetime also play an important role in long-term modulation of cytokine responses, and epigenetic regulation may represent one of the molecular substrates for this process32,33.
One remarkable exception to the rule of pathogen-centric responses is represented by specific lymphocyte responses such as IL-17 production, which represents a separate strongly correlated cluster independent of the type of pathogen and may be an important aspect of IL-17 biology. Th17 responses are crucial for mucosal host defence34, and defects in this pathway lead to high susceptibility to both fungal and bacterial pathogens35–37. These data argue that Th17 responses are a crucial component of host defence against both bacteria and fungi.
Third, we have identified six novel genome-wide significant cQTLs that influence cytokine responses: IL-6 and IL-8 identify the highest number of cQTLs, while IL-1β and IL-1Ra show no cQTLs, suggesting that the immune response can buffer easier variation in IL-6 and IL-8, while the IL-1 pathway is highly conserved. Moreover, cQTLs are trans-QTLs that influence cytokine production indirectly through regulatory loops, in line with the observation that cytokine responses are organized around regulation of pathogen-specific host responses, rather than towards regulation of specific cytokines. This is in line with a recent study showing that 90% of causal SNPs tend to occur near binding sites for master regulators of stimulus-dependent gene expression and map to enhancers which gain histone acetylation38. One of the strongest cQTLs that we identified influences expression of the GOLM1 upon Candida stimulation, which in turn influences susceptibility to candidemia. GOLM1 encodes a Golgi phosphoprotein, also referred as GP73, which is known to respond to viral infections19. This molecule has also been tested as a useful circulating biomarker for several viral and non-viral induced liver diseases39,40 and the serum GOLM1 levels was shown to correlate with serum IL-6 levels in hepatocellular carcinoma41. The trans-regulatory network of GOLM1 that we describe here provides further insights into the understanding of the GOLM1-mediated cytokine regulation, not only in cancer but also for infectious diseases.
There are also some limitations to the study. Firstly, we cannot exclude that cQTLs were missed and/or some of the cQTLs with rare allele frequencies are false positives in the analyses due to the relatively low number of volunteers. The same reason prevented us from performing a robust assessment of cQTLs of lymphocyte-derived cytokines. Secondly, the present study investigated cytokine levels induced by bacterial and fungal pathogens, but not viral stimuli. Thirdly, variation in the immune system can be driven by both heritable and non-heritable influences. Finally, the experimental set up of ex-vivo PBMCs stimulated for 24 hours provides the opportunity to study the interactions between immune cells such as monocytes, T cells and B cells in response to pathogens. However the time-dependent dynamic interactions at tissue level are only partially captured. Therefore, PBMCs alone may not fully provide the in-vivo picture of immune response since cell-cell interactions also occur at specific tissue locations. Some of these remaining questions will be addressed by the currently ongoing analyses of a larger cohort of 500 healthy volunteers within the Human Functional Genomics Study, in which more volunteers, a larger panel of stimuli, and external factors (e.g. diet, microbiome) will be included.
Online methods
Ethics statement
Samples of venous blood were drawn after informed consent was obtained, and the study was approved by the Ethical Committee of Radboud University Nijmegen (nr. 42561.091.12). Experiments were conducted according to the principles expressed in the Declaration of Helsinki.
200FG cohort
Individuals in this study were foresters from the ‘Geldersch Landschap’, ‘Hoge Veluwe’, ‘Twickel’, and ‘Kroondomein het Loo’ in the Netherlands. Foresters were asked to donate blood in order to determine the serology against Borrelia bacteria, since Lyme disease occurs as an occupational disease. The cohort of individuals was chosen because of the good health reported by this general population. None of the volunteers included in the study had Borrelia infection. In this cohort, all individuals gave written informed consent to donate extra blood to use for research. Blood was drawn in 2009, 2011 and 2013. The foresters were between 23–73 years old, and consisted of 77% males and 23% females. The cQTLs identified were additionally validated in a cohort of 500 healthy individuals of Dutch European ancestry from the Human Functional genomics Project (500FG cohort, www.humanfunctionalgenomics.org).
PBMC collection and stimulation experiments
After obtaining informed consent, venous blood was drawn from the cubital vein of volunteers into 10 mL EDTA tubes (Monoject). Isolation of PBMCs was performed according standard protocols, with minor modifications. The PBMC fraction was obtained by density centrifugation of blood diluted 1:1 in pyrogen-free saline over Ficoll-Paque (Pharmacia Biotech). Cells were washed twice in saline and suspended in medium (RPMI 1640) supplemented with gentamicin 10 mg/mL, L-glutamine 10 mM and pyruvate 10 mM. Addition of antibiotics such as gentamycin is a standard methodology used in order to avoid contamination of cultures, and it does not influence the ability to induce cytokine production by PBMCs or macrophages (data not shown). The cells were counted in a Coulter counter (Coulter Electronics) and the number was adjusted to 5×10⁶ cells/mL. Then 5×10⁵ PBMCs in a 100 μL volume were added to round-bottom 96-wells plates (Greiner) and incubated with 100 μL of stimulus. After 24 h the supernatants were collected and stored at −20°C until assayed. The stimulation time periods were chosen based on extensive previous studies that showed that 24 h stimulation was best suited to assess monocyte-derived cytokines42,43.
Stimulation of PBMCs
Bacteria
Bacteroides fragilis (NCTC 10584) grown anaerobically overnight at 37°C on blood agar plates (BD Biosciences, Franklin Lakes, NJ, USA) was inoculated in 20 mL pre-warmed and pre-reduced Brain Heart Infusion broth (BD Diagnostics, Basel, Switzerland) and again grown anaerobically overnight at 37 °C until reaching stationary growth phase mimicking growth conditions in abscesses. Bacterial suspensions were washed three times in phosphate-buffered saline (PBS; B. Braun Medical B.V., Melsungen, Germany) and heat-killed at 95°C for 30 min. Before heat-killing, aliquots of bacterial suspensions were taken to determine colony-forming unit (cfu) counts. Heat-killed bacteria were washed again and after adjusting the concentration in PBS to 1 × 10⁸ cfu/mL, stored at −80 °C. B. fragilis was used in the stimulation experiments as 1×10⁶/mL. E. coli ATCC 25922 was grown overnight in culture medium, washed three times with PBS, and heat-killed for 60 min at 80°C; Staphylococcus aureus strain ATCC 29213 was grown overnight in culture medium, washed twice with cold PBS, and heat-killed for 30 min at 100°C; both E. coli and S. aureus were used in a final concentration of 1×10⁶/mL. Success of heat-inactivation was confirmed by cultures.
Cultures of H37Rv Mycobacterium tuberculosis (MTB) were grown to mid-log phase in Middlebrook 7H9 liquid medium (Difco, Becton-Dickinson) supplemented with oleic acid/albumin/dextrose/catalase (OADC) (BBL, Becton-Dickinson), washed three times in sterile saline, heat killed and then disrupted using a bead beater, after which the concentration was measured using a bicinchoninic acid (BCA) assay (Pierce, Thermo Scientific).
Fungi
Heat-killed C. albicans blastoconidia (strain ATCC MYA-3573, UC 820) at a concentration of 106 CFU/mL were used throughout this study. To generate hyphae, live yeast forms of Candida were grown for 24 h at 37°C in RPMI 1640 (Gibco-BRL, Grand Island, NY), adjusted to pH 6.4 by using hydrochloric acid. After 24 h, more than 95% of blastoconidia were grown to hyphae, which were checked by microscope. Hyphae were heat killed for 45 min at 98°C and resuspended in RPMI 1640 to a hyphal inoculum size that originated from 106/mL blastoconidia (referred to as 106/mL hyphae).
Ligands – FSL-1 and Pam3Cys were purchased at EMC microcollections (L-7000, L-2000, respectively) and used in a final concentration of 1 μg/mL and 10 μg/mL.
Microbial ligands
MDP (muramyl dipeptide) was purchased at Sigma (A-9519) and used at a final concentration of 10 μg/mL. LPS (E. coli serotype 055:B5) was purchased from Sigma and an extra purification step was performed as described previously44. Purified LPS was tested in TLR4−/− mice for the presence of contaminants and did not have any TLR4-independent activity45.
A total of 5×10⁵ PBMCs in a total volume of 200 μL per well were incubated at 37°C in round-bottom 96-well plates (Greiner) with the different stimuli, as indicated above. After 24 h (early cytokines IL-1β, TNF-α, IL-6, IL-8, and IL-10), or 7 days of incubation (IFN-γ and IL-17), supernatants were collected and stored at −20°C until assayed. When cells were cultured for 7 days, this was done in the presence of 10% human pooled serum.
Cytokine measurements
Concentrations of human cytokines determined using specific commercial ELISA kits from R&D Systems: IL-1β (catalog number DLB50), IL-6 (D6050), IL-10 (D1000B), TNF-α (DTA00C), IL-17 (D1700), or IFN-γ (DIF50) in accordance with the manufacturers’ instructions. Detection limits were 20 pg/mL, except for IFN-γ ELISA (12 pg/mL).
IL-6 measurements in Candidemia cohort
Concentrations of human IL-6 in the serum of candidemia patients were determined using specific commercial ELISA kits (PeliKine Compact or R&D Systems), in accordance with the manufacturers’ instructions. The data were available for 117 Caucasian candidemia patients. Candidemia patients were stratified on rs7036187 SNP genotype to obtain 111 AA and 6 AG patients. For each individual the median values of IL-6 levels measured across 15 days were used. The statistical difference was tested using a student t test (one-sided) by comparing the log2 transformed IL-6 values. P value less than 0.05 was considered significant.
Cytokine clustering and variance analysis
Raw cytokine levels were first log-transformed, then cytokine measurements showing little/no variation across individuals were filtered out for the follow-up analysis. We excluded 9 cytokine measurements in 2009. The normality test was performed on both raw (Fig. 1a) and log-transformed data (Supplementary Fig. 13) using Shapiro-Wilk normality test, respectively. P value > 0.05 was used as threshold for normal distribution. Unsupervised hierarchical clustering was performed using Spearman correlation as the measure of similarity. In order to test the equality of variance of cytokine levels before and after stimulation, Levene’s test was used.
Genotyping, quality control and imputation
DNA samples of 112 individuals were genotyped using the commercially available SNP chip, Illumina HumanOmniExpressExome-8 v1.0. The genotype calling was performed using Opticall 0.7.046 using the default settings. Four samples with a call rate ≤ 0.99 were excluded from the dataset as were variants with a HWE ≤ 0.0001, call rate ≤ 0.99 and MAF ≤ 0.001. Two samples were excluded as potential ethnic outliers identified by multi-dimensional scaling plots of samples merged with 1000 Genome data (Supplementary Fig. 14). This resulted in a dataset of 106 samples containing genotype information of 282,382 variants for further imputation. The strands and variant-identifiers were aligned to the reference Genome of The Netherlands (GoNL)18 dataset using Genotype Harmonizer47. The data was phased using SHAPEIT2 v2.r64448 using the GoNL as a reference panel. Finally this data was imputed using IMPUTE249 with the GoNL as the reference panel50. Post imputation provided 7512899 variants. We selected 3959389 SNPs that showed MAF ≥ 5%, INFO score ≥ 0.8 and 3 samples per genotype for downstream cytokine QTL mapping.
Cytokine QTL mapping
Lack of either DNA or cytokine measurements for 90 individuals sampled in three different years restricted us to obtain both genotype and cytokine data for 107 individuals out of 197 individuals (Supplementary Table 1). We used the 2013 dataset as a discovery cohort to identify genome-wide significant cQTLs since this cohort had the largest numbers of individuals (n=79). The 2009 (n=30) and 2011 datasets (n=78) were used as validation cohorts. We coded gender information either 0 for females or 1 for males. The actual age and coded gender information were included as co-variables in the linear model to correct the cytokine distributions for QTL mapping. We focused only on infectious stimulations such as LPS, Candida and MTB to map cQTLs, which provided 18 measurements (3 stimulations× 6 cytokines). Since it was difficult define a numerical cut-off to filter out the cytokine measurements that were not informative, we visually inspected all the cytokine distribution plots to check if the cytokine measurements provide clear variation across individuals (Supplementary Fig. 15). By manually checking the log-transformed cytokine distributions, we excluded one measurement (MTB-induced TNF-α) from further QTL mapping as this cytokine measurement showed very little variation (low production capacity in the majority of individuals), and was thus not informative (Supplementary Fig. 2). Raw cytokine levels were first log-transformed then mapped to genotype data using a linear regression model with age and gender as covariates. A P value < 5×10⁻⁸ was considered to be the threshold for significant cytokine QTLs. In order to check whether our QTL mapping indicated any significant inflation of test statistics due to population structure, we calculated genetic inflation factor lambda (observed vs. expected P values) for all cytokine measurements. We found that the lambda values were around 1 (0.99 to 1.04) indicating there is no or very little population stratification (Supplementary Fig. 16). Since the different amounts of cytokine production can also be driven by different immune cell counts in PBMC preparations, we tested whether cQTLs can influence the cytokine levels independent of different cell counts. For this we focused on Candida-induced cQTLs and made use of the FACS assessment in the 500 Functional Genomics study (500FG cohort), in which cell populations are examined in detail. We obtained cell count data measured by FACS for total lymphocytes, T cells, B cells, monocytes and NK cells from 487 individuals from the 500FG cohort. We measured IL-6 and TNF-α levels in response to Candida stimulation to check if the Candida-induced cQTLs can be replicated after cell counts correction.
RNA sequencing and expression analysis
Candidate genes from significant cytokine QTL loci were further tested if they responded to any of the pathogens using RNA seq data from PBMCs of eight individuals, which were stimulated by Pseudomonas aeruginosa, Streptococcus pneumoniae, Mycobacterium tuberculosis, Candida albicans, Aspergillus fumigatus, and IL-1alpha. The PBMCs from 70 individuals of the GONL cohort18 were stimulated with or without Candida albicans as previously described51. Sequencing reads were mapped to the human genome using STAR (version 2.3.0)52. The aligner was provided with a file containing junctions from Ensembl GRCh37.71. Htseq-count of the Python package HTSeq (version 0.5.4p3) was used (The HTSeq package, http://www-huber.embl.de/users/anders/HTSeq/doc/overview.html) to quantify the read counts per gene based on annotation version GRCh37.71, using the default union-counting mode. Differentially expressed genes were identified by statistics analysis using DESeq2 package from bioconductor53. The statistically significant threshold (FDR P ≤ 0.05 and Fold Change ≥ 2) was applied. Gender and age were included as known covariates in a linear model for assessing genotype effect. All eQTL mapping was done using Matrix-eQTL54. To build co-expression networks, we extracted top 25 co-expressed genes for top 20 differentially expressed genes in Candida-stimulation experiment and performed the pathway enrichment analysis on these gene-sets. Then, we compared whether these genes are also enriched for IL-6 signaling similar to GOLM1 co-expressed genes (Supplementary Fig. 11a). In addition, we extracted the co-expressed genes with GOLM1 and ranked them according to their co-expression correlation values with GOLM1. We performed pathway enrichment analysis on top 50 (r2 with GOLM1 > 0.7), middle 50 (r2 with GOLM1 between 0.7–0.4), bottom 50 (r2 with GOLM1 < 0.2) and randomly chosen 50 genes. Then, we tested if the enrichment for IL-6 signaling is dependent on the strength of the co-expression with GOLM1 (Supplementary Fig. 11b).
Extraction of infectious disease associated SNPs
SNPs associated with a number of infectious diseases that showed P value < 9.99×10⁻⁶ were extracted using the GWAS catalogue (http:/www.genome.gov/gwasstudies). As of December 2014, there were two studies on leprosy, two studies on malaria, four studies on tuberculosis, four studies on chronic hepatitis C infection, one study on HPV seropositivity, one study on Dengue shock syndrome and one study on meningococcal susceptibility. By systematic search in the literature, SNPs associated with susceptibility to additional infectious diseases not reported in the GWAS catalogue were also extracted. There were three studies on invasive aspergillosis and two studies on pneumococcal disease (Supplementary Table 7). The infectious disease associated SNPs shown in Fig. 6 are rs1519551, rs4833095, rs3132468, rs9271858, rs16948876, rs3764147, rs11036238, rs9940464, rs6755404, rs958617, rs6545883, rs1900442, rs8005962, rs1925714, rs4331426, rs2505675, rs160441, rs1948632, rs6538140, and rs9373523.
GWAS SNP extraction and enrichment analysis
GWAS SNPs from the GWAS catalog21 and their proxies (r2 ≥ 0.8 from 500kb window) were first extracted, which provided a list of SNPs associated to 122 different human traits and diseases. We selected diseases/traits for which at least 10 independent SNPs were reported to be associated. We then binned these GWAS SNPs into eight categories based on their association to closely related human phenotypes (cancer, immune-mediated diseases, infectious disease, heart-related traits, blood-related traits, metabolic traits, height and Type 2 diabetes related traits). Duplicated SNPs are removed from further analysis. We then intersected the SNPs of each category with cQTLs that showed P < 0.05 in our study. The Fisher exact test was applied to test the over-representation cQTL SNPs in infectious disease SNPs using the height associated SNPs as reference.
Online database
All data used in this project have been meticulously catalogued and archived at BBMRI-NL data infrastructure (https://bbmri.nl/molgenis/200FG) using the MOLGENIS open source platform for scientific data. This allows flexible data querying and download, including sufficiently rich metadata and interfaces for machine processing (R statistics, REST API) and using FAIR principles to optimize Findability, Accessibility, Interoperability and Reusability.
Supplementary Material
Acknowledgments
The authors thank all volunteers from the 200 Functional Genomics cohort of the Human Functional Genomics Study for participation in the study. The authors would like to thank Kate McIntyre for editing the final text. This study was partially supported by a ERC Consolidator Grant (3310372) to MGN and by the ERC Advanced Grant (FP/2007-2013/ERC grant 2012-322698 to CW), the Dutch Digestive Diseases Foundation (MLDS WO11-30 to CW and VK), the European Union’s Seventh Framework Programme (EU FP7) TANDEM project (HEALTH-F3-2012-305279 to CW and VK), and Netherlands Organization for Scientific Research (NWO) VENI grant (863.13.011 to YL). This study made use of data generated by the ‘Genome of the Netherlands’ project, which is funded by the Netherlands Organization for Scientific Research (grant no. 184021007). The data were made available as a Rainbow Project of BBMRI-NL.
Footnotes
Author contributions
M.G.N. and C.W. coordinated the recruitment of cohorts and data generation. M.G.N., V.K., L.A.B.J. and C.W. conceived and directed the study with input from all authors. Y.L. analysed and interpreted the data. P.D., I.R.-P., V.M. and V.K. performed genotyping and imputation. M.O., S.S. and M.J. conducted the stimulation experiments and cytokine quantification. M.A.S., R.J.X. and L.F. provided the computational framework for the study and critical inputs to the study design. M.G.N., V.K., C.W., Y.L. and M.O. wrote the manuscript with input from all authors.
References
- 1.Fumagalli M, et al. Signatures of environmental genetic adaptation pinpoint pathogens as the main selective pressure through human evolution. PLoS genetics. 2011;7:e1002355. doi: 10.1371/journal.pgen.1002355. [DOI] [PMC free article] [PubMed] [Google Scholar]
- 2.Netea MG, Wijmenga C, O’Neill LA. Genetic variation in Toll-like receptors and disease susceptibility. Nature immunology. 2012;13:535–542. doi: 10.1038/ni.2284. [DOI] [PubMed] [Google Scholar]
- 3.Karlsson EK, Kwiatkowski DP, Sabeti PC. Natural selection and infectious disease in human populations. Nature reviews Genetics. 2014;15:379–393. doi: 10.1038/nrg3734. [DOI] [PMC free article] [PubMed] [Google Scholar]
- 4.Hill AV. Evolution, revolution and heresy in the genetics of infectious disease susceptibility. Philosophical transactions of the Royal Society of London Series B, Biological sciences. 2012;367:840–849. doi: 10.1098/rstb.2011.0275. [DOI] [PMC free article] [PubMed] [Google Scholar]
- 5.Jostins L, et al. Host-microbe interactions have shaped the genetic architecture of inflammatory bowel disease. Nature. 2012;491:119–124. doi: 10.1038/nature11582. [DOI] [PMC free article] [PubMed] [Google Scholar]
- 6.Kumar V, Wijmenga C, Xavier RJ. Genetics of immune-mediated disorders: from genome-wide association to molecular mechanism. Current opinion in immunology. 2014;31C:51–57. doi: 10.1016/j.coi.2014.09.007. [DOI] [PMC free article] [PubMed] [Google Scholar]
- 7.Zhernakova A, et al. Evolutionary and functional analysis of celiac risk loci reveals SH2B3 as a protective factor against bacterial infection. American journal of human genetics. 2010;86:970–977. doi: 10.1016/j.ajhg.2010.05.004. [DOI] [PMC free article] [PubMed] [Google Scholar]
- 8.Fairfax BP, et al. Innate immune activity conditions the effect of regulatory variants upon monocyte gene expression. Science. 2014;343:1246949. doi: 10.1126/science.1246949. [DOI] [PMC free article] [PubMed] [Google Scholar]
- 9.Lee MN, et al. Common genetic variants modulate pathogen-sensing responses in human dendritic cells. Science. 2014;343:1246980. doi: 10.1126/science.1246980. [DOI] [PMC free article] [PubMed] [Google Scholar]
- 10.Berry MP, et al. An interferon-inducible neutrophil-driven blood transcriptional signature in human tuberculosis. Nature. 2010;466:973–977. doi: 10.1038/nature09247. [DOI] [PMC free article] [PubMed] [Google Scholar]
- 11.Ye CJ, et al. Intersection of population variation and autoimmunity genetics in human T cell activation. Science. 2014;345:1254665. doi: 10.1126/science.1254665. [DOI] [PMC free article] [PubMed] [Google Scholar]
- 12.Raj T, et al. Polarization of the effects of autoimmune and neurodegenerative risk alleles in leukocytes. Science. 2014;344:519–523. doi: 10.1126/science.1249547. [DOI] [PMC free article] [PubMed] [Google Scholar]
- 13.Vogel C, Marcotte EM. Insights into the regulation of protein abundance from proteomic and transcriptomic analyses. Nature reviews Genetics. 2012;13:227–232. doi: 10.1038/nrg3185. [DOI] [PMC free article] [PubMed] [Google Scholar]
- 14.Naitza S, et al. A genome-wide association scan on the levels of markers of inflammation in Sardinians reveals associations that underpin its complex regulation. PLoS genetics. 2012;8:e1002480. doi: 10.1371/journal.pgen.1002480. [DOI] [PMC free article] [PubMed] [Google Scholar]
- 15.Fehrmann RS, et al. Gene expression analysis identifies global gene dosage sensitivity in cancer. Nature genetics. 2015 doi: 10.1038/ng.3173. [DOI] [PubMed] [Google Scholar]
- 16.Zambrano-Zaragoza JF, Romo-Martinez EJ, Duran-Avelar Mde J, Garcia-Magallanes N, Vibanco-Perez N. Th17 cells in autoimmune and infectious diseases. International journal of inflammation. 2014;2014:651503. doi: 10.1155/2014/651503. [DOI] [PMC free article] [PubMed] [Google Scholar]
- 17.Mills KH, Dungan LS, Jones SA, Harris J. The role of inflammasome-derived IL-1 in driving IL-17 responses. Journal of leukocyte biology. 2013;93:489–497. doi: 10.1189/jlb.1012543. [DOI] [PubMed] [Google Scholar]
- 18.Whole-genome sequence variation population structure demographic history of the Dutch population. Nature genetics. 2014;46:818–825. doi: 10.1038/ng.3021. [DOI] [PubMed] [Google Scholar]
- 19.Kladney RD, et al. GP73, a novel Golgi-localized protein upregulated by viral infection. Gene. 2000;249:53–65. doi: 10.1016/S0378-1119(00)00136-0. [DOI] [PMC free article] [PubMed] [Google Scholar]
- 20.Kumar V, et al. Immunochip SNP array identifies novel genetic variants conferring susceptibility to candidaemia. Nature communications. 2014;5:4675. doi: 10.1038/ncomms5675. [DOI] [PMC free article] [PubMed] [Google Scholar]
- 21.Welter D, et al. The NHGRI GWAS Catalog, a curated resource of SNP-trait associations. Nucleic acids research. 2014;42:D1001–1006. doi: 10.1093/nar/gkt1229. [DOI] [PMC free article] [PubMed] [Google Scholar]
- 22.Orru V, et al. Genetic variants regulating immune cell levels in health and disease. Cell. 2013;155:242–256. doi: 10.1016/j.cell.2013.08.041. [DOI] [PMC free article] [PubMed] [Google Scholar]
- 23.Roederer M, et al. The genetic architecture of the human immune system: a bioresource for autoimmunity and disease pathogenesis. Cell. 2015;161:387–403. doi: 10.1016/j.cell.2015.02.046. [DOI] [PMC free article] [PubMed] [Google Scholar]
- 24.Brodin P, et al. Variation in the human immune system is largely driven by non-heritable influences. Cell. 2015;160:37–47. doi: 10.1016/j.cell.2014.12.020. [DOI] [PMC free article] [PubMed] [Google Scholar]
- 25.Rubicz R, et al. Genome-wide genetic investigation of serological measures of common infections. European journal of human genetics: EJHG. 2015 doi: 10.1038/ejhg.2015.24. [DOI] [PMC free article] [PubMed] [Google Scholar]
- 26.Ghazalpour A, et al. Comparative analysis of proteome and transcriptome variation in mouse. PLoS genetics. 2011;7:e1001393. doi: 10.1371/journal.pgen.1001393. [DOI] [PMC free article] [PubMed] [Google Scholar]
- 27.Juschke C, et al. Transcriptome and proteome quantification of a tumor model provides novel insights into post-transcriptional gene regulation. Genome biology. 2013;14:r133. doi: 10.1186/gb-2013-14-11-r133. [DOI] [PMC free article] [PubMed] [Google Scholar]
- 28.Battle A, et al. Genomic variation. Impact of regulatory variation from RNA to protein. Science. 2015;347:664–667. doi: 10.1126/science.1260793. [DOI] [PMC free article] [PubMed] [Google Scholar]
- 29.Wu L, et al. Variation and genetic control of protein abundance in humans. Nature. 2013;499:79–82. doi: 10.1038/nature12223. [DOI] [PMC free article] [PubMed] [Google Scholar]
- 30.Endres S, Ghorbani R, Lonnemann G, van der Meer JW, Dinarello CA. Measurement of immunoreactive interleukin-1 beta from human mononuclear cells: optimization of recovery, intrasubject consistency, and comparison with interleukin-1 alpha and tumor necrosis factor. Clinical immunology and immunopathology. 1988;49:424–438. doi: 10.1016/0090-1229(88)90130-4. [DOI] [PubMed] [Google Scholar]
- 31.Endres S, et al. In vitro production of IL 1 beta, IL 1 alpha, TNF and IL2 in healthy subjects: distribution, effect of cyclooxygenase inhibition and evidence of independent gene regulation. European journal of immunology. 1989;19:2327–2333. doi: 10.1002/eji.1830191222. [DOI] [PubMed] [Google Scholar]
- 32.Saeed S, et al. Epigenetic programming of monocyte-to-macrophage differentiation and trained innate immunity. Science. 2014;345:1251086. doi: 10.1126/science.1251086. [DOI] [PMC free article] [PubMed] [Google Scholar]
- 33.Cheng SC, et al. mTOR- and HIF-1alpha-mediated aerobic glycolysis as metabolic basis for trained immunity. Science. 2014;345:1250684. doi: 10.1126/science.1250684. [DOI] [PMC free article] [PubMed] [Google Scholar]
- 34.Kayama H, Nishimura J, Takeda K. Regulation of intestinal homeostasis by innate immune cells. Immune network. 2013;13:227–234. doi: 10.4110/in.2013.13.6.227. [DOI] [PMC free article] [PubMed] [Google Scholar]
- 35.van de Veerdonk FL, et al. STAT1 mutations in autosomal dominant chronic mucocutaneous candidiasis. The New England journal of medicine. 2011;365:54–61. doi: 10.1056/NEJMoa1100102. [DOI] [PubMed] [Google Scholar]
- 36.Liu L, et al. Gain-of-function human STAT1 mutations impair IL-17 immunity and underlie chronic mucocutaneous candidiasis. The Journal of experimental medicine. 2011;208:1635–1648. doi: 10.1084/jem.20110958. [DOI] [PMC free article] [PubMed] [Google Scholar]
- 37.Milner JD, et al. Impaired T(H)17 cell differentiation in subjects with autosomal dominant hyper-IgE syndrome. Nature. 2008;452:773–776. doi: 10.1038/nature06764. [DOI] [PMC free article] [PubMed] [Google Scholar]
- 38.Farh KK, et al. Genetic and epigenetic fine mapping of causal autoimmune disease variants. Nature. 2015;518:337–343. doi: 10.1038/nature13835. [DOI] [PMC free article] [PubMed] [Google Scholar]
- 39.Kladney RD, Cui X, Bulla GA, Brunt EM, Fimmel CJ. Expression of GP73, a resident Golgi membrane protein, in viral and nonviral liver disease. Hepatology. 2002;35:1431–1440. doi: 10.1053/jhep.2002.32525. [DOI] [PubMed] [Google Scholar]
- 40.Liu X, et al. Golgi protein 73(GP73), a useful serum marker in liver diseases. Clinical chemistry and laboratory medicine: CCLM/FESCC. 2011;49:1311–1316. doi: 10.1515/CCLM.2011.640. [DOI] [PubMed] [Google Scholar]
- 41.Liang H, et al. Interleukin-6 and oncostatin M are elevated in liver disease in conjunction with candidate hepatocellular carcinoma biomarker GP73. Cancer biomarkers: section A of Disease markers. 2012;11:161–171. doi: 10.3233/CBM-2012-00276. [DOI] [PMC free article] [PubMed] [Google Scholar]
- 42.Netea MG, et al. A semi-quantitative reverse transcriptase polymerase chain reaction method for measurement of MRNA for TNF-alpha and IL-1 beta in whole blood cultures: its application in typhoid fever and exentric exercise. Cytokine. 1996;8:739–744. doi: 10.1006/cyto.1996.0098. [DOI] [PubMed] [Google Scholar]
- 43.van Crevel R, et al. Disease-specific ex vivo stimulation of whole blood for cytokine production: applications in the study of tuberculosis. Journal of immunological methods. 1999;222:145–153. doi: 10.1016/s0022-1759(98)00192-6. [DOI] [PubMed] [Google Scholar]
- 44.Hirschfeld M, Ma Y, Weis JH, Vogel SN, Weis JJ. Cutting edge: repurification of lipopolysaccharide eliminates signaling through both human and murine toll-like receptor 2. J Immunol. 2000;165:618–622. doi: 10.4049/jimmunol.165.2.618. [DOI] [PubMed] [Google Scholar]
- 45.Sutmuller RP, et al. Toll-like receptor 2 controls expansion and function of regulatory T cells. The Journal of clinical investigation. 2006;116:485–494. doi: 10.1172/JCI25439. [DOI] [PMC free article] [PubMed] [Google Scholar]
- 46.Shah TS, et al. optiCall: a robust genotype-calling algorithm for rare, low-frequency and common variants. Bioinformatics. 2012;28:1598–1603. doi: 10.1093/bioinformatics/bts180. [DOI] [PMC free article] [PubMed] [Google Scholar]
- 47.Deelen P, et al. Genotype harmonizer: automatic strand alignment and format conversion for genotype data integration. BMC research notes. 2014;7:901. doi: 10.1186/1756-0500-7-901. [DOI] [PMC free article] [PubMed] [Google Scholar]
- 48.Delaneau O, Zagury JF, Marchini J. Improved whole-chromosome phasing for disease and population genetic studies. Nature methods. 2013;10:5–6. doi: 10.1038/nmeth.2307. [DOI] [PubMed] [Google Scholar]
- 49.Howie B, Marchini J, Stephens M. Genotype imputation with thousands of genomes. G3 (Bethesda) 2011;1:457–470. doi: 10.1534/g3.111.001198. [DOI] [PMC free article] [PubMed] [Google Scholar]
- 50.Deelen P, et al. Improved imputation quality of low-frequency and rare variants in European samples using the ‘Genome of The Netherlands’. European journal of human genetics: EJHG. 2014;22:1321–1326. doi: 10.1038/ejhg.2014.19. [DOI] [PMC free article] [PubMed] [Google Scholar]
- 51.Smeekens SP, et al. Functional genomics identifies type I interferon pathway as central for host defense against Candida albicans. Nature communications. 2013;4:1342. doi: 10.1038/ncomms2343. [DOI] [PMC free article] [PubMed] [Google Scholar]
- 52.Dobin A, et al. STAR: ultrafast universal RNA-seq aligner. Bioinformatics. 2013;29:15–21. doi: 10.1093/bioinformatics/bts635. [DOI] [PMC free article] [PubMed] [Google Scholar]
- 53.Love MI, Huber W, Anders S. Moderated estimation of fold change and dispersion for RNA-seq data with DESeq2. Genome biology. 2014;15:550. doi: 10.1186/s13059-014-0550-8. [DOI] [PMC free article] [PubMed] [Google Scholar]
- 54.Shabalin AA. Matrix eQTL: ultra fast eQTL analysis via large matrix operations. Bioinformatics. 2012;28:1353–1358. doi: 10.1093/bioinformatics/bts163. [DOI] [PMC free article] [PubMed] [Google Scholar]
Associated Data
This section collects any data citations, data availability statements, or supplementary materials included in this article.