

Abstract
Nucleic acid aptamers are promising alternatives to antibodies for analytics. They are generally obtained through an iterative SELEX protocol that enriches a population of synthetic oligonucleotides to a subset that can recognize the chosen target molecule specifically and avidly. A wide range of targets is recognized by aptamers. Once identified and optimized for performance, aptamers can be reproducibly synthesized and offer other key features, like small size, low cost, sensitivity, specificity, rapid response, stability, reusability. This makes them excellent options for sensory units on a variety of analytical platforms including those with electrochemical, optical, and mass sensitive transduction detection. Many novel sensing strategies have been developed by rational design to take advantage of the tendency of aptamers to undergo conformational changes upon target/analyte binding and employing the principles of base complementarity that can drive nucleic acid structure. Despite their many advantages over antibodies, surprisingly few aptamers have yet been integrated into commercially available analytical devices. In this review, we discuss how to select and engineer aptamers for their identified application(s), some of the challenges faced in developing aptamers for analytics and many examples of their reported successful performance as sensors in a variety of analytical platforms.
Graphical abstract

1. Introduction
The discovery of aptamers in the 1990's1-3 provided a new opportunity for sensor design to satisfy the continuing need for accurate and broadly applicable analytical tools. Aptamers are single stranded nucleic acid (NA, e.g. DNA or RNA) molecules selected in vitro from synthetic libraries of oligonucleotides (oligos) with randomly assigned sequences by a process called SELEX (Systematic Evolution of Ligands by EXponential enrichment), which involves multiple rounds of iterative selection. They have been isolated to recognize a wide range of molecular targets including proteins, small molecules, ions, toxic molecules and even whole cells.4-6 Aptamers provide an alternative to antibody-based detectors, which have for many years been the work-horses for detecting molecular markers in forensics applications and diagnosing diseases, food contaminations, and viral outbreaks. Although unlikely to fully supplant antibodies in these applications, aptamers bring new properties that can be used to great advantage in analytics.
A significant advantage over antibodies is the ability to tune the affinities and specificities of aptamers by the appropriate selection protocols and post-selection engineering. Aptamer affinities for their cognate analytes range from picomolar (pM) to micromolar (μM) dissociation constants (Kd), with the lower affinity range covering small molecules, consistent with the fewer possible contacts between analyte and aptamer as the chemical framework of the former decreases. Aptamer specificities can be exquisite such as to distinguish two molecules that vary structurally in a single position. Examples are the theophylline aptamer that does not bind caffeine and the arginine citrulline and arginine aptamers, each of which distinguished their cognate analyte by a structural variation in a single position on the chemical structures.7-9
Once selected and optimized, aptamer stocks are replenished by chemical synthesis, which brings their production costs well below those for antibodies. Aptamers are also amenable to chemical modifications that increase their chemical and biological stabilities and adapt them to function on a variety of sensing platforms. These characteristics, in addition to their reusability and stability to dehydration and heat, identify the advantages of aptamers over antibodies as sensors. Recognition of the value of aptamers for analytics has surely fueled the rapid increase in reports of new aptamer sensors that started in 2007 and by 2015 brought reports on new aptamer-based sensors (aptasensors) to ∼26% of all sensor reports listing aptamers or antibodies (Fig. 1). By contrast, new sensors that involve antibodies appear to have reached a steady state.
Figure 1.
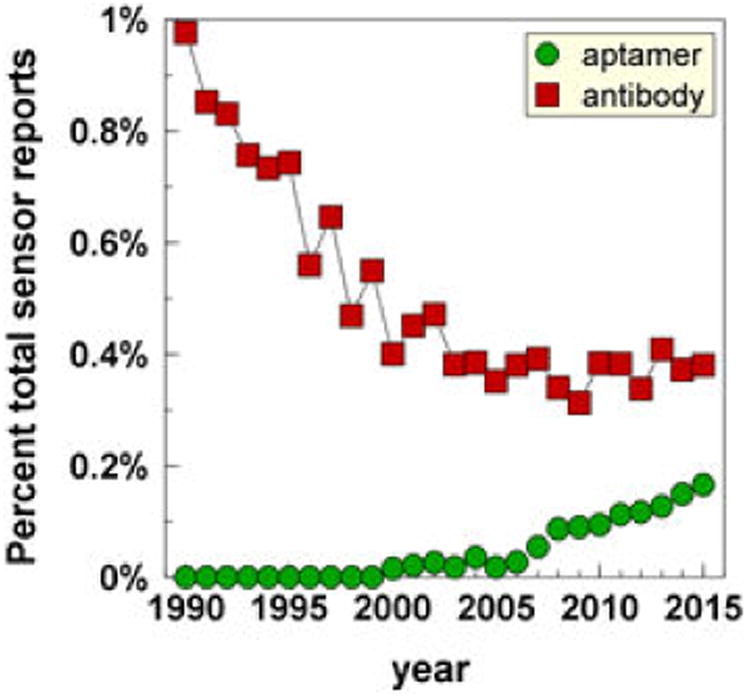
Increasing numbers of publications reporting aptamer applications in analytics. The reports listed in Pubmed that combined the terms antibody (antibody) or aptamer (aptamer) in the title and a SENSOR search text (sensor as a text word or analytical or quantitative in the title or abstract) are shown as percentages of all reports that used the SENSOR search text.
The allure of aptamers as sensors is their adaptability to different platforms and different signaling modalities. Aptamers can be integrated with other molecules or onto supporting surfaces. A variety of reporters can be attached to them for transducing the binding event to signal read-outs and multiplexing is possible for concurrent sensing of several analytes in small volumes over broad dynamic ranges.
After the initial requirement of obtaining and optimizing an aptamer for stability, specificity and selectivity is met, a major challenge for developing aptasensors is a consequence of the small sizes of aptamers. These short polymers form structures that are malleable and singularly responsive to environmental factors such as pH, salt concentrations and temperature. Consequently, each aptasensor must be individually optimized by methods that require understanding of 1) the molecular biology of NA aptamers and their molecular targets (e.g. analytes), 2) thermodynamics of their interactions with analyte vs. non-target molecules, 3) synthetic chemistry for possible aptamer modifications, and 4) physical chemistry and surface physics if the aptamer is to be integrated onto signaling surfaces. In addition, aptamer responses and sensitivities may differ when they are attached to a surface compared with in solution. If the delay in availability of commercial aptasensors is seen in this perspective, it can be understood why such promising elements of analytical devices as aptamers are relatively slow to become commonplace. However, it is also evident from the current experimental reports that the future of analytics includes the application of many aptasensors.
Here, we discuss the process of aptamer selection, development and engineering and the application of aptasensors for a variety of analytes in solution, on solid supports, for synthetic biology and other in vivo applications. Notably absent from this review is reference to aptamers for their potential in therapeutics. This topic has been dealt with by the majority of reviews written about aptamers over the past five years despite that the majority of research papers have dealt with the application of aptamers as sensors (Fig. 2). Reviews that have focused on aptamers as sensors have generally limited the discussion to a particular platform or signaling mode.10-16 We take a broader view of the field of aptasensors to highlight the many possibilities for applications of aptamers to analytics and to discuss the remaining hurdles for developing robust aptasensors.
Figure 2.
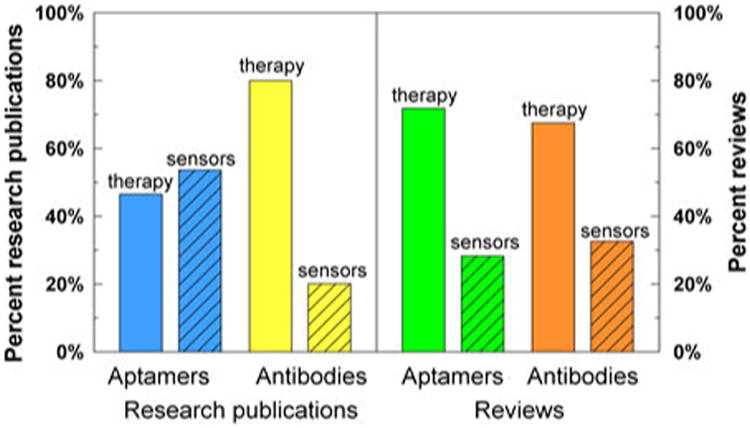
Predominance of research publications citing aptamers and antibodies for therapeutics and sensors. Whereas the reported applications of aptamers (blue bars) as sensors (hatched bars) outnumber reports of their use in therapeutics (open bars), the opposite is true for antibodies (yellow bars). Despite the bias against therapy applications of aptamers in the primary literature, most reviews that cite aptamers (green bars) cite therapeutics and many fewer cite sensors. This data was collected from Pubmed using the key words shown above and below the bars. The time period analyzed was 2010 to 2015, inclusive.
2. The SELEX Procedure
SELEX (Systematic Evolution of Ligands by EXponential enrichment) is the procedure by which aptamers are selected to bind a predefined target.1-3 The best binder (the “fittest”) is enriched through the selection process, by which the library complexity is decreased. Practically, the starting pool consists of around 1012 to 1016 oligos of random sequence, each of which can adopt a unique subset of 3-dimensional (3D) structures defined by the combination of base-pairing, stacking, sugar packing and non-canonical intramolecular interactions. This structural complexity establishes a high probability of selecting an aptamer that can interact strongly and specifically with the target of interest. The binding interaction between aptamer and target includes hydrogen bonds, salt bridges, van der Waals, hydrophobic and electrostatic interactions.
SELEX experiments involve an in vitro iterative selection procedure that includes binding, partitioning and amplification. Each experiment starts with a pool of single stranded DNA (ssDNA) oligos, each with an internal randomized sequence, usually 30-80 nt, and terminal sequences complementary to predefined primers for PCR and/or RT-PCR. Although this pool is ready for selection of ssDNA aptamers, it requires conversion to RNA by transcription before selection of RNA aptamers. Transcription is performed on a double-stranded DNA (dsDNA) pool, which is frequently produced by extension by the DNA polymerase Klenow fragment from a 5′ primer that contains the T7 RNA polymerase promoter sequence.
For selection, the RNA or DNA oligo pools are incubated with the desired target under defined conditions for a determined time period after which the bound and unbound oligos are separated. For successful selection, it is crucial to identify an effective method and conditions for partitioning the unbound and bound species. Many methods have been used for this purpose, including nitrocellulose filter binding, affinity chromatography, size fractionation on columns, flow cytometry,17 surface plasmon resonance (SPR),18, 19 electrophoresis on through polyacrylamide gels (PAGE), capillary electrophoresis (CE).20 and microfluidic separations.21 The application of these methods in SELEX has been reviewed in detail.22
Following partitioning, the selected oligos are converted to cDNA by PCR amplification of ssDNA or by reverse transcription followed by PCR amplification and transcription for RNA aptamer selection. The selected pools from subsequent rounds of SELEX should have lower complexity compared with the initial pool and be enriched in oligo species with high affinities for the target. With increasingly stringent conditions (shorter incubation times, higher temperatures, higher NA/target ratios) in subsequent rounds of SELEX, the high-affinity oligos are enriched. The inclusion of negative selection cycles (binding of pool to the matrix without target or with an undesired target) eliminates species that bind the matrix or other related compounds expected to be present in the samples for analysis. Although negative selections are frequently performed between each positive selection, mathematical modeling of SELEX predicts that the order of positive and negative selections does not affect selection, but that it is important to have more positive than negative selections for high specificity of the selected aptamers.23 Therefore, because the probability of losing an oligo species is higher in the earlier cycles of SELEX, when there are fewer copies of each species, negative selections are better performed in later cycles.
Typically, for selections that do not involve NA-binding proteins, 7 to 15 positive selection cycles have been used to obtain an enriched pool with high affinity binders.24 Historically, the outcomes of SELEX experiments have been evaluated by cloning and sequencing a subset of the final round of selected oligos to identify potential aptamer candidates, which appear as families of oligos with highly related sequences that have been enriched by SELEX. However, the recent application of next-generation sequencing combined with informatics analysis of the growing aptamer populations is a powerful improvement in the SELEX procedure.25 In addition to having large databases by which the growth (or disappearance) of sequence families can be followed, informatics can be applied to evaluate potential oligo structures, thereby allowing the incorporation of structure into the analysis to identify putative aptamers.26 Once identified, the putative aptamers can be synthesized to determine target affinity and specificity of binding over other possible targets.
One of the most important considerations for designing SELEX experiments relate to the conditions of selection pressure, such as buffer and other environmental components, and the conditions of negative selection, including the presence of non-target molecules. The latter can be selected against in separate cycles or included as competitors with the target molecule during a positive selection cycle.8, 27, 28 The ionic environment and pH of the buffer can significantly affect the structures and functionalities of NAs.29-32 These considerations are important for developing robust aptamers for specific analytical applications.
Aptamers have a significant advantage over antibodies as sensing units because they can be used repeatedly with little loss of activity, whereas antibodies can be used only once or a few times if attached to a stable platform before functionality is lost due to irreversible protein denaturation.33, 34 For repeated use, the chemical and biological stabilities of aptamers must be considered. For example, they are susceptible to nucleases that are present in many biological samples. This is particularly true for RNA, which is also more chemically labile to high pH and temperature compared with DNA due to the close proximity of the 2′OH group and electrophilic phosphorous. Many chemical modifications can stabilize nucleic acids to degradation.6 Post-selection modifications can be done but it carries a large risk of altering the aptamer structure and decreasing or eliminating its affinity for the target analyte. A less risky approach is to generate environmentally and biologically stable aptamers by using chemically-substituted nucleotide analogs for synthesizing the oligos during selection.35
SELEX protocols have been made more efficient by decreasing the time to completion from months to weeks with the inclusion of automation,36-38 delaying analyses (such as testing for binding and/or functionality) to later rounds of selection, limiting the number of selection rounds, and coupling selection with informatics to identify the aptamer families.26, 39, 40 Further efficiency comes with the inclusion of automation36-38 In photoSELEX, modified nucleotides are photocrosslinked to the target by absorption of light making the aptamer protein complexes very stable to washing.41 With these technical aspects have also come approaches to increasing the specificity of aptamer recognition of proteins by incorporating modified bases in the oligos that can be crosslinked to the target protein41 or that have added chemical groups with similarities to amino acid side chain.42 In addition to high affinity, specificity is the other requirement of a well-functioning aptamer. This problem seems best addressed by negative selections against the related molecules to which the aptamer should not bind. In this way, aptamers can be isolated that are specific for one of several members of the same protein family43, 44 or one of several related chemicals.7-9
Aptamers selected to bind small molecules usually have Kds in the mid nanomolar (nM) to low μM range. By comparison, the longer natural RNAs that can form more stable binding structures generally have higher affinities for the same ligand. For example, a number of aptamers selected to recognize guanine with Kds in the 1μM range45 are compared to the natural riboswitch with a Kd of 5 nM.46 Similarly, the neomycin-B aptamer, with a Kd of 100-200 nM,31, 47 binds neomycin-B with lower affinity than riboswitches selected in yeast with Kds around 10 nM.48
Changes in ionic strength, pH, and temperature can affect target binding.31, 32 Therefore, the buffers used during aptamer selection can drastically impact the affinities and future performances of aptamers when used as sensors. Another important consideration for selecting aptamers to be used in analytical tools is that the target molecules for aptamer selection be identical to the analyte. This requirement is frequently met with protein analytes that might only be modified with a short protein tag when used as a SELEX target. It is often more difficult to ensure identity with the analyte with membrane proteins and small molecule that are used as SELEX targets. If the SELEX target is a recombinant extracellular domain of a membrane protein, this target may lack the normal glycosylation pattern that could prevent aptamer access to the natural analyte and could also influence protein structure that could alter aptamer affinity. In addition, many membrane proteins are associated with other proteins, lipids or carbohydrates that influence their structures and the availability of surface docking sites for aptamers. To address some of these problems, new selection techniques like cell-SELEX49, 50 and tissue-SELEX51 have been developed.
For small molecule analytes, the target for aptamer selection is often a larger derivative of the small molecule, such as an immobilized analyte for separation of bound and unbound oligos. Thus, the chemistry is important that is used to attach the selection of ligand for aptamer capture. For example, if a short carbon chain separates the resin from the ligand, the aptamer is likely to recognize the analyte equally to the immobilized version, whereas additional chemical moieties close to the analyte framework might become included as part of the target to which the aptamer binds.
Because the fundamental feature of SELEX is the equilibrium between aptamer and target analyte, its optimization can be approached by computational and mathematics analyses.23, 24, 52, 53 In these studies, the stringency of the selection, necessity of negative selections, impact of pool and target concentrations in each SELEX round have been analyzed in detail and can be used as a basis of optimizing the SELEX process. In addition to experimental design, the success of SELEX depends on experimental aspects such as the chemical properties and purity of the target, use of proper enzyme combinations for amplification and pool productions as well as careful handling of the chemicals. Optimization of the procedure, by including considerations of the analytical platform and environmental/buffer conditions under which the anticipated aptamers will function, is critical to developing aptamers that function well as aptasensors.
3. Engineering aptamers for the task
Selecting a set of aptamer sequences that bind their cognate targets with high affinity and specificity is the initial step for obtaining functional aptamers. The next steps are structure and sequence-guided molecular engineering that include truncation and/or mutation of the sequence(s) to develop the shortest aptamer(s) with highest affinity and specificity. Practical knowledge has been gained from aptamer engineering strategies for designing, building, maintaining and improving aptamer-decorated sensory platforms and engineered aptamers have been successfully used for ultrasensitive biosensing. Overall, the results of many studies suggest that the optimal approach for efficient conversion of binding events into real-time detectable signals will vary and probably be specific to each aptamer. However, the process of selection and engineering requires attention to some important considerations that are defined by the anticipated samples for testing and the type of sensor being developed (Table 1).
Table 1. Considerations for aptamer development in selection and engineering.
| Important considerations | Implementation | |
|---|---|---|
| SELEX | Buffers to approximate anticipated application conditions | Salt concentrations pH, temperature |
| Selection conditions to promote high affinity | Choose stringency Incubation time | |
| Selection conditions to promote high selectivity | Negative selections against anticipated interfering molecules | |
|
| ||
| Engineering | Maximum affinity and selectivity | Screen aptamer candidates |
| Minimum size | Determine the 2D structure Identify contact sites on the aptamer Truncate to remove uninvolved NA | |
| Adaptation to sensing mode | Modify with elements such as linkers and fluorophores | |
| Optimum affinity, high selectivity and structural stability | Evaluate effect of strategic changes in sequence of truncated aptamers Chemically modify | |
3.1. Structural analysis
Structural characterization is important for optimizing aptamer performance after their selection from the pool. Optimization is often preceded by predicting secondary structures (mainly for identifying correct base pairing) and then tertiary structures (for approximate atomic distributions in space). For secondary structure predictions, the thermodynamics-based software, MFold, that predicts secondary structure, was for many years the most widely used program. Current folding algorithms can often predict tertiary NA structures with high accuracy.54, 55
High throughput sequencing creates datasets that benefit from computational analysis of primary and secondary structures to identify oligos with the highest likelihood of having good aptamer qualities. The combination of experimental evolution of aptamers by SELEX with computational analysis of evolving populations based on structural motifs promises to shift the process of aptamer selection from a pure “fishing expedition” to a “guided search.” Analysis of evolving aptamer populations during SELEX, from which up to 20 sequence families can be obtained, has been approached with algorithms to search for structural motifs that might be critical for aptamer-ligand interaction.26, 40, 56-59 Computational analysis has the potential to identify candidate aptamers of high affinity and high specificity by tracking sequence motifs that increase or decrease with selection protocols such as negative selection against analyte-related compounds. Future advances in aptamer selection are likely to involve more sophisticated directed evolution aided by computational identification of aptamer families with the affinities and specificities required for their applications as sensors.
Whereas computational analysis can predict the nucleotide bases important for ligand binding, biophysical analysis by nuclear magnetic resonance NMR or X-ray crystallography identifies the molecular details of the aptamer-ligand interaction. These biophysical analyses are viewed as the most definitive for resolving NA tertiary structures, but they are limited to buffer conditions compatible with data collection. The structures of NAs can be very sensitive to environmental conditions, such as salt types and concentrations, pH and temperature. Thus, it is important to evaluate aptamer structure under the conditions of their applications.
Aptamer-ligand interaction sites can be established by biochemical assays for structure such as nuclease protection, SHAPE,60 and UV-cross-linking performed in the presence and absence of ligand.61 Knowledge of the binding pocket and the bases critical for its formation and for ligand contacts is essential for aptamer optimization. It provides a map that guides modifications to retain or increase binding affinity while altering aptamer properties such as size or structural stability.
3.2. Engineering aptamers as sensors
The ability of short NAs to readily transition between alternate structures opens many options for their molecular engineering as sensors for which analyte binding results in a structural shift in the aptamer that can be measured by a range of outputs, including radiative energy, electrical, or mechanical. For example, there are now more than 100 different aptamer-based detection assays for thrombin using the 15 nt G-rich DNA thrombin aptamer,39 which is one of the earliest identified aptamers59 for which the unimolecular G-quadruplex structure of the aptamer-ligand complex was solved by 2-dimensional 1H NMR.62
A challenge in optimizing an aptamer sensor is to maximize structural contacts in the oligo to encourage a dominant apo-aptamer (not bound to ligand) structure. Short oligos tend to be highly flexible and not to adopt single structures, whereas the ligand bound aptamer is believed to generally adopt a single more stable structure. Although a signal can be obtained from the transition from an apo-aptamer that adopts a variety of structures to a single stable aptamer-ligand complex, this signal is unlikely to be as strong or consistent as could be obtained from the transition between two predominant structures. A robust structural response to ligand binding is usually achieved by engineering the aptamer post-SELEX based on structural analysis. Some SELEX protocols have also been developed that include selection for aptamers that respond with a structural change upon ligand binding.63, 64
Although most current engineering of aptamers is based on experimental probing in combination with computational structural predictions, the future lies in more extensive use of molecular modeling tools with which the impact of ionic surrounding can be assessed and bases identified with potential to be labeled in order to detect molecular motion. To accurately predict molecular motion, such as with the Molecular Dynamics software, requires a starting structure with molecular resolution. Three-dimensional structures are not available for most aptamers. Thus, the lack of ability to accurately predict three-dimensional structures of oligos still limits access to more sophisticated molecular modeling tools for most aptamer engineering.
4. Analytical applications of aptamers
The adaptability of aptamers to analytics, has resulted in a large variety of aptasensor technologies that have been developed for both identifying and determining the concentrations of proteins, small molecules, metabolites and ions. Clinical targets, including small metabolites and protein biomarkers of diseases, have been an important focus of sensor development using aptamers. For many sensor platforms aptamers must be immobilized for signal production. Conformational rearrangements occurring in aptamer structures as a result of analyte binding7, 65 create the signals produced in homogeneous assays and are transduced by most sensory platforms (Fig. 4). This section discussing analytical applications of aptamers is divided into two main categories: 1) aptamers used in homogenous assays and 2) aptamers integrated onto solid supports for signal production.
Figure 4.
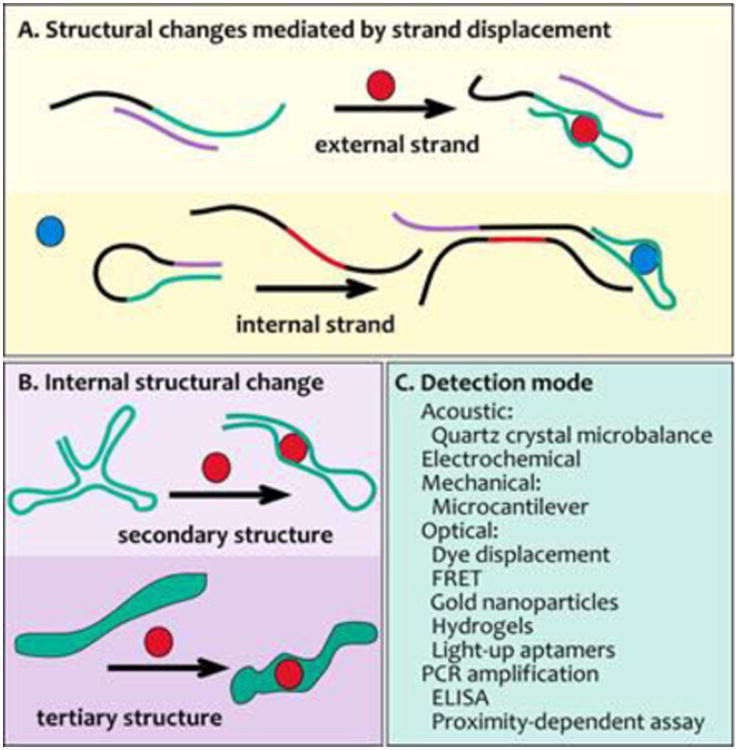
Types of structural changes in aptamers that are used to signal the presence of analyte.Aptamers (green) can be engineered with A) complementary attenuating strands that are displaced by competition with analyte (mauve), or B) to enhance internal structural changes. These structural changes can be integrated into a variety of sensing platforms with a range of detection modes (C). Red elements, analytes; circles, aptamer ligands.
4.1. Assays developed with aptamers for homogeneous solution detection
Homogeneous assays with aptamers are simple and quick to perform. They involve either 1) fluorescent molecules or chromophores that nonspecifically interact with aptamers and are used as indicators of aptamer structural changes on ligand binding, 2) aptamers modified by fluorescent moieties for signal production, or 3) aptamers conjugated with DNAzymes, antibodies, quantum dots (QDs) or nanoparticles (NPs). Aptamer-analyte interactions in homogenous solution are mainly based on measurements of color, fluorescence or chemiluminescence.66
Analyte-binding pockets in aptamers frequently contain stacked bases between which a flat molecule can insert. For small molecules with conjugated bonds, insertion into the pocket can stabilize their flattened form and thereby increase their color or fluorescence intensity. Although, in some instances the analyte itself is a conjugated molecule, frequently conjugated molecules with much lower affinities for the aptamer than the analyte are used to monitor analyte binding by aptamers. The analyte is detected by its ability to successfully compete for its position in the binding pocket, with concomitant loss of signal due to release of the conjugated molecule. These dye-displacement methods require little structural characterization of the aptamer.For example, [Ru(phen)2(dppz)]+2 has no luminescence without oligo but luminesces upon intercalation. This feature was used to create homogeneous assays for IgE, platelet-derived growth factor (PDGF-BB) and α-thrombin with detection limits determined as 100 pM, 1.0 nM and 10 pM, respectively.67 Similarly, the intercalator TOTO (1-1′-(4,4,8,8-tetramethyl-4,8-diazaundecamethylene)-bis-4-(3-methyl-2,3-dihydro(benzo-1,3-thiazole)-2-methylidene) quinolinium tetraiodide) was used to monitor interaction of the PDGF aptamer and PDGF-BB with a detection limit of 0.1 nM.68 The cocaine aptamer was screened for its binding to 35 different dyes in the presence or absence of cocaine to develop a cocaine-specific colorimetric sensor.69 Displacement of the dye, diethylthiotricarbocyanine iodide, by cocaine resulted in 40-50% attenuation of absorbance at 760 nm for cocaine concentrations from 100 to 600 μM. The response was specific for cocaine and not observed with the addition of a cocaine metabolite, benzoyl ecgonine.In this case the dye was insoluble in aqueous buffer, but was maintained in solution as a complex with the aptamer. When competed out of the aptamer binding pocket by cocaine, the dye precipitated from solution, resulting in a visible change in color intensity.
A different twist in engineering a dye displacement assay takes advantage of the simple rules of complementarity that apply to all NAs. In one example, hybridization of the 15-nt thrombin aptamer with a complementary oligo created intercalation sites for ethidium bromide (EB) in the double-stranded complex. The addition of thrombin released both the EB and the complementary oligo, which resulted in decreased EB fluorescence.70 The system was reported to have a 2.8 nM limit of detection (LOD) and a linear response range up to 23 nM. This design has the potential of a lower background because the oligos separate when the aptamer binds thrombin, which removes all intercalating sites that were present in the hybrid. However, the mechanism of sensing involves competition between analyte and complementary oligo for the aptamer and these affinities need to be balanced. Compared with the very low affinities of the intercalated dyes that directly compete for binding to the aptamer-analyte binding pocket, the affinity of a 15-mer complementary oligo for the aptamer is much higher. Calculations for the current case show that the affinity of the aptamer for its complement is higher than for the aptamer and thrombin. This unfavorable affinity balance probably explains why the maximum decrease in fluorescence due to thrombin was only 8% of the starting value. A similar strategy was used to develop an adenosine deaminase (ADA) sensor with the ATP aptamer and picagreen dye.71 Adenosine deaminase (ADA) converts adenosine into inosine. Release of aptamer-bound inosine enabled a complementary 19nt DNA strand to hybridize with the 31nt ATP aptamer. The resulting dsDNA provided intercalation sites for picagreen which then fluorescenced (λex = 490 nm, λem = 525nm). This sensor had a detection limit of 2 U/L, which is lower than the clinical requirement. ADA activity was detected with similar results in 10% serum and phosphate buffer, pH 7.5.
Another means of engineering gain of function is to create aptamer molecules for which analyte binding switches the oligo to a structure that binds an additional molecule from which increased color or fluorescence is derived. For example, G-quadruplexes bind hemin72 and this binding results in peroxidase activity.73 Thus, the conformational switch from a random coil to a G-quadruplex that occurs in the 8-OHdG aptamer when it binds the DNA adduct, 8-hydroxy-2′-deoxyguanosine (8-OHdG), was used to create a gain of function peroxidase-like DNAzyme with a color change maximum at 416 nm.74 The detection limit of this chimeric aptamer for 8-OHdG, a cancer marker found in human urine, was reported as 141 pM with a linear response range of 0.466 to 247 nM 8-OHdG.
Although dye-displacement assays are simpler than antibody methods, which require electrophoretic separation, substrate capture or immobilization, multiple washing and blocking, the signal intensities for most homogeneous aptamer competition assays decrease as a function of analyte concentration. Thus the assay resolution is limited for analyte concentrations close to or above the Kd of the aptamer, below which the readout approaches background values. Obtaining an increase in signal with analyte binding, requires a conformational switch of the aptamer that results in a gain of function. This condition occurs if the analyte is also a conjugated molecule that increases in fluorescence or color on interaction with aptamer. The malachite green aptamer (MGA) and spinach aptamers (SPNA) are examples for which the analyte fluorescence increases 2400-fold and 2000-fold, respectively, upon binding the aptamer.75, 76 Although there is little practical need to measure these analytes, the “switch-on” characteristic of these interactions can be used in chimeric formats for signal production. For example, the MGA was fused to adenosine triphosphate (ATP), flavin monophosphate, and theophylline aptamers and the SPNA was fused with aptamers that bind adenosine, ADP, S-adenosylmethionine, guanine, or guanosine 5′-triphosphate (GTP). These chimeric aptamers were engineered such that analyte binding stabilized the structures of the MGA or SPNA, which promoted binding of malachite green (MG) or 3,5-difluoro-4-hydroxybenzylidene imidazolinone (DFHBI),respectively.77, 78 In a related strand-displacement design, the adenosine aptamer was fused to the MGA and hybridized with a complementary oligo that overlapped the two aptamers.79 Adenosine binding released the 6-base portion of the regulatory strand hybridized with the adenosine aptamer, leaving a less stable 9-base hybrid that could be displaced by MG, resulting in enhanced fluorescence signal from the MG-MGA complex. Thus, if the binding conditions (salts, pH etc.) and dissociation constants of two aptamers are compatible, chimeric aptamers are an excellent means of creating a homogeneous assay in which an increase in signal results from analyte binding.
An interesting approach that detects large aptamer structural changes is to use a water-soluble cationic poly-3-alkoxy-4-methylthiophene derivative, a cationic polymer, which interacts with the negative backbone of DNA. Poly-3-alkoxy-4-methylthiophenes have flexible conjugated backbones and can display different chromic properties depending on the orientation of conjugated bonds through the polymer. The thrombin aptamer shifts from little secondary structure in the absence of ligand to a quadruplex of two G quartets when it binds thrombin or K+. Interaction of this polymer with the DNA in these two configurations differently orients the conjugated bonds and to create different colors. The color shift due to the presence of thrombin gave a detection limit of 100 pM.80
Fluorescence-signaling aptamers include fluorophores attached to the aptamer. If close enough to each other, the fluorophores interact in fluorescence resonance energy transfer (FRET), which can result in an increase or a decrease in fluorescence, depending on if the transferred energy is released by the acceptor as light or heat, with the latter effect generally referred to as quenching. The occurrence of FRET requires the appropriate dyes with overlapping excitation and emission spectra for quenching or sensitized emission and the appropriate distance (10-100 Å) between the dyes. In the most common sensor designs based on FRET, the aptamer is labeled at opposite ends with a fluorophore and a quencher. Aptamers are usually structurally more stable when in complex with analyte. The switch with analyte binding to the more structurally stable aptamer-analyte complex changes the average distance between the opposite ends of the oligos, which in turn changes the fluorescence intensity.64 For example, the thrombin and cocaine aptamers, each labeled at opposite ends with fluorophore, 6-FAM (6-carboxyfluorescein), and quencher, DABCYL (4-(4-dimethylaminophenylazo) benzoic acid), demonstrated decreased fluorescence with binding of their ligand as analyte.81, 82
For an increasing signal as a function of analyte binding, the angiogenin aptasensor was labeled with 5′ 6-FAM and 3′ 6-carboxy-tetramethylrhodamine (TAMRA) as sensitized FRET donor and acceptor respectively.83 The quantitative detection limit was 200 pM and the linear range was between 500 pM to 40 nM angiogenin. An aptamer design that provides an increase in fluorescence (due to the release of quenching) is the “molecular aptamer beacon” (MAB). The MAB is related to molecular beacons, for which a structural change to separate the 3′ and 5′ ends of a stem-loop structure is accomplished by hybridization of the centrally-located loop with a complementary NA strand.84-87 Replacement of this central loop with a thrombin aptamer allowed thrombin binding to cause rearrangements in the aptamer that separated the fluorophore from quencher, thereby increasing the fluorescence output due to complex formation.88
Aptasensors can provide an increase in fluorescence upon analyte binding in the “structure-switching” or “aptamer switch” designs that can include one or two additional complementary oligos.89 In these systems, either the aptamer and complementary oligo or the two complementary oligos are labeled with a fluorophore or quenching dye that are closely apposed in the assembled molecule. Analyte binding results in dissociation of the complex and an increase in fluorescence intensity. This design has been demonstrated for the ATP and thrombin aptamers with a positive (sensitized emission) or negative (quenched) FRET signal.64, 90, 91 However, because the analyte must compete with a complementary oligo for aptamer binding, the position and length of the complementary DNA must be carefully adjusted for optimal response. Also, the apparent Kd and thus the sensitivity of the assay are lower than for the isolated aptamer. An improvement on this design is to connect the aptamer and complementary oligo with a polyethylene glycol linker.92 Colocalization of the two oligos in space ensures a rapid response and allows the use of shorter complementary oligos. The complementary oligo can also be an extension of the aptamer sensor, which similarly ensures a rapid and reversible response.93, 94 Regulation by a linked short complementary sequence results in a more sensitive assay because the apparent Kd of the aptamer is less impacted than with longer complementary oligos.
Increased fluorescent intensity with analyte binding can also be achieve with a fluorescence protection assay in which an antibody, specific for the fluorophore by which the aptamer is labeled, is incubated with the aptamer in the presence of samples with unknown analyte concentrations or a series of known standard concentrations. An aptamer probe with this design displayed a dynamic range from 0.1 to 50 nM with an LOD of 0.1 nM IgE.95
Engineering aptamers as sensors is greatly aided by available structural information. In one case, an identified conformational change induced by analyte binding informed the design of two alternative anti-adenosine aptamers with either a fluorophore insertion or a modified uridyl base63; one with acridine in position 13 and the other with a fluorescein inserted between residues 7 and 8. Both sensors exhibited increased fluorescence intensity in the presence of 1 mM ATP than GTP, CTP or UTP. Also, the DNA ATP aptamer, with a pyrene excimer (excited dimer) incorporated into the phosphodiester backbone near the binding pocket, increased in fluorescence in the presence of ATP.96 Alternative to nucleobase or backbone modifications, a prenylmethyl fluorophore attached to the 2′ position of deoxyribose was used to detect ATP binding by the DNA aptamer.97
Background noise can limit the usefulness of FRET sensors, particularly when the mechanism involves quenching. Using pyrene as the source of fluorescence is the basis of an aptasensor design in which the wavelength shifts, rather than changing in intensity, with analyte binding. The wavelength shift occurs when pyrene transitions from a monomer to an excimer as demonstrated with the PDGF-BB and thrombin aptamers labeled with pyrene at both ends.98, 99 For both aptamers, a shift from a peak reading of 400 nm to 485 nm due to stabilization of the aptamer stems was proportional to the analyte concentration. For PDGF-BB, the LOD was in the nM range with a linear response up to 40 nM and for the thrombin aptamer, the dynamic range of response to K+ ions was 600 μM to 20 mM. Time-resolved measurements of the excimer, which has a much longer lifetime than most biological species (40 ns vs. 5 ns),can eliminate most background noise. This enables a homogeneous assay in complex mixtures such as those containing biological materials with significant endogenous fluorescence.
When the analyte is a large molecule or molecular complex, the apparent size of the aptamer increases substantially upon complex formation and decreases in rotational motion, which can be detected by a change in fluorescence anisotropy of a fluorophore-labeled aptamer. By this means, PDGF was detected by its interaction with a fluorescein-labeled 35-mer aptamer with an LOD of 220 pM.100
Split aptamers can also be applied as sensors for proteins as demonstrated for the RNA aptamer specific for the trans-activating of transcription (Tat) factor of HIV-1, which binds the protein by a stem region containing a bulge in a stem-loop structure. The aptamer was split in the intervening loop to form two fragments, one of which forms a hairpin structure. The hairpin-forming fragment was labeled with fluorophore (fluorescein) and quencher (DABCYL) at the 5′ and 3′-ends, respectively.101 Signal from this aptamer fragment is suppressed until the analyte, Tat, promotes the assembly of the two aptamer halves in a ternary complex in which the 3′ and 5′ ends of the hairpin-forming fragment are separated. Being a trimolecular reaction, this design has the disadvantage of being sensitive to the concentration of each of the three components of the ternary complex and to their relative concentrations. Also, some sensitivity is lost due to the inevitable decrease in aptamer affinity for the analyte. In another example of a split aptamer assay, two fragments of the cocaine aptamer were separately modified with azide and cyclooctyne functional groups that reacted to ligate the fragments upon assembly of the complex with cocaine, thereby regaining structural stability of the intact aptamer. One fragment was also covalently linked to a surface to trap the complex on the surface. The second fragment was labeled with biotin that was used to capture streptavidin-horse radish peroxidase, which enabled amplification of the signal as is achieved in ELISA assays.102
Amplification by enzymes in an ELISA format was used for the cholic acid detection in which the DNA aptamer was linked to alkaline phosphatase through an avidin-biotin interaction and present in complex with agarose-linked cholic acid.103 The amount of aptamer displaced from the agarose by analyte was detected with a fluorogenic substrate for the enzyme. Signal amplification gave a linear response with 0.1 to 5 mM and an LOD of 10 μM cholic acid. However, unlike the other sensors discussed in this section, the ELISA protocol is not a homogeneous assay format and involves several washes to complete the assay.
In the special cases of protein analytes that are dimers or for which there are two aptamers targeted to different regions of the same protein, homogeneous assays can be developed based on the proximity of the aptamers on the protein or protein complex. Originally demonstrated for the homodimer, PDGF-BB, the assay was developed as a proximity-dependent DNA ligation assay, which required PCR for quantification.104 A homogenous assay was then developed with aptamer proximity signaled by the formation of G-quadruplexes by the adjacent aptamer extensions. The presence of the adjacent aptamers is signaled by the increased fluorescence yield of the dye, N-methylmesoporphyrin IX, which binds the G-quadruplexes.105
Quantum dots offer several advantages over fluorescent dyes to enhance the detection of biological samples in real time. These include longer fluorescent lifetime, better photostability, sharper emission bands and larger effective Stokes shifts. Streptavidin-coated QD conjugated with 5′ biotinylated thrombin aptamers hybridized to complementary oligos labeled at the 3′ end with a quencher were used to detect thrombin binding, which was associated with release of the complimentary oligos and increased the fluorescent signal from the QDs.106 QD-aptamer conjugates have also been used to detect spores from Bacillus thuringiensis,107 and cancer cells that overexpress PSMA.108
Gold nanoparticles (GNPs), provide an alternative to QDs that are less toxic, more biocompatible and easier to conjugate with aptamers. Their aggregation and disaggregation result in color changes from red (λmax = 650 nm)to purple (λmax = 520 nm). Aggregation of GNPs can be promoted by crosslinking the beads or by increasing the salt concentration. PDGF-BB, a homodimer, which binds two aptamers, caused aptamer-conjugated GNPs to aggregate, resulting in a color-change from purple to red.109 The detection limit was 3.2 nM PDGF and, when adapted to a competitive binding assay, the method also allowed detection of 200 nM PDGF receptors. For proteins like PDGF-BB and thrombin that are either homodimers or for which there are two aptamers, a sandwich assay can be developed using aptamer-conjugated nanoparticles. The linked nanoparticles can also be enlarged by gold or silver deposition so as to increase the sensitivity of the assay.110, 111
The effect of salt concentration on GNP aggregation was the basis of an assay for adenosine in which adenosine aptamers were hybridized with short complementary inhibitory oligos attached to GNPs.112 At the appropriate salt concentration (300 mM NaCl and 30 mM MgCl2) the aptamer-hybridized GNPs do not aggregate. The addition of adenosine causes aptamer dissociation and GNP aggregation. This format is generic and has been adapted to quantify several analytes.113-115
4.2. Aptamers integrated onto solid supports
Integration of aptamers into a sensory platform provides an opportunity for real-time detection of analytes. These types of aptasensors are developed based on one of several physicochemical properties like electrochemical, mechanical, acoustic and optical.
4.2.1. Electrochemical aptasensors
Electrochemical sensing involves a redox-tagged aptamer bound to an electrode. Structural changes in the aptamer due to analyte binding increase the probability for the aptamer-linked redox tag to strike the electrode, thereby increasing conductivity. Voltametric (amperometric), potentiometric, conductometric or impedimetric electrochemical aptamer (E-AB) sensors have been developed based on this design for which signal changes are generally reported as percent difference in signal strength from the unbound aptamer.116 E-AB sensors have been reported for proteins, including PDGF,117 thrombin,118-131 and immunoglobulin E (IgE),119, 121 small molecules including cocaine,132 theophylline133, 134 adenosine,135, 136 aminoglycosides,137, 138 and adenosine triphosphate (ATP) in both living cells139 and in solution,121, 140 and inorganic ions such as potassium (K+).141 The leadzyme, one of a small group of aptazymes (aptamers that perform a catalytic event on binding the analyte), has also been integrated into a methylene-blued E-AB sensor to achieve parts-per-billion (nM) sensitivity and high selectivity for Pb2+ ions.142
Compared to antibodies, aptamers can be adapted to a larger variety of detection formats when linked to a solid support. The thrombin aptamer provides a good example of this adaptability. Femtomolar (fM) LODs were reported for thrombin detection using strand-displacement coupled with enhanced electrochemical impedance signal detection,119 electrogenerated chemiluminescence,120 a potentiometric sandwich assay based on aptamers labeled with CdS QDs,122 and a bifunctional aptamer with CdSe QDs lowered the LOD to attomolar detecting changes in impedance signal.143 Similarly, an LOD of 1 pM was achieved with the ATP aptamer incorporated into a programmable capillary-based aptasensor using metal sulfide-functionalized DNA concatamer for signal amplification144. A rapidly developing area of medical analysis, to detect circulating cancer cells, has been addressed by many groups with E-AB aptasensors.145-152 For example, lung cancer cells were detected by voltammetry with the bioelectrodes functionalized with lung cell-specific aptamers attached to indium-tin-oxide coated glass.153 The sensor displayed a linear concentration range of 103 to 107 cells/ml with a detection limit of 103 cells/ml and a response time of 60 sec.
In the absence of extensive structural knowledge, buffer conditions can often be found in which the apo-aptamer is less stable than the aptamer-analyte complex, such as for the thrombin aptamer for which structural stability of the apo-aptamer decreases with ionic strength. The enhanced analyte-induced folding at low ionic strength doubled the signal from thrombin binding (60% change) compared with that in higher ionic strength buffer when tested with a methylene blue E-AB.154 Another means of destabilizing the unbound aptamer to increase the change in signal upon analyte binding is to increase the temperature and engineer the NA sequence, such as to shorten a stem. An example is the ATP aptamer that, modified with methylene blue and attached to a gold electrode, produced a maximum signal gain (relative change in signal upon target binding) of 130 % with a dynamic range of 0.1 to 3 mM.155 Removal of two bases from each end of the aptamer resulted in a destabilized variant that produced up to 190 % signal gain. Similar modifications resulted in signal gains increasing to 150 % and 30 % from the thrombin and IgE aptamers, respectively.121
4.2.2. Microcantilever aptasensors
Aptamers have been incorporated into microcantilever technology, which offers the possibility of label-free target detection, low noise, high scalability, and small testing volumes. Detection of proteins and small molecule analytes, based on the deflection of an aptamer-decorated cantilever as a result of target binding, can be achieved with many sensing units including interferometry,34, 156, 157 and piezoresistivity158 In an early example, gold-coated sensor cantilevers were functionalized with a thiolated DNA aptamer recognizing DNA polymerase from Thermus aquaticus.159 The difference in bending between the reference and the sensing cantilever was measured using interferometry. An affinity of 15 pM (Kd) was calculated in this system. Specificity was tested with the unrelated protein, thrombin, for which 75 nM gave no significant cantilever bending. Successful detection was also achieved with the analyte in a bacterial lysate. Similarly, an RNA aptamer against hepatitis C virus helicase was integrated in nanomechanical microcantilevers operating in vibration modes (oscillation) for successful label-free selective detection of the helicase with a detection limit of 100 pg/ml.160
Unlike for solution assays, the arrangement of the sensor on a surface, such as with microcantilevers and electrochemical detectors, creates a highly concentrated sensor population. This arrangement can have the advantage of effectively creating a multivalent sensor, which can increase the apparent affinity for an analyte by decreasing the effective off-rate.161-163 Alignment of aptamers in a small space is also a means of molecular crowding, which increases the folding efficiencies of single-stranded NAs.164, 165 Molecular crowding may also result in higher apparent affinity for the analyte. Consistent with these observations, we have found that the apparent affinities of two aptamers for their respective analytes (lipocalin-2 and cocaine) are about 10-fold higher for the microcantilever-associated aptamer compared with the aptamer in solution.34, 156
4.2.3. Acoustic aptasensors
Acoustic aptasensors for which aptamers are linked to gold-coated quartz crystals depend on the frequency or phase shift between the input and output light. The IgE aptamer was the first DNA aptamer to be used in a quartz crystal microbalance (QCM) format and provided a detection limit of 3.3 ng/cm2 of IgE.33 Other QCM sensors were also characterized with low detection limits such as the 1 nM limit for thrombin166 and 0.25 ppm of Tat in 100 μl.167 A surface acoustic wave (SAW) biosensor was configured with an array of five sensor elements to measure human α-thrombin DNA aptamer or HIV-1 Rev RNA aptamer.168 These low-wave acoustic sensors measured the propagation of acoustic waves and allowed label-free, real-time, and quantification of protein and NA binding events with a detection limit of 75 pg/cm2 for both α-thrombin and HIV-1 Rev peptide as analytes. When compared in the QCM format with antibodies specific to IgE, the aptamers demonstrated a better linear response, stability and reusability.33 In a similar comparison between aptamers and antibodies that recognized the HIV-1 Tat protein attached to a piezoelectric (electricity resulting from the pressure) aptasensor the aptamers were again found to be more specific, reproducible, and reusable than antibodies.167
Using a DNA aptamer that binds to exosite II on thrombin, which is sufficiently distant from exosite I so as not to interfere with binding of the anticoagulant, anti-thrombin III (AT), a QCM Love-wave biosensor array of aptamers was successfully applied to identify protein binding partners.169 The proteins were readily removed and the aptasensor regenerated by exposure to 0.1 N NaOH then reused several times with comparable results. The first example of QCM-based piezoelectric detection of small molecules used the cocaine aptamer immobilized on an organic adlayer of S-(11-tri-chlorosilyl-undecanyl)-benzenethiosulfonate on a quartz surface.170 Cocaine binding to the aptamer was measured with an electromagnetic piezoelectric acoustic sensor, which detected changes in aptamer tertiary structure and mass loading. The system had a detection limit of 0.9 μM cocaine and the aptamer displayed an apparent Kd of 45 ± 12 μM in PBS, which is typical for this aptamer.34, 171 The platform could be reused at least three times after the previously bound cocaine was removed with 7M urea.
Analogous to QCM and SAW aptasensors, surface plasmon resonance (SPR) sensors, which rely on a change in refractive index due to target binding, have been engineered to include aptamer sensors. QCM and SPR aptasensors for HIV-1 Tat protein were found to have similar high specificities with the SPR sensor having a wider linear range.172 The SPR aptasensor for retinol binding protein-4 was more sensitive than an ELISA.173
Antibody sandwiches have been used to increase the sensitivity of SPR sensors. For example, the localized SPR signal for thrombin detection by its aptamer was enhanced by 150% by including anti-thrombin aptamers, which resulted in an order of magnitude increase in sensitivity.174 Another approach to increasing sensor sensitivity is to amplify using a linked enzyme. For example, horseradish peroxidase (HRP) was conjugated with antibodies to vascular endothelial growth factor and thrombin to increase the sensitivity of these aptasensors to 500 fM and 1 pM, respectively.175 The insoluble reaction product produced from tetramethylbenzidine by HRP amplified the SPR signal. Ribozymes, the catalytic NAs, have also been linked with aptamers to create sensors. However, unlike protein enzymes, many ribozymes undergo single-turnover kinetics, such as self-cleavage or self-ligation, and thus do not provide an opportunity for amplification. However, the integration of ribozyme with aptamer can be achieved such that binding analyte results in either aptamer release or attachment to a sensor, depending on the ribozyme.176
Important current developments for aptasensors include miniaturization and the ability to simultaneously measure multiple aptamer signals. For multiplexing, aptamer arrays can be analyzed with SPR imaging,177 which can be improved by the use of polydimethylsiloxane microchips for displaying the aptamers.178 Localized SPR which measures a red-shift of the extinction and scattering spectrum due to an increase in the local refractive index of plasmonic nanoparticles upon analyte binding, can also be applied to multiplexed detection, miniaturized devices and to include aptamers sensors.179
4.2.4. Optical aptasensors
Most aptasensors developed for homogenous detection have been based on optical sensing with fluorescence changes being the most common signal measured upon ligand binding.In the first example of an optical aptasensor, thrombin binding by a fluorophore-labeled thrombin aptamer immobilized on a glass surface, was detected by evanescent wave-induced fluorescence anisotropy.180 Because evanescent waves decay exponentially with distance from the interface of refractive index, the induced fluorescence is sensitive to macromolecular conformational changes with the appropriate placement of fluorophore.181 The LOD was 5nM thrombin with a dynamic range up to 200 nm and less than 4% error. Nanoparticles can also be used to enhance the optical signal by concentrating the aptamers and increasing their apparent affinities. This was demonstrated in a study of anti-cancer-cell aptamers for which 80 fluorophore-labeled aptamers per nanorod demonstrated a 26-fold increase in affinity with 300-fold enhanced fluorescence,182
The aptamer-analyte interaction was used to control the sol to gel transitions of a hydrogel by using a strand displacement mechanism to destroy the DNA-based crosslinking of the gel and release trapped gold nanoparticles for a colorimetric output.183 In another example CdS-functionalized DNA is released upon analyte binding that is detected by voltammetrics.144 As a surface to hold aptamers, hydrogels provide the added advantage of protection against enzymatic degradation.184 Aptamer-derivatized hydrogels have also been used as an attachment surface in coordination with a quartz crystal microbalance to construct an aptasensor for avian influenza virus.185
Graphene oxides (GO) assemblies are single-atom-thick two-dimensional layered carbon nanomaterial, produced by the oxidation of graphene to add functional groups, such as epoxides, alcohols, and carboxylic acids that are inexpensive to produce and provide functional aptasensor platforms.186 Aptamers interact with GO noncovalently by hydrogen bonding and π–π stacking, which quenches their fluorescent tags. By contrast, dsDNA and/or aptamer-target complexes interact poorly with GO. Thus, analyte binding to GO-adsorbed aptamers releases the aptamers from GO surface by a structural switch mechanism whereupon their fluorescence increases.187-189
Taking advantage of the fact that solid supports such as GO can be used as effective fluorescence polarization (FP) enhancers due to their large mass, aptasensors for adenosine and thrombin were developed that remained associated in the presence of analyte but rearranged to expose a recognition site for the nicking enzyme, Nb. BbvCI, an endonuclease that cleaves only one strand of a dsDNA. Thus, analyte binding to the aptamer resulted in the release of the FAM label attached to the 5′ end of the Nb. BbvCI recognition sequence. Released FAM was measured by FP with high sensitivity.189.
Multiplexing to read many analytes simultaneously is readily achieved with optical analysis. One of the earliest examples used fluorescently labeled aptamers immobilized on glass surface to detect thrombin and the cancer-biomarker proteins inosine monophosphate dehydrogenase, vascular endothelial growth factor and basic fibroblast growth factor by fluorescence polarization even with a background of human serum and E. coli cell lysates.190 A further sophistication was to use aptamer-linked beads in a microarray with an “electronic tongue” that consists of a fluid delivery system and a fluorescence microscope with a digital camera for quantification.191 GO-based aptasensors can also be readily multiplexed.192
5. In vivo applications of aptamers for analysis
5.1. Small-molecule sensing aptamers in cells
Riboswitches are regulatory RNA units on mRNAs that bind small metabolites and regulate gene expression and translation.193, 194 Bacteria employ riboswitches (which have aptamer-like domains) to sense small molecules in their cytoplasm.193, 195, 196 This natural application of RNA aptamers has been emulated in synthetic riboswitches48, 197 and has the potential for integration in future synthetic biology applications for sensing analytes. To date, externally applied aptamers have been used to monitor ATP with a molecular beacon type sensor in which fluorescence quenching is relieved by analyte binding198 or by using gold nanoparticles decorated with aptamer sequences hybridized to a short complementary Cy5-labeled reporter strand that is released on analyte binding with an accompanying increase in fluorescence.139 In the same vein, G– quadruplex structures, known to shift structure with K+-binding, were labeled at both ends with pyrene to produce molecular beacon type probes specific for K+ over Na+ and with a fluorescent output that reports on subcellular locations of K+.199 These NA probes must be placed in cells by way of forced endocytosis or other means that temporarily damages the cell membrane and generally involves delivery of some or all of the probe to the lysosomes where they are subject to degradation. Degradation of a probe in which a fluorescence compound is quenched by the structurally confined association of a quencher and fluorophore results in a false positive signal. This problem can be circumvented by using NA probes modified to resist nucleases. However, the cellular damage and resulting cellular stress associated with healing membranes and regenerating lost cellular contents that occurs due to probe entry cannot be readily addressed when NA probes are applied extracellularly. The future development of aptamer probes that are expressed intracellularly by transcription will allow real-time tracking of metabolites and other cellular components in cells that are not under stress. So far, the expression of intracellular aptamer-based probes has only been applied for tracking gene expression.
5.2. Real time tracking of gene expression
Quantifying intracellular events by real time detection of biomolecules is important for understanding the mechanisms by which cells function. To date, green fluorescent protein (GFP) from the jellyfish, Aequorea victoria, and derivative fluorescent proteins have been used to understanding the roles of protein trafficking in cell biology and as reporters of gene expression.200 Although trafficking can be observed in real time, fluorescent reporters only provide indirect measurements of gene expression, due to the significant time lag between transcription and protein maturation. By comparison, aptamers fold cotranscriptionally and thus have the capability of providing a real-time signal for transcription.201, 202
Like aptamers, naturally occurring RNA elements bind their targets with high specificities and affinities. Although originally coined to describe in vitro-selected NAs, the term “aptamer” is frequently also used in reference to these RNAs, which have evolved to function intracellularly. RNA elements that bind bacteriophage coat proteins have been put to good purpose in real-time reporting of gene expression and in tracking RNA trafficking. These include the most frequently used MS2 RNA, which is a short sequence that folds as a hairpin with a tetraloop and a seven base pair stem containing an internal bulged adenine residue.203 Other RNA elements that have been employed for monitoring gene expression in real time include the 25 nt RNA hairpin loop that binds the dimeric PP7 bacteriophage coat protein,204 the λ phage transcriptional anti-termination signal, 15nt box B RNA, which forms a stem-loop that binds a 22 aa arginine-rich fragment of the λN protein,205, 206 a 21 nt RNA element that binds a fragment of the splicing protein U1Ap,207 a 29 nt hairpin E. coli transcriptional anti-terminator that binds the BglG protein,208, 209 and the viral HTLV-Rex, HIV-Rev RRE, and HIV TAT-TAR protein binding elements.210, 211 Many copies of the RNA binding elements are encoded in RNAs that are expressed on activation of a chosen promoter in a cell that also constitutively expresses the protein target of the RNA element fused with a fluorescent protein, which is usually GFP. Promoter activation results in RNA transcription and the RNA elements bind the target-GFP fusion proteins and concentrate them over the RNA. Although this method has been used successfully to identify and track newly synthesized RNAs in living cells, it requires sophisticated image analysis. This is because the GFP fusion proteins concentrated over the reporter RNAs must be identified in the presence of a high background contributed by the majority of cellular GFP fusion proteins that are not bound by the RNAs and increase the background noise.
To solve the problem of low signal/noise, bimolecular fluorescence complementation (BiFC) systems have been developed in which two fragments of a split fluorescent protein, each fused with one of two different RNA binding proteins, are co-expressed in cells with regulated RNA reporters that contain both RNA elements to bring the fragments together as a functional fluorescent protein.210-215 Although BiFC systems have lower backgrounds and therefore increased signal/noise, cell lines must be first created that express the fluorescent proteins. This requirement and the additional energy expended by the cells to synthesize the fluorescent fusion proteins and the requirement for oxygen for these proteins to mature also limits their application to certain cell types and cell culture environments.
An alternative means of detecting intracellular RNA in living cells involves the use of aptamers that bind small molecules such as MGA or SPNA for which target molecule increases its fluorescence.76, 216 Although SPNA does not provide sufficiently high fluorescence intensity to detect tagged mRNAs,217 it provides an excellent image contrast for abundant RNAs such as ribosomal RNA76 and the CGG trinucleotide-repeats in mammalian cells.216 Other similar dye-based systems have been developed with MG and its aptamer,218 and sulforhodamine B (SRB) and SRB-2 aptamer.219 As for SPNA, binding of MG to the MGA results in increased fluorescence yield.75 However, MGA is a poor aptamer choice for cell biology studies because its ligand, MG, is toxic at the concentrations required for measuring aptamer binding.220 Another means of obtaining a positive signal is with a fluorophore that is chemically linked to a quencher, which is bound by the aptamer to relieve quenching.75, 221 But, for SPNA, the fluorescence increase with these aptamers is not sufficient to detect mRNAs, which are present in cells at low concentrations and some of these ligands are toxic or have limited solubility in aqueous solution.
Detection of mRNAs can be achieved by sensitized FRET with IMAGEtags (Intracellular MultiAptamer GEnetic tags).217 The IMAGEtags, a string of aptamers, are the RNA reporters of transcription. To detect these reporter RNAs, two aptamer ligand derivatives are provided to the cells, each derivative containing a linked fluorophore (Cy3 or Cy5), which together interact in FRET once bound by the IMAGEtags. The high fluorescence yield of the Cy3 and Cy5 fluorophores combined with the higher signal/noise provided by the sensitized FRET was sufficient to detect tagged mRNAs in real-time in living yeast cells.
6. Conclusions
Since the first demonstrations in the 1990's that aptamers can be selected in vitro, both RNA and DNA aptamers have been the subjects of basic research studies of NA structural and functional capabilities, and have been applied in analytical devices for medical diagnostics, and for testing for drugs and other analytes in environmental samples and foods.222 Although antibodies are still much more frequently used than aptamers as sensors for specific analyte identification and quantification, aptamers have the potential of superseding many antibodies as sensors due to their high sensitivity and selectivity for analytes, low cost, stability to temperature and dehydration, ease of chemical modification, reusability after thermal denaturation and compatibility with a large range of detection methods. Also, aptamers, unlike antibodies, can be synthetically produced without batch to batch variability.
With so many features recommending them as suitable sensors for diagnostics, it is of note that aptamer-based sensors are breaking into the commercial realm very slowly, an example being the SOMAmer-based platform for detecting a panel of serum proteins reported 20 years after the development of SELEX.42 One likely reason for the lag in their commercialization is that the very characteristics of malleability in structure that enable aptamers to be incorporated into a large number of sensor platforms, which detect analyte-driven structural changes, also result in aptamers being sensitive to changes in environmental conditions such as the salt concentrations, pH and protein content of the sample. Thus, aptamers must be engineered to undergo structural shifts on analyte binding but for the aptamer-analyte complex to be structurally stable in the presence of a variety of environments to which they might be exposed from the query sample. The extent to which this structural balance of sensitivity to analyte and stability to environment can be achieved by the application of general principles rather than requiring specific engineering of each aptamer will influence the rate at which aptamer sensors are commercialized. Taking an alternative approach to increasing the aptamer-complex stability, SomaLogic developed SOMAmers with modified bases that enable high affinities for proteins and applied a generic method for detection that does not quantify changes in aptamer structure. The SomaLogic quantification protocol is compatible with high throughput analysis but not with a homogeneous assay. The SOMAmer is a successful universal approach to achieving higher aptamer affinity for proteins but cannot be readily applied to small molecules.
Compared with antibodies, aptamers are particularly well suited to recognizing small molecules with high affinity and specificity.8, 223 Thus, the development of aptamer sensors of small molecules, such as environmental pollutants and drugs, is likely to be a productive means of expanding the range of readily quantifiable analytes. Another niche for aptamers that is difficult for antibodies to fill is as sensors of intracellular events in living cells. The ability of RNA aptamers to fold in vivo to functional forms has resulted in their successful applications to real-time imaging.76, 217
Another niche for aptamer sensors is in devices that need to be stored for periods at variable temperatures and be reusable. Examples are sensors for monitoring environmental or food contaminants or pathogens such as viruses or bacteria. Being very stable in the dehydrated form and readily rehydrated to a functional form, aptamers are compatible with miniature and portable sensors that might be stored for long periods.
Overall, aptamer technology provides many challenges and opportunities for the development of new analytical devices that could substantially expand our abilities to detect and quantify important analytes that can currently not be readily assessed.
Supplementary Material
Figure 3.
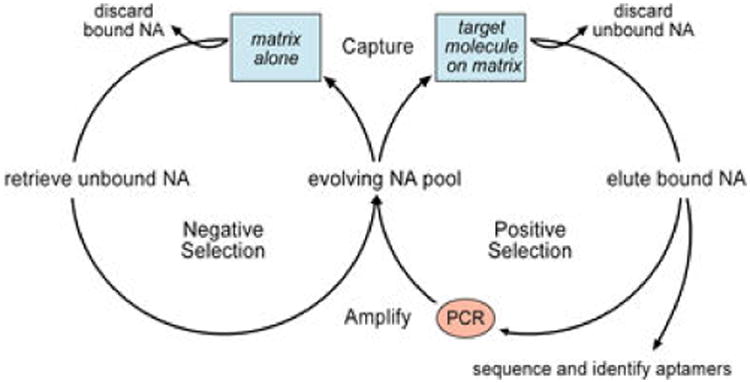
SELEX (Systematic Evolution of Ligands by EXponential enrichment).
Acknowledgments
MI was supported by grants 1R43DK098031 and 2R44DK098031 from the National Institutes of Health.
References
- 1.Ellington AD, Szostak JW. Nature. 1990;346:818–822. doi: 10.1038/346818a0. [DOI] [PubMed] [Google Scholar]
- 2.Robertson DL, Joyce GF. Nature. 1990;344:467–468. doi: 10.1038/344467a0. [DOI] [PubMed] [Google Scholar]
- 3.Tuerk C, Gold L. Science. 1990;249:505–510. doi: 10.1126/science.2200121. [DOI] [PubMed] [Google Scholar]
- 4.Wilson DS, Szostak JW. Annu Rev Biochem. 1999;68:611–647. doi: 10.1146/annurev.biochem.68.1.611. [DOI] [PubMed] [Google Scholar]
- 5.Shamah SM, Healy JM, Cload ST. Acc Chem Res. 2008;41:130–138. doi: 10.1021/ar700142z. [DOI] [PubMed] [Google Scholar]
- 6.Banerjee J, Nilsen-Hamilton M. J Mol Med (Berl) 2013;91:1333–1342. doi: 10.1007/s00109-013-1085-2. [DOI] [PubMed] [Google Scholar]
- 7.Da Costa JB, Dieckmann T. Mini Rev Med Chem. 2013;13:467–477. doi: 10.2174/1389557511313040001. [DOI] [PubMed] [Google Scholar]
- 8.Jenison RD, Gill SC, Pardi A, Polisky B. Science. 1994;263:1425–1429. doi: 10.1126/science.7510417. [DOI] [PubMed] [Google Scholar]
- 9.Yang Y, Kochoyan M, Burgstaller P, Westhof E, Famulok M. Science. 1996;272:1343–1347. doi: 10.1126/science.272.5266.1343. [DOI] [PubMed] [Google Scholar]
- 10.Labib M, Berezovski MV. Adv Biochem Eng Biotechnol. 2014;140:155–181. doi: 10.1007/10_2013_229. [DOI] [PubMed] [Google Scholar]
- 11.Gopinath SC, Awazu K, Fujimaki M. Sensors (Basel) 2012;12:2136–2151. doi: 10.3390/s120202136. [DOI] [PMC free article] [PubMed] [Google Scholar]
- 12.Hayat A, Marty JL. Front Chem. 2014;2:41. doi: 10.3389/fchem.2014.00041. [DOI] [PMC free article] [PubMed] [Google Scholar]
- 13.Cho EJ, Lee JW, Ellington AD. Annu Rev Anal Chem (Palo Alto Calif) 2009;2:241–264. doi: 10.1146/annurev.anchem.1.031207.112851. [DOI] [PubMed] [Google Scholar]
- 14.Zhou WZ, Huang PJJ, Ding JS, Liu J. Analyst. 2014;139:2627–2640. doi: 10.1039/c4an00132j. [DOI] [PubMed] [Google Scholar]
- 15.Liu J, Cao Z, Lu Y. Chemical Reviews. 2009;109:1948–1998. doi: 10.1021/cr030183i. [DOI] [PMC free article] [PubMed] [Google Scholar]
- 16.Mastronardi E, Foster A, Zhang X, DeRosa MC. Sensors (Basel) 2014;14:3156–3171. doi: 10.3390/s140203156. [DOI] [PMC free article] [PubMed] [Google Scholar]
- 17.Blank M, Weinschenk T, Priemer M, Schluesener H. J Biol Chem. 2001;276:16464–16468. doi: 10.1074/jbc.M100347200. [DOI] [PubMed] [Google Scholar]
- 18.Khati M, Schuman M, Ibrahim J, Sattentau Q, Gordon S, James W. J Virol. 2003;77:12692–12698. doi: 10.1128/JVI.77.23.12692-12698.2003. [DOI] [PMC free article] [PubMed] [Google Scholar]
- 19.Misono TS, Kumar PK. Anal Biochem. 2005;342:312–317. doi: 10.1016/j.ab.2005.04.013. [DOI] [PubMed] [Google Scholar]
- 20.Mendonsa SD, Bowser MT. Anal Chem. 2004;76:5387–5392. doi: 10.1021/ac049857v. [DOI] [PubMed] [Google Scholar]
- 21.Ahmad KM, Oh SS, Kim S, McClellen FM, Xiao Y, Soh HT. PLoS One. 2011;6:e27051. doi: 10.1371/journal.pone.0027051. [DOI] [PMC free article] [PubMed] [Google Scholar]
- 22.Yuce M, Ullah N, Budak H. Analyst. 2015;140:5379–5399. doi: 10.1039/c5an00954e. [DOI] [PubMed] [Google Scholar]
- 23.Seo YJ, Nilsen-Hamilton M, Levine HA. Bull Math Biol. 2014 doi: 10.1007/s11538-014-9954-6. [DOI] [PubMed] [Google Scholar]
- 24.Levine HA, Nilsen-Hamilton M. Comput Biol Chem. 2007;31:11–35. doi: 10.1016/j.compbiolchem.2006.10.002. [DOI] [PMC free article] [PubMed] [Google Scholar]
- 25.Schutze T, Wilhelm B, Greiner N, Braun H, Peter F, Morl M, Erdmann VA, Lehrach H, Konthur Z, Menger M, Arndt PF, Glokler J. PLoS One. 2011;6:e29604. doi: 10.1371/journal.pone.0029604. [DOI] [PMC free article] [PubMed] [Google Scholar]
- 26.Hoinka J, Zotenko E, Friedman A, Sauna ZE, Przytycka TM. Bioinformatics. 2012;28:i215–223. doi: 10.1093/bioinformatics/bts210. [DOI] [PMC free article] [PubMed] [Google Scholar]
- 27.Geiger A, Burgstaller P, von der Eltz H, Roeder A, Famulok M. Nucleic Acids Res. 1996;24:1029–1036. doi: 10.1093/nar/24.6.1029. [DOI] [PMC free article] [PubMed] [Google Scholar]
- 28.Ellington AD, Szostak JW. Nature. 1992;355:850–852. doi: 10.1038/355850a0. [DOI] [PubMed] [Google Scholar]
- 29.Draper DE. RNA. 2004;10:335–343. doi: 10.1261/rna.5205404. [DOI] [PMC free article] [PubMed] [Google Scholar]
- 30.Auffinger P, Grover N, Westhof E. Met Ions Life Sci. 2011;9:1–35. [PubMed] [Google Scholar]
- 31.Ilgu M, Fulton DB, Yennamalli RM, Lamm MH, Sen TZ, Nilsen-Hamilton M. RNA. 2014 doi: 10.1261/rna.041145.113. [DOI] [PMC free article] [PubMed] [Google Scholar]
- 32.Ilgu M, Wang T, Lamm MH, Nilsen-Hamilton M. Methods. 2013 doi: 10.1016/j.ymeth.2013.03.016. [DOI] [PubMed] [Google Scholar]
- 33.Liss M, Petersen B, Wolf H, Prohaska E. Anal Chem. 2002;74:4488–4495. doi: 10.1021/ac011294p. [DOI] [PubMed] [Google Scholar]
- 34.Kang K, Sachan A, Nilsen-Hamilton M, Shrotriya P. Langmuir. 2011;27:14696–14702. doi: 10.1021/la202067y. [DOI] [PubMed] [Google Scholar]
- 35.Keefe AD, Cload ST. Curr Opin Chem Biol. 2008;12:448–456. doi: 10.1016/j.cbpa.2008.06.028. [DOI] [PubMed] [Google Scholar]
- 36.Cox JC, Ellington AD. Bioorg Med Chem. 2001;9:2525–2531. doi: 10.1016/s0968-0896(01)00028-1. [DOI] [PubMed] [Google Scholar]
- 37.Cox JC, Hayhurst A, Hesselberth J, Bayer TS, Georgiou G, Ellington AD. Nucleic Acids Res. 2002;30:e108. doi: 10.1093/nar/gnf107. [DOI] [PMC free article] [PubMed] [Google Scholar]
- 38.Cox JC, Rajendran M, Riedel T, Davidson EA, Sooter LJ, Bayer TS, Schmitz-Brown M, Ellington AD. Comb Chem High Throughput Screen. 2002;5:289–299. doi: 10.2174/1386207023330291. [DOI] [PubMed] [Google Scholar]
- 39.Deng B, Lin Y, Wang C, Li F, Wang Z, Zhang H, Li XF, Le XC. Anal Chim Acta. 2014;837:1–15. doi: 10.1016/j.aca.2014.04.055. [DOI] [PubMed] [Google Scholar]
- 40.Hoinka J, Berezhnoy A, Sauna ZE, Gilboa E, Przytycka TM. Res Comput Mol Biol. 2014;8394:115–128. doi: 10.1007/978-3-319-05269-4_9. [DOI] [PMC free article] [PubMed] [Google Scholar]
- 41.Golden MC, Collins BD, Willis MC, Koch TH. J Biotechnol. 2000;81:167–178. doi: 10.1016/s0168-1656(00)00290-x. [DOI] [PubMed] [Google Scholar]
- 42.Gold L, Ayers D, Bertino J, Bock C, Bock A, Brody EN, Carter J, Dalby AB, Eaton BE, Fitzwater T, Flather D, Forbes A, Foreman T, Fowler C, Gawande B, Goss M, Gunn M, Gupta S, Halladay D, Heil J, Heilig J, Hicke B, Husar G, Janjic N, Jarvis T, Jennings S, Katilius E, Keeney TR, Kim N, Koch TH, Kraemer S, Kroiss L, Le N, Levine D, Lindsey W, Lollo B, Mayfield W, Mehan M, Mehler R, Nelson SK, Nelson M, Nieuwlandt D, Nikrad M, Ochsner U, Ostroff RM, Otis M, Parker T, Pietrasiewicz S, Resnicow DI, Rohloff J, Sanders G, Sattin S, Schneider D, Singer B, Stanton M, Sterkel A, Stewart A, Stratford S, Vaught JD, Vrkljan M, Walker JJ, Watrobka M, Waugh S, Weiss A, Wilcox SK, Wolfson A, Wolk SK, Zhang C, Zichi D. PLoS One. 2010;5:e15004. doi: 10.1371/journal.pone.0015004. [DOI] [PMC free article] [PubMed] [Google Scholar]
- 43.Jenison RD, Jennings SD, Walker DW, Bargatze RF, Parma D. Antisense Nucleic Acid Drug Dev. 1998;8:265–279. doi: 10.1089/oli.1.1998.8.265. [DOI] [PubMed] [Google Scholar]
- 44.Niebel B, Wosnitza CI, Famulok M. Bioorganic & Medicinal Chemistry. 2013;21:6239–6246. doi: 10.1016/j.bmc.2013.05.021. [DOI] [PubMed] [Google Scholar]
- 45.Kiga D, Futamura Y, Sakamoto K, Yokoyama S. Nucleic Acids Res. 1998;26:1755–1760. doi: 10.1093/nar/26.7.1755. [DOI] [PMC free article] [PubMed] [Google Scholar]
- 46.Mandal M, Boese B, Barrick JE, Winkler WC, Breaker RR. Cell. 2003;113:577–586. doi: 10.1016/s0092-8674(03)00391-x. [DOI] [PubMed] [Google Scholar]
- 47.Wallis MG, von Ahsen U, Schroeder R, Famulok M. Chem Biol. 1995;2:543–552. doi: 10.1016/1074-5521(95)90188-4. [DOI] [PubMed] [Google Scholar]
- 48.Weigand JE, Sanchez M, Gunnesch EB, Zeiher S, Schroeder R, Suess B. RNA. 2008;14:89–97. doi: 10.1261/rna.772408. [DOI] [PMC free article] [PubMed] [Google Scholar]
- 49.Zhang Y, Chen Y, Han D, Ocsoy I, Tan W. Bioanalysis. 2010;2:907–918. doi: 10.4155/bio.10.46. [DOI] [PMC free article] [PubMed] [Google Scholar]
- 50.Fang X, Tan W. Acc Chem Res. 2010;43:48–57. doi: 10.1021/ar900101s. [DOI] [PMC free article] [PubMed] [Google Scholar]
- 51.Mi J, Liu Y, Rabbani ZN, Yang Z, Urban JH, Sullenger BA, Clary BM. Nat Chem Biol. 2010;6:22–24. doi: 10.1038/nchembio.277. [DOI] [PMC free article] [PubMed] [Google Scholar]
- 52.Irvine D, Tuerk C, Gold L. J Mol Biol. 1991;222:739–761. doi: 10.1016/0022-2836(91)90509-5. [DOI] [PubMed] [Google Scholar]
- 53.Seo YJ, Chen S, Nilsen-Hamilton M, Levine HA. Bull Math Biol. 2010;72:1623–1665. doi: 10.1007/s11538-009-9491-x. [DOI] [PubMed] [Google Scholar]
- 54.Xayaphoummine A, Bucher T, Isambert H. Nucleic Acids Res. 2005;33:W605–610. doi: 10.1093/nar/gki447. [DOI] [PMC free article] [PubMed] [Google Scholar]
- 55.Parisien M, Major F. Nature. 2008;452:51–55. doi: 10.1038/nature06684. [DOI] [PubMed] [Google Scholar]
- 56.Beier R, Boschke E, Labudde D. Biomed Res Int. 2014;2014:849743. doi: 10.1155/2014/849743. [DOI] [PMC free article] [PubMed] [Google Scholar]
- 57.Ditzler MA, Lange MJ, Bose D, Bottoms CA, Virkler KF, Sawyer AW, Whatley AS, Spollen W, Givan SA, Burke DH. Nucleic Acids Research. 2013;41:1873–1884. doi: 10.1093/nar/gks1190. [DOI] [PMC free article] [PubMed] [Google Scholar]
- 58.Alam KK, Chang JL, Burke DH. Mol Ther Nucleic Acids. 2015;4:e230. doi: 10.1038/mtna.2015.4. [DOI] [PMC free article] [PubMed] [Google Scholar]
- 59.Chushak Y, Stone MO. Nucleic Acids Res. 2009;37:e87. doi: 10.1093/nar/gkp408. [DOI] [PMC free article] [PubMed] [Google Scholar]
- 60.Wilkinson KA, Merino EJ, Weeks KM. Nat Protoc. 2006;1:1610–1616. doi: 10.1038/nprot.2006.249. [DOI] [PubMed] [Google Scholar]
- 61.Chodosh LA. Curr Protoc Mol Biol. 2001;Chapter 12 doi: 10.1002/0471142727.mb1206s36. Unit 12 15. [DOI] [PubMed] [Google Scholar]
- 62.Macaya RF, Schultze P, Smith FW, Roe JA, Feigon J. Proc Natl Acad Sci U S A. 1993;90:3745–3749. doi: 10.1073/pnas.90.8.3745. [DOI] [PMC free article] [PubMed] [Google Scholar]
- 63.Jhaveri SD, Kirby R, Conrad R, Maglott EJ, Bowser M, Kennedy RT, Glick G, Ellington AD. Journal of the American Chemical Society. 2000;122:2469–2473. [Google Scholar]
- 64.Nutiu R, Li Y. Methods. 2005;37:16–25. doi: 10.1016/j.ymeth.2005.07.001. [DOI] [PubMed] [Google Scholar]
- 65.Hermann T, Patel DJ. Science. 2000;287:820–825. doi: 10.1126/science.287.5454.820. [DOI] [PubMed] [Google Scholar]
- 66.Sassolas A, Blum LJ, Leca-Bouvier BD. Analyst. 2011;136:257–274. doi: 10.1039/c0an00281j. [DOI] [PubMed] [Google Scholar]
- 67.Jiang Y, Fang X, Bai C. Anal Chem. 2004;76:5230–5235. doi: 10.1021/ac049565u. [DOI] [PubMed] [Google Scholar]
- 68.Zhou C, Jiang Y, Hou S, Ma B, Fang X, Li M. Anal Bioanal Chem. 2006;384:1175–1180. doi: 10.1007/s00216-005-0276-2. [DOI] [PubMed] [Google Scholar]
- 69.Stojanovic MN, Landry DW. J Am Chem Soc. 2002;124:9678–9679. doi: 10.1021/ja0259483. [DOI] [PubMed] [Google Scholar]
- 70.Li B, Wei H, Dong S. Chem Commun (Camb) 2007:73–75. doi: 10.1039/b612080f. [DOI] [PubMed] [Google Scholar]
- 71.Zeng X, Wang C, Li YX, Li XX, Su YY, An J, Tang YL. Analyst. 2015;140:1192–1197. doi: 10.1039/c4an01963f. [DOI] [PubMed] [Google Scholar]
- 72.Ohyama T, Kato Y, Mita H, Nagatomo S, Yamamoto Y. Nucleic Acids Symp Ser (Oxf) 2005:245–246. doi: 10.1093/nass/49.1.245. [DOI] [PubMed] [Google Scholar]
- 73.Travascio P, Li Y, Sen D. Chem Biol. 1998;5:505–517. doi: 10.1016/s1074-5521(98)90006-0. [DOI] [PubMed] [Google Scholar]
- 74.Liu H, Wang YS, Wang JC, Xue JH, Zhou B, Zhao H, Liu SD, Tang X, Chen SH, Li MH, Cao JX. Anal Biochem. 2014;458:4–10. doi: 10.1016/j.ab.2014.04.031. [DOI] [PubMed] [Google Scholar]
- 75.Babendure JR, Adams SR, Tsien RY. J Am Chem Soc. 2003;125:14716–14717. doi: 10.1021/ja037994o. [DOI] [PubMed] [Google Scholar]
- 76.Paige JS, Wu KY, Jaffrey SR. Science. 2011;333:642–646. doi: 10.1126/science.1207339. [DOI] [PMC free article] [PubMed] [Google Scholar]
- 77.Stojanovic MN, Kolpashchikov DM. J Am Chem Soc. 2004;126:9266–9270. doi: 10.1021/ja032013t. [DOI] [PubMed] [Google Scholar]
- 78.Paige JS, Nguyen-Duc T, Song W, Jaffrey SR. Science. 2012;335:1194. doi: 10.1126/science.1218298. [DOI] [PMC free article] [PubMed] [Google Scholar]
- 79.Xu W, Lu Y. Anal Chem. 2010;82:574–578. doi: 10.1021/ac9018473. [DOI] [PMC free article] [PubMed] [Google Scholar]
- 80.Ho HA, Leclerc M. J Am Chem Soc. 2004;126:1384–1387. doi: 10.1021/ja037289f. [DOI] [PubMed] [Google Scholar]
- 81.Li JJ, Fang X, Tan W. Biochem Biophys Res Commun. 2002;292:31–40. doi: 10.1006/bbrc.2002.6581. [DOI] [PubMed] [Google Scholar]
- 82.Stojanovic MN, de Prada P, Landry DW. J Am Chem Soc. 2001;123:4928–4931. doi: 10.1021/ja0038171. [DOI] [PubMed] [Google Scholar]
- 83.Li W, Yang X, Wang K, Tan W, Li H, Ma C. Talanta. 2008;75:770–774. doi: 10.1016/j.talanta.2007.12.012. [DOI] [PubMed] [Google Scholar]
- 84.Rajendran M, Ellington AD. Comb Chem High Throughput Screen. 2002;5:263–270. doi: 10.2174/1386207023330246. [DOI] [PubMed] [Google Scholar]
- 85.Tyagi S, Kramer FR. Nat Biotechnol. 1996;14:303–308. doi: 10.1038/nbt0396-303. [DOI] [PubMed] [Google Scholar]
- 86.Tan W, Wang K, Drake TJ. Curr Opin Chem Biol. 2004;8:547–553. doi: 10.1016/j.cbpa.2004.08.010. [DOI] [PubMed] [Google Scholar]
- 87.Drake TJ, Tan W. Appl Spectrosc. 2004;58:269A–280A. doi: 10.1366/0003702041959406. [DOI] [PubMed] [Google Scholar]
- 88.Hamaguchi N, Ellington A, Stanton M. Anal Biochem. 2001;294:126–131. doi: 10.1006/abio.2001.5169. [DOI] [PubMed] [Google Scholar]
- 89.Nutiu R, Li Y. Chemistry. 2004;10:1868–1876. doi: 10.1002/chem.200305470. [DOI] [PubMed] [Google Scholar]
- 90.Nutiu R, Li Y. J Am Chem Soc. 2003;125:4771–4778. doi: 10.1021/ja028962o. [DOI] [PubMed] [Google Scholar]
- 91.Heyduk E, Heyduk T. Anal Chem. 2005;77:1147–1156. doi: 10.1021/ac0487449. [DOI] [PubMed] [Google Scholar]
- 92.Tang Z, Mallikaratchy P, Yang R, Kim Y, Zhu Z, Wang H, Tan W. J Am Chem Soc. 2008;130:11268–11269. doi: 10.1021/ja804119s. [DOI] [PubMed] [Google Scholar]
- 93.Bhadra S, Ellington AD. RNA. 2014;20:1183–1194. doi: 10.1261/rna.045047.114. [DOI] [PMC free article] [PubMed] [Google Scholar]
- 94.Cong X, Nilsen-Hamilton M. Biochemistry. 2005;44:7945–7954. doi: 10.1021/bi047507x. [DOI] [PubMed] [Google Scholar]
- 95.Wang HQ, Wu Z, Tang LJ, Yu RQ, Jiang JH. Nucleic Acids Res. 2011;39:e122. doi: 10.1093/nar/gkr559. [DOI] [PMC free article] [PubMed] [Google Scholar]
- 96.Yamana K, Iwai T, Ohtani Y, Sato S, Nakamura M, Nakano H. Bioconjug Chem. 2002;13:1266–1273. doi: 10.1021/bc025530u. [DOI] [PubMed] [Google Scholar]
- 97.Kamekawa N, Shimomura Y, Nakamura M, Yamana K. Chemistry Letters. 2006;35:660–661. [Google Scholar]
- 98.Yang CJ, Jockusch S, Vicens M, Turro NJ, Tan W. Proc Natl Acad Sci U S A. 2005;102:17278–17283. doi: 10.1073/pnas.0508821102. [DOI] [PMC free article] [PubMed] [Google Scholar]
- 99.Shi C, Gu H, Ma C. Anal Biochem. 2010;400:99–102. doi: 10.1016/j.ab.2009.12.034. [DOI] [PubMed] [Google Scholar]
- 100.Fang X, Cao Z, Beck T, Tan W. Anal Chem. 2001;73:5752–5757. doi: 10.1021/ac010703e. [DOI] [PubMed] [Google Scholar]
- 101.Yamamoto R, Baba T, Kumar PK. Genes Cells. 2000;5:389–396. doi: 10.1046/j.1365-2443.2000.00331.x. [DOI] [PubMed] [Google Scholar]
- 102.Sharma AK, Kent AD, Heemstra JM. Anal Chem. 2012;84:6104–6109. doi: 10.1021/ac300997q. [DOI] [PubMed] [Google Scholar]
- 103.Kato T, Yano K, Ikebukuro K, Karube I. Analyst. 2000;125:1371–1373. doi: 10.1039/b004580m. [DOI] [PubMed] [Google Scholar]
- 104.Fredriksson S, Gullberg M, Jarvius J, Olsson C, Pietras K, Gustafsdottir SM, Ostman A, Landegren U. Nat Biotechnol. 2002;20:473–477. doi: 10.1038/nbt0502-473. [DOI] [PubMed] [Google Scholar]
- 105.Wei Y, Zhou W, Liu J, Chai Y, Xiang Y, Yuan R. Talanta. 2015;141:230–234. doi: 10.1016/j.talanta.2015.04.005. [DOI] [PubMed] [Google Scholar]
- 106.Levy M, Cater SF, Ellington AD. Chembiochem. 2005;6:2163–2166. doi: 10.1002/cbic.200500218. [DOI] [PubMed] [Google Scholar]
- 107.Ikanovic M, Rudzinski WE, Bruno JG, Allman A, Carrillo MP, Dwarakanath S, Bhahdigadi S, Rao P, Kiel JL, Andrews CJ. J Fluoresc. 2007;17:193–199. doi: 10.1007/s10895-007-0158-4. [DOI] [PubMed] [Google Scholar]
- 108.Chu TC, Shieh F, Lavery LA, Levy M, Richards-Kortum R, Korgel BA, Ellington AD. Biosens Bioelectron. 2006;21:1859–1866. doi: 10.1016/j.bios.2005.12.015. [DOI] [PubMed] [Google Scholar]
- 109.Huang CC, Huang YF, Cao Z, Tan W, Chang HT. Anal Chem. 2005;77:5735–5741. doi: 10.1021/ac050957q. [DOI] [PubMed] [Google Scholar]
- 110.Pavlov V, Xiao Y, Shlyahovsky B, Willner I. J Am Chem Soc. 2004;126:11768–11769. doi: 10.1021/ja046970u. [DOI] [PubMed] [Google Scholar]
- 111.Li YY, Zhang C, Li BS, Zhao LF, Li XB, Yang WJ, Xu SQ. Clin Chem. 2007;53:1061–1066. doi: 10.1373/clinchem.2006.082271. [DOI] [PubMed] [Google Scholar]
- 112.Zhao W, Chiuman W, Brook MA, Li Y. Chembiochem. 2007;8:727–731. doi: 10.1002/cbic.200700014. [DOI] [PubMed] [Google Scholar]
- 113.Liu JW, Lu Y. Advanced Materials. 2006;18:1667–1671. [Google Scholar]
- 114.Liu JW, Lu Y. Angewandte Chemie-International Edition. 2006;45:90–94. [Google Scholar]
- 115.Liu J, Lu Y. Anal Chem. 2004;76:1627–1632. doi: 10.1021/ac0351769. [DOI] [PubMed] [Google Scholar]
- 116.Sassolas A, Blum LJ, Leca-Bouvier BD. Electroanalysis. 2009;21:1237–1250. [Google Scholar]
- 117.Lai RY, Plaxco KW, Heeger AJ. Anal Chem. 2007;79:229–233. doi: 10.1021/ac061592s. [DOI] [PubMed] [Google Scholar]
- 118.Xiao Y, Piorek BD, Plaxco KW, Heeger AJ. J Am Chem Soc. 2005;127:17990–17991. doi: 10.1021/ja056555h. [DOI] [PubMed] [Google Scholar]
- 119.Xu Y, Yang L, Ye XY, He PA, Fang YZ. Electroanalysis. 2006;18:1449–1456. [Google Scholar]
- 120.Wang X, Zhou J, Yun W, Xiao S, Chang Z, He P, Fang Y. Anal Chim Acta. 2007;598:242–248. doi: 10.1016/j.aca.2007.07.050. [DOI] [PubMed] [Google Scholar]
- 121.White RJ, Rowe AA, Plaxco KW. Analyst. 2010;135:589–594. doi: 10.1039/b921253a. [DOI] [PMC free article] [PubMed] [Google Scholar]
- 122.Numnuam A, Chumbimuni-Torres KY, Xiang Y, Bash R, Thavarungkul P, Kanatharana P, Pretsch E, Wang J, Bakker E. Anal Chem. 2008;80:707–712. doi: 10.1021/ac701910r. [DOI] [PMC free article] [PubMed] [Google Scholar]
- 123.Zheng Y, Yuan Y, Chai Y, Yuan R. Biosensors & Bioelectronics. 2015;66:585–589. doi: 10.1016/j.bios.2014.12.022. [DOI] [PubMed] [Google Scholar]
- 124.Zhao J, Xin M, Cao Y, Yin Y, Shu Y, Ma W. Analytica Chimica Acta. 2015;860:23–28. doi: 10.1016/j.aca.2014.12.026. [DOI] [PubMed] [Google Scholar]
- 125.Xue Q, Liu Z, Guo Y, Guo S. Biosensors & Bioelectronics. 2015;68:429–436. doi: 10.1016/j.bios.2015.01.025. [DOI] [PubMed] [Google Scholar]
- 126.Xu W, Yi H, Yuan Y, Jing P, Chai Y, Yuan R, Wilson GS. Biosensors & Bioelectronics. 2015;64:423–428. doi: 10.1016/j.bios.2014.08.091. [DOI] [PubMed] [Google Scholar]
- 127.Li S, Zhu W, Xue Y, Liu S. Biosensors & Bioelectronics. 2015;64:611–617. doi: 10.1016/j.bios.2014.09.072. [DOI] [PubMed] [Google Scholar]
- 128.Bao T, Wen W, Zhang X, Wang S. Analytica Chimica Acta. 2015;860:70–76. doi: 10.1016/j.aca.2014.12.027. [DOI] [PubMed] [Google Scholar]
- 129.Sun A, Qi Q, Wang X, Bie P. Biosensors & Bioelectronics. 2014;57:16–21. doi: 10.1016/j.bios.2014.01.040. [DOI] [PubMed] [Google Scholar]
- 130.Chang Z, Zang Y, Chen C, He P, Fang Y. Analytical Letters. 2014;47:309–322. [Google Scholar]
- 131.Hansen JA, Wang J, Kawde AN, Xiang Y, Gothelf KV, Collins G. Journal of the American Chemical Society. 2006;128:2228–2229. doi: 10.1021/ja060005h. [DOI] [PubMed] [Google Scholar]
- 132.Baker BR, Lai RY, Wood MS, Doctor EH, Heeger AJ, Plaxco KW. J Am Chem Soc. 2006;128:3138–3139. doi: 10.1021/ja056957p. [DOI] [PubMed] [Google Scholar]
- 133.Ferapontova EE, Gothelf KV. Langmuir. 2009;25:4279–4283. doi: 10.1021/la804309j. [DOI] [PubMed] [Google Scholar]
- 134.Ferapontova EE, Olsen EM, Gothelf KV. J Am Chem Soc. 2008;130:4256–4258. doi: 10.1021/ja711326b. [DOI] [PubMed] [Google Scholar]
- 135.Zayats M, Huang Y, Gill R, Ma CA, Willner I. J Am Chem Soc. 2006;128:13666–13667. doi: 10.1021/ja0651456. [DOI] [PubMed] [Google Scholar]
- 136.Feng KJ, Sun CH, Kang Y, Chen JW, Jiang JH, Shen GL, Yu RQ. Electrochemistry Communications. 2008;10:531–535. [Google Scholar]
- 137.Schoukroun-Barnes LR, Wagan S, White RJ. Analytical Chemistry. 2014;86:1131–1137. doi: 10.1021/ac4029054. [DOI] [PubMed] [Google Scholar]
- 138.Zhou N, Luo J, Zhang J, You Y, Tian Y. Analytical Methods. 2015;7:1991–1996. [Google Scholar]
- 139.Zheng D, Seferos DS, Giljohann DA, Patel PC, Mirkin CA. Nano letters. 2009;9:3258–3261. doi: 10.1021/nl901517b. [DOI] [PMC free article] [PubMed] [Google Scholar]
- 140.Zuo X, Song S, Zhang J, Pan D, Wang L, Fan C. J Am Chem Soc. 2007;129:1042–1043. doi: 10.1021/ja067024b. [DOI] [PubMed] [Google Scholar]
- 141.Radi AE, O'Sullivan CK. Chem Commun (Camb) 2006:3432–3434. doi: 10.1039/b606804a. [DOI] [PubMed] [Google Scholar]
- 142.Xiao Y, Rowe AA, Plaxco KW. J Am Chem Soc. 2007;129:262–263. doi: 10.1021/ja067278x. [DOI] [PubMed] [Google Scholar]
- 143.Lu L, Li J, Kang T, Cheng S. Talanta. 2015;138:273–278. doi: 10.1016/j.talanta.2015.03.016. [DOI] [PubMed] [Google Scholar]
- 144.Liu B, Zhang B, Chen G, Yang H, Tang D. Biosensors and Bioelectronics. 2014;53:390–398. doi: 10.1016/j.bios.2013.10.022. [DOI] [PubMed] [Google Scholar]
- 145.Hong B, Zu Y. Theranostics. 2013;3:377–394. doi: 10.7150/thno.5195. [DOI] [PMC free article] [PubMed] [Google Scholar]
- 146.Hu M, Zhang K. Future Oncol. 2013;9:369–376. doi: 10.2217/fon.12.201. [DOI] [PubMed] [Google Scholar]
- 147.Pei X, Zhang J, Liu J. Mol Clin Oncol. 2014;2:341–348. doi: 10.3892/mco.2014.255. [DOI] [PMC free article] [PubMed] [Google Scholar]
- 148.Hong P, Li W, Li J. Sensors (Basel) 2012;12:1181–1193. doi: 10.3390/s120201181. [DOI] [PMC free article] [PubMed] [Google Scholar]
- 149.Yang Z, Kasprzyk-Hordern B, Goggins S, Frost CG, Estrela P. Analyst. 2015;140:2628–2633. doi: 10.1039/c4an02277g. [DOI] [PubMed] [Google Scholar]
- 150.Wang T, Liu J, Gu X, Li D, Wang J, Wang E. Analytica Chimica Acta. 2015;882:32–37. doi: 10.1016/j.aca.2015.05.008. [DOI] [PubMed] [Google Scholar]
- 151.Lu CY, Xu JJ, Wang ZH, Chen HY. Electrochemistry Communications. 2015;52:49–52. [Google Scholar]
- 152.Pan C, Guo M, Nie Z, Xiao X, Yao S. Electroanalysis. 2009;21:1321–1326. [Google Scholar]
- 153.Sharma R, Agrawal VV, Sharma P, Varshney R, Sinha RK, Malhotra BD. India-Japan Workshop on Biomolecular Electronics and Organic Nanotechnology for Environment Preservation. 2012;358:012001. [Google Scholar]
- 154.Xiao Y, Uzawa T, White RJ, Demartini D, Plaxco KW. Electroanalysis. 2009;21:1267–1271. doi: 10.1002/elan.200804564. [DOI] [PMC free article] [PubMed] [Google Scholar]
- 155.Traut TW. Mol Cell Biochem. 1994;140:1–22. doi: 10.1007/BF00928361. [DOI] [PubMed] [Google Scholar]
- 156.Zhai L, Wang T, Kang K, Zhao Y, Shrotriya P, Nilsen-Hamilton M. Anal Chem. 2012;84:8763–8770. doi: 10.1021/ac3020643. [DOI] [PubMed] [Google Scholar]
- 157.Kang K, Nilsen-Hamilton M, Shrotriya P. Applied Physics Letters. 2008;93 [Google Scholar]
- 158.Zhi-Wei L, Zhao-Yang T, Lan-Qun H, Bing L, Xi-Hui M, Jin-Ping Z, Chuan G. Chin J Anal Chem. 2014;42:1143–1147. [Google Scholar]
- 159.Savran CA, Knudsen SM, Ellington AD, Manalis SR. Anal Chem. 2004;76:3194–3198. doi: 10.1021/ac049859f. [DOI] [PubMed] [Google Scholar]
- 160.Hwang KS, Lee SM, Eom K, Lee JH, Lee YS, Park JH, Yoon DS, Kim TS. Biosens Bioelectron. 2007;23:459–465. doi: 10.1016/j.bios.2007.05.006. [DOI] [PubMed] [Google Scholar]
- 161.Kim Y, Cao Z, Tan W. Proc Natl Acad Sci U S A. 2008;105:5664–5669. doi: 10.1073/pnas.0711803105. [DOI] [PMC free article] [PubMed] [Google Scholar]
- 162.Kiessling LL, Strong LE, Gestwicki JE. Annual Reports in Medicinal Chemistry, Vol 35. 2000;35:321–330. [Google Scholar]
- 163.Kiessling LL, Gestwicki JE, Strong LE. Angewandte Chemie-International Edition. 2006;45:2348–2368. doi: 10.1002/anie.200502794. [DOI] [PMC free article] [PubMed] [Google Scholar]
- 164.Dupuis NF, Holmstrom ED, Nesbitt DJ. Proc Natl Acad Sci U S A. 2014;111:8464–8469. doi: 10.1073/pnas.1316039111. [DOI] [PMC free article] [PubMed] [Google Scholar]
- 165.Paudel BP, Rueda D. J Am Chem Soc. 2014;136:16700–16703. doi: 10.1021/ja5073146. [DOI] [PMC free article] [PubMed] [Google Scholar]
- 166.Hianik T, Ostatna V, Zajacova Z, Stoikova E, Evtugyn G. Bioorg Med Chem Lett. 2005;15:291–295. doi: 10.1016/j.bmcl.2004.10.083. [DOI] [PubMed] [Google Scholar]
- 167.Minunni M, Tombelli S, Gullotto A, Luzi E, Mascini M. Biosens Bioelectron. 2004;20:1149–1156. doi: 10.1016/j.bios.2004.03.037. [DOI] [PubMed] [Google Scholar]
- 168.Schlensog MD, Gronewold TMA, Tewes M, Famulok M, Quandt E. Sensors and Actuators B-Chemical. 2004;101:308–315. [Google Scholar]
- 169.Gronewold TMA, Glass S, Quandt E, Famulok M. Biosensors & Bioelectronics. 2005;20:2044–2052. doi: 10.1016/j.bios.2004.09.007. [DOI] [PubMed] [Google Scholar]
- 170.Neves MA, Blaszykowski C, Bokhari S, Thompson M. Biosens Bioelectron. 2015;72:383–392. doi: 10.1016/j.bios.2015.05.038. [DOI] [PubMed] [Google Scholar]
- 171.Neves MA, Reinstein O, Johnson PE. Biochemistry. 2010;49:8478–8487. doi: 10.1021/bi100952k. [DOI] [PubMed] [Google Scholar]
- 172.Tombelli S, Minunni M, Luzi E, Mascini M. Bioelectrochemistry. 2005;67:135–141. doi: 10.1016/j.bioelechem.2004.04.011. [DOI] [PubMed] [Google Scholar]
- 173.Lee SJ, Youn BS, Park JW, Niazi JH, Kim YS, Gu MB. Anal Chem. 2008;80:2867–2873. doi: 10.1021/ac800050a. [DOI] [PubMed] [Google Scholar]
- 174.Guo L, Kim DH. Biosens Bioelectron. 2012;31:567–570. doi: 10.1016/j.bios.2011.10.047. [DOI] [PubMed] [Google Scholar]
- 175.Li Y, Lee HJ, Corn RM. Anal Chem. 2007;79:1082–1088. doi: 10.1021/ac061849m. [DOI] [PMC free article] [PubMed] [Google Scholar]
- 176.Knudsen SM, Lee J, Ellington AD, Savran CA. J Am Chem Soc. 2006;128:15936–15937. doi: 10.1021/ja064137m. [DOI] [PubMed] [Google Scholar]
- 177.Li Y, Lee HJ, Corn RM. Nucleic Acids Res. 2006;34:6416–6424. doi: 10.1093/nar/gkl738. [DOI] [PMC free article] [PubMed] [Google Scholar]
- 178.Wang Z, Wilkop T, Xu D, Dong Y, Ma G, Cheng Q. Anal Bioanal Chem. 2007;389:819–825. doi: 10.1007/s00216-007-1510-x. [DOI] [PubMed] [Google Scholar]
- 179.Kwon MJ, Lee J, Wark AW, Lee HJ. Anal Chem. 2012;84:1702–1707. doi: 10.1021/ac202957h. [DOI] [PubMed] [Google Scholar]
- 180.Potyrailo RA, Conrad RC, Ellington AD, Hieftje GM. Anal Chem. 1998;70:3419–3425. doi: 10.1021/ac9802325. [DOI] [PubMed] [Google Scholar]
- 181.Gee ML, Lensun L, Smith TA, Scholes CA. European Biophysics Journal with Biophysics Letters. 2004;33:130–139. doi: 10.1007/s00249-003-0360-5. [DOI] [PubMed] [Google Scholar]
- 182.Huang YF, Chang HT, Tan WH. Analytical Chemistry. 2008;80:567–572. doi: 10.1021/ac702322j. [DOI] [PubMed] [Google Scholar]
- 183.Yang H, Liu H, Kang H, Tan W. Journal of the American Chemical Society. 2008;130:6320–6321. doi: 10.1021/ja801339w. [DOI] [PMC free article] [PubMed] [Google Scholar]
- 184.Dave N, Chan MY, Huang PJJ, Smith BD, Liu J. Journal of the American Chemical Society. 2010;132:12668–12673. doi: 10.1021/ja106098j. [DOI] [PubMed] [Google Scholar]
- 185.Wang R, Li Y. Biosensors and Bioelectronics. 2013;42:148–155. doi: 10.1016/j.bios.2012.10.038. [DOI] [PubMed] [Google Scholar]
- 186.Robinson JT, Perkins FK, Snow ES, Wei Z, Sheehan PE. Nano letters. 2008;8:3137–3140. doi: 10.1021/nl8013007. [DOI] [PubMed] [Google Scholar]
- 187.Lu CH, Yang HH, Zhu CL, Chen X, Chen GN. Angewandte Chemie-International Edition. 2009;48:4785–4787. doi: 10.1002/anie.200901479. [DOI] [PubMed] [Google Scholar]
- 188.Chang H, Tang L, Wang Y, Jiang J, Li J. Analytical Chemistry. 2010;82:2341–2346. doi: 10.1021/ac9025384. [DOI] [PubMed] [Google Scholar]
- 189.Huang Y, Liu X, Zhang L, Hu K, Zhao S, Fang B, Chen ZF, Liang H. Biosensors & Bioelectronics. 2015;63:178–184. doi: 10.1016/j.bios.2014.07.036. [DOI] [PubMed] [Google Scholar]
- 190.McCauley TG, Hamaguchi N, Stanton M. Anal Biochem. 2003;319:244–250. doi: 10.1016/s0003-2697(03)00297-5. [DOI] [PubMed] [Google Scholar]
- 191.Kirby R, Cho EJ, Gehrke B, Bayer T, Park YS, Neikirk DP, McDevitt JT, Ellington AD. Anal Chem. 2004;76:4066–4075. doi: 10.1021/ac049858n. [DOI] [PubMed] [Google Scholar]
- 192.Chen X, Zhou H, Zhai N, Liu P, Chen Q, Jin L, Zheng Q. Analytical Letters. 2015;48:1892–1906. [Google Scholar]
- 193.Winkler W, Nahvi A, Breaker RR. Nature. 2002;419:952–956. doi: 10.1038/nature01145. [DOI] [PubMed] [Google Scholar]
- 194.Breaker RR. Cold Spring Harb Perspect Biol. 2012;4 doi: 10.1101/cshperspect.a003566. [DOI] [PMC free article] [PubMed] [Google Scholar]
- 195.Gelfand MS, Mironov AA, Jomantas J, Kozlov YI, Perumov DA. Trends Genet. 1999;15:439–442. doi: 10.1016/s0168-9525(99)01856-9. [DOI] [PubMed] [Google Scholar]
- 196.Roth A, Breaker RR. Annu Rev Biochem. 2009;78:305–334. doi: 10.1146/annurev.biochem.78.070507.135656. [DOI] [PMC free article] [PubMed] [Google Scholar]
- 197.Suess B, Fink B, Berens C, Stentz R, Hillen W. Nucleic Acids Res. 2004;32:1610–1614. doi: 10.1093/nar/gkh321. [DOI] [PMC free article] [PubMed] [Google Scholar]
- 198.Ozalp VC, Pedersen TR, Nielsen LJ, Olsen LF. Journal of Biological Chemistry. 2010;285:37579–37588. doi: 10.1074/jbc.M110.155119. [DOI] [PMC free article] [PubMed] [Google Scholar]
- 199.Nagatoishi S, Nojima T, Juskowiak B, Takenaka S. Angewandte Chemie-International Edition. 2005;44:5067–5070. doi: 10.1002/anie.200501506. [DOI] [PubMed] [Google Scholar]
- 200.Tsien RY. Annu Rev Biochem. 1998;67:509–544. doi: 10.1146/annurev.biochem.67.1.509. [DOI] [PubMed] [Google Scholar]
- 201.Urbanek MO, Galka-Marciniak P, Olejniczak M, Krzyzosiak WJ. RNA Biol. 2014;11:1083–1095. doi: 10.4161/rna.35506. [DOI] [PMC free article] [PubMed] [Google Scholar]
- 202.Rath AK, Rentmeister A. Curr Opin Biotechnol. 2015;31C:42–49. doi: 10.1016/j.copbio.2014.07.012. [DOI] [PubMed] [Google Scholar]
- 203.Beach DL, Salmon ED, Bloom K. Curr Biol. 1999;9:569–578. doi: 10.1016/s0960-9822(99)80260-7. [DOI] [PubMed] [Google Scholar]
- 204.Larson DR, Zenklusen D, Wu B, Chao JA, Singer RH. Science. 2011;332:475–478. doi: 10.1126/science.1202142. [DOI] [PMC free article] [PubMed] [Google Scholar]
- 205.Daigle N, Ellenberg J. Nat Methods. 2007;4:633–636. doi: 10.1038/nmeth1065. [DOI] [PubMed] [Google Scholar]
- 206.Schonberger J, Hammes UZ, Dresselhaus T. Plant Journal. 2012;71:173–181. doi: 10.1111/j.1365-313X.2012.04923.x. [DOI] [PubMed] [Google Scholar]
- 207.Chung S, Takizawa PA. J Cell Biol. 2010;189:755–767. doi: 10.1083/jcb.200912011. [DOI] [PMC free article] [PubMed] [Google Scholar]
- 208.Chen J, Nikolaitchik O, Singh J, Wright A, Bencsics CE, Coffin JM, Ni N, Lockett S, Pathak VK, Hu WS. Proc Natl Acad Sci U S A. 2009;106:13535–13540. doi: 10.1073/pnas.0906822106. [DOI] [PMC free article] [PubMed] [Google Scholar]
- 209.Ni N, Nikolaitchik OA, Dilley KA, Chen J, Galli A, Fu W, Prasad VV, Ptak RG, Pathak VK, Hu WS. J Virol. 2011;85:7603–7612. doi: 10.1128/JVI.00562-11. [DOI] [PMC free article] [PubMed] [Google Scholar]
- 210.Yiu HW, Demidov VV, Toran P, Cantor CR, NE B. Pharmaceuticals. 2011;4:494–508. [Google Scholar]
- 211.Yin J, Zhu D, Zhang Z, Wang W, Fan J, Men D, Deng J, Wei H, Zhang XE, Cui Z. PLoS One. 2013;8:e80851. doi: 10.1371/journal.pone.0080851. [DOI] [PMC free article] [PubMed] [Google Scholar]
- 212.Kerppola TK. Methods Cell Biol. 2008;85:431–470. doi: 10.1016/S0091-679X(08)85019-4. [DOI] [PMC free article] [PubMed] [Google Scholar]
- 213.Delebecque CJ, Lindner AB, Silver PA, Aldaye FA. Science. 2011;333:470–474. doi: 10.1126/science.1206938. [DOI] [PubMed] [Google Scholar]
- 214.Wu B, Chen J, Singer RH. Sci Rep. 2014;4:3615. doi: 10.1038/srep03615. [DOI] [PMC free article] [PubMed] [Google Scholar]
- 215.Valencia-Burton M, McCullough RM, Cantor CR, Broude NE. Nature Methods. 2007;4:421–427. doi: 10.1038/nmeth1023. [DOI] [PubMed] [Google Scholar]
- 216.Strack RL, Disney MD, Jaffrey SR. Nat Methods. 2013;10:1219–1224. doi: 10.1038/nmeth.2701. [DOI] [PMC free article] [PubMed] [Google Scholar]
- 217.Shin I, Ray J, Gupta V, Ilgu M, Beasley J, Bendickson L, Mehanovic S, Kraus GA, Nilsen-Hamilton M. Nucleic Acids Res. 2014;42:e90. doi: 10.1093/nar/gku297. [DOI] [PMC free article] [PubMed] [Google Scholar]
- 218.Lux J, Pena EJ, Bolze F, Heinlein M, Nicoud JF. Chembiochem. 2012;13:1206–1213. doi: 10.1002/cbic.201100747. [DOI] [PubMed] [Google Scholar]
- 219.Sunbul M, Jaschke A. Angew Chem Int Ed Engl. 2013;52:13401–13404. doi: 10.1002/anie.201306622. [DOI] [PubMed] [Google Scholar]
- 220.Kraus GA, Jeon I, Nilsen-Hamilton M, Awad AM, Banerjee J, Parvin B. Molecules. 2008;13:986–994. doi: 10.3390/molecules13040986. [DOI] [PMC free article] [PubMed] [Google Scholar]
- 221.Sparano BA, Koide K. Journal of the American Chemical Society. 2005;127:14954–14955. doi: 10.1021/ja0530319. [DOI] [PubMed] [Google Scholar]
- 222.Famulok M, Mayer G. Chem Biol. 2014;21:1055–1058. doi: 10.1016/j.chembiol.2014.08.003. [DOI] [PubMed] [Google Scholar]
- 223.Mannironi C, Scerch C, Fruscoloni P, Tocchini-Valentini GP. Rna-a Publication of the Rna Society. 2000;6:520–527. doi: 10.1017/s1355838200991763. [DOI] [PMC free article] [PubMed] [Google Scholar]
Associated Data
This section collects any data citations, data availability statements, or supplementary materials included in this article.