Abstract
Objectives:
This study evaluated the effect of phantom positioning and the configuration of phantom inserts on the measurement of contrast-to-noise ratio (CNR) in dental CBCT. The work aimed to make pragmatic suggestions for the remedial tolerances for CNR measurements in the routine quality control (QC) of a three-dimensional Accuitomo 170 dental CBCT system (J Morita, Kyoto, Japan).
Methods:
Images of the SEDENTEXCT (safety and efficacy of a new and emerging dental X-ray modality) IQ (image quality) dental CBCT phantom (Leeds Test Objects Ltd, Boroughbridge, UK) were acquired and measurements of CNR were obtained in three configurations of inserts and in six phantom orientations for one of the configurations. Five consecutive images were acquired in each case, to assess the reproducibility of measurements.
Results:
Reproducibility of measurements ranged from 1.8% to 4.6%. For the CNR measurements in the three phantom configurations, the ratio of the measured CNR to the minimum value was 2.1 ± 0.2 times the minimum value for Delrin® (DuPont UK Ltd, Stevenage, UK). For aluminium, there was no significant variation between configurations and for the other three materials, the ratio ranged from 20% to 50%. Significant variations in CNR with phantom position were observed, with differences between the maximum and minimum values ranging from 10% to 60%. Absolute differences in CNR from the minimum value ranged from <0.1 to 2.1 with phantom configuration and from 1.2 to 4.5 with phantom position.
Conclusions:
The effects of phantom configuration and positioning on CNR measurements for dental CBCT QC were investigated and possible remedial tolerances suggested.
Keywords: CBCT, quality control
Introduction
CBCT is an imaging modality which is gaining prominence in dental and maxillofacial applications. CBCT is capable of providing a three-dimensional (3D) representation of the maxillofacial region with high isotropic spatial resolution, high geometric accuracy and effective doses significantly lower than those associated with multislice CT.1 It therefore offers great potential for improving accuracy in dental and maxillofacial applications, in both diagnosis and implant planning.
The Health Protection Agency (HPA), now Public Health England, have provided quality assurance recommendations for dental CBCT,2 setting out the recommended tests and action levels. The recommended suspension levels have been adopted in the European Commission's (EC's) criteria for acceptability of medical radiological equipment,3 which provides a compendium of criteria that medical radiological equipment should be able to pass. A quality control (QC) programme for dental CBCT equipment is also described in EC report 172.4
Contrast-to-noise ratio (CNR) is a quantitative image quality parameter which has been extensively evaluated in the literature.5–7 Although recognized as an important parameter in the evaluation of dental CBCT image quality, it is not listed in the HPA or EC guidance as a recommended test; however, action levels for mean pixel values (MPVs) in different materials and for image noise are specified, from which corresponding action levels for CNR can be inferred.
CBCT differs from multislice CT in the major respect that scattered radiation in the entire imaging volume must be accounted for in the reconstruction. This results in effects such as the modification of pixel values, which becomes more pronounced as the scatter to primary ratio increases,8 and pixel value gradients where the distribution of material outside the imaged field is asymmetric, referred to by Bryant et al as the exomass effect.9 The distribution of scattered radiation is heterogeneous, meaning that pixel values are highly sensitive to position. As a consequence of the above effects, the same material is expected to exhibit a different CNR, depending on factors such as the field of view (FOV) and position in the imaging volume. In view of this dependence, it is still to be determined whether the HPA- and EC-specified action levels are appropriate (indicative of real changes, when the stability of the measurement itself is accounted for).
The aim of this study was to evaluate the effect of phantom positioning and the configuration of phantom inserts on CNR for a specific dental CBCT system, with a view to making pragmatic suggestions for remedial tolerances for CNR measurement in the routine QC of this system.
Methods and materials
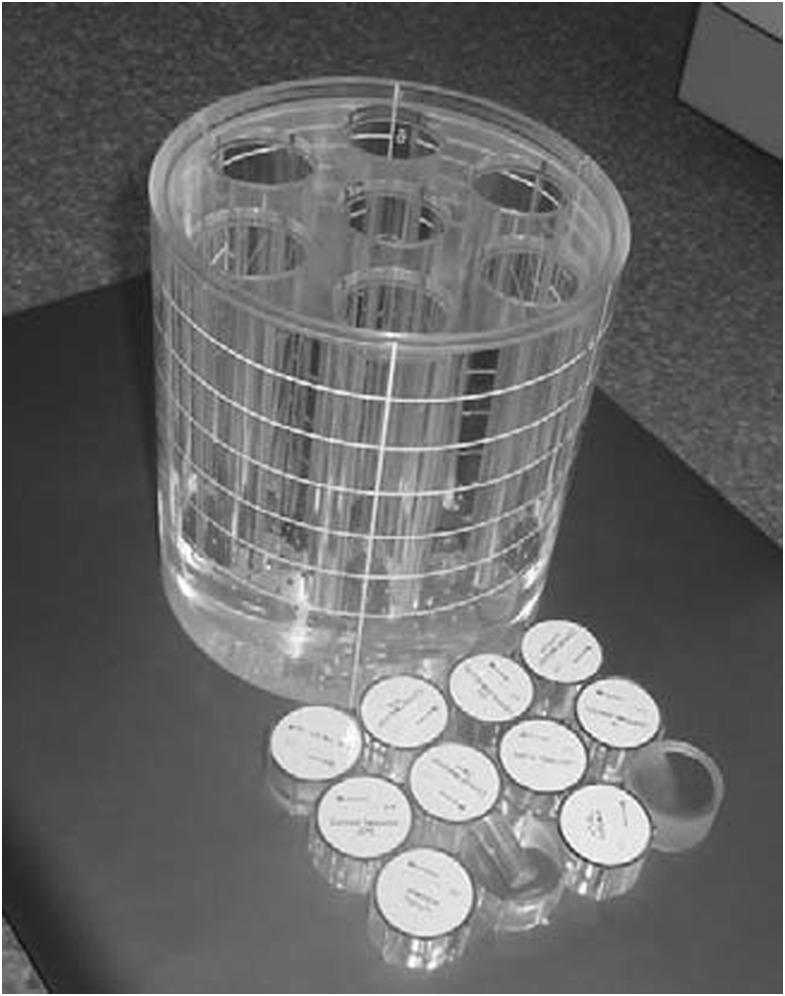
The study was performed using the 3D Accuitomo 170 CBCT unit (J Morita, Kyoto, Japan). The phantom used for the study was the SEDENTEXCT (safety and efficacy of a new and emerging dental X-ray modality) IQ (image quality) dental CBCT phantom, designed by Leeds Test Objects Ltd (Boroughbridge, UK)10 within the scope of the SEDENTEXCT Project.11 It comprises a cylindrical polymethylmethacrylate (PMMA) housing, 160 mm in diameter and 162 mm in height, with seven cylindrical holes positioned at the centre and vertices of a regular hexagon, as shown in Figure 1. Each column is divided into six rows, numbered 1–6 from bottom to top, in which inserts are stacked vertically. The holes are filled with image quality inserts interspersed with blank PMMA inserts; the inserts used in this investigation are described in Table 1. The positions of the inserts are interchangeable with respect to one another, with no constraints; two “titanium artefact” inserts are also incorporated, intended to simulate high-density metallic objects in the mouth.
Figure 1.
SEDENTEXCT (safety and efficacy of a new and emerging dental X-ray modality) IQ (image quality) phantom housing and inserts.
Table 1.
Description of the design of inserts used to assess image quality parameters
| Image quality parameter | Insert design |
|---|---|
| Mean pixel value | Pixel value insert comprising five discs, 25 mm in diameter and 3-mm thick, of aluminium, PTFE, Delrin®, LDPE and air, stacked vertically and encased in PMMA |
| Contrast-to-noise ratio | Five inserts of aluminium, PTFE, delrin, LDPE and air. Each comprise five rods of the relevant material, 17 mm in length, of increasing diameter from 1 to 5 mm, positioned at regular intervals at a distance of 8.5 mm from the centre, encased in PMMA |
| Noise and uniformity | Phantom section filled with PMMA inserts |
| Titanium artefacts | Three equally spaced titanium rods of 5.2-mm diameter and 17-mm length |
LDPE, low-density polyethylene; PMMA, polymethylmethacrylate; PTFE, polytetrafluoroethylene.
Leeds Test Objects provide instructions on how the inserts should be distributed within the phantom housing (personal communication); the recommended configuration is described in Table 2. In this configuration, each image quality insert is placed in a peripheral hole, to confer clinical relevance by simulating the composition of the head.
Table 2.
Insert positions within the SEDENTEXCT (safety and efficacy of a new and emerging dental X-ray modality) IQ (image quality) dental CBCT phantom
| Insert | Phantom level |
|---|---|
| Noise and uniformity (blank PMMA inserts) | 5 |
| Pixel value | 4 |
| Contrast-to-noise ratio (all materials) | 4 |
| Spatial resolution xy | 3 |
| Point spread function | 3 |
| Titanium artefacts | 1 |
PMMA, polymethylmethacrylate.
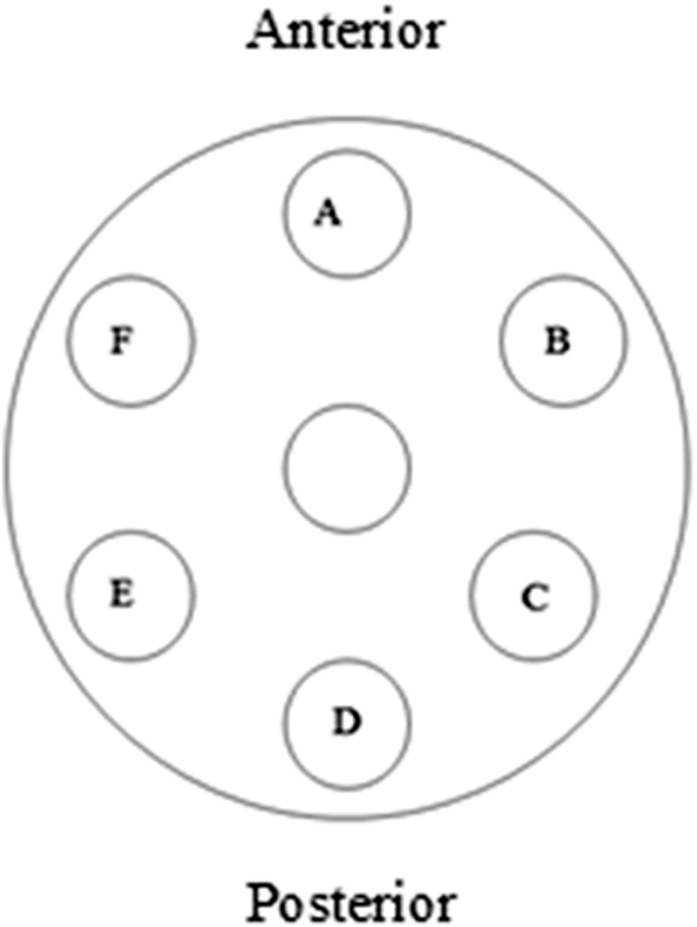
In this study, images were acquired in one of three arrangements; the first with a single image quality insert positioned at the periphery and the remainder of the phantom filled with PMMA inserts and the second and third with all contrast-to-noise inserts and the pixel intensity insert positioned in two different configurations around the periphery. Peripheral positions are lettered from Position A at the anterior, moving in clockwise direction as viewed from the top of the phantom, through to Position F; this is illustrated in Figure 2. The three arrangements are termed “Blank”, “Complete 1” and “Complete 2”, respectively, and are summarized in Table 3. Five further images were acquired with the phantom in the Complete 1 configuration, but rotated so that each CNR insert in turn was positioned at the phantom anterior.
Figure 2.
Lettering of insert positions around the phantom periphery.
Table 3.
Arrangement of inserts in Row 4 of the phantom, for the three configurations
| Position | Blank | Complete 1 | Complete 2 |
|---|---|---|---|
| A | CNRall | CNRdelrin | CNRair |
| B | PMMA | CNRair | CNRdelrin |
| C | PMMA | CNRPTFE | CNRLDPE |
| D | PMMA | MPV | MPV |
| E | PMMA | CNRLDPE | CNRPTFE |
| F | PMMA | CNRaluminium | CNRaluminium |
CNR, contrast-to-noise ratio; LDPE, low-density polyethylene; MPV, mean pixel value; PMMA, polymethylmethacrylate; PTFE, polytetrafluoroethylene.
Prior to image acquisition, the phantom was mounted on a metal plate, secured on top of a tripod. The phantom was aligned with the isocentre using axial and sagittal lasers. Images were acquired at 90 kV, 3 mA, 17.5-s exposure time and FOV 14 × 10 cm (diameter × height).
The CNR was evaluated using the ImageJ software (National Institutes of Health, Bethesda, MD). A circular region of interest (ROI) was delineated in the largest detail of the CNR insert and a second ROI in the PMMA background. MPV and standard deviations were obtained for each ROI, for 10 transaxial slices, with automated positioning of the ROIs to be at the same position in each slice. The CNR was calculated in accordance with Equation (1) below and was averaged over the 10 slices.
| (1) |
where MPVm and MPVb are the mean pixel values in the material and background, respectively, and σm and σb are the corresponding standard deviations.
CNRs were calculated for each material, for each of the images acquired. In order to assess the repeatability of measurements, measurements were obtained on five consecutive images acquired under the same irradiation conditions, without moving the phantom.
Results
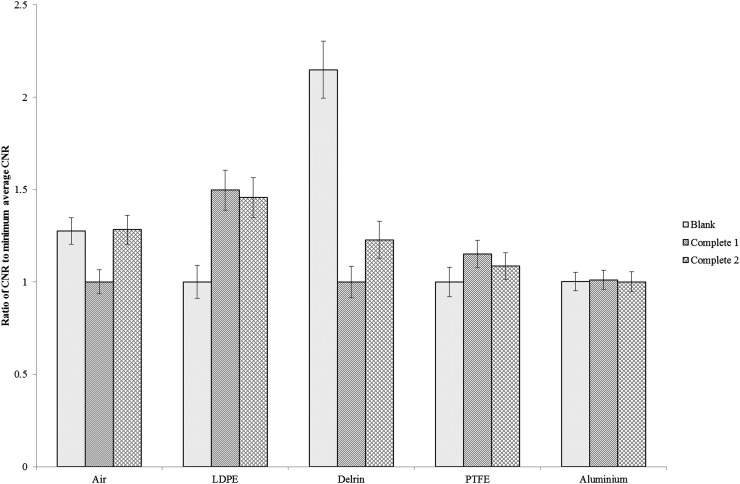
The repeatability of CNR measurements was 1.8% for air, 2.5% for aluminium, 3.4% for polytetrafluoroethylene (PTFE) and 4.6% for low-density polyethylene (LDPE). In Figures 3–6, the error bars represent twice the standard error on the mean (95% confidence interval). Figure 3 shows, for each material, the ratio between the average CNR in the specified configuration and the CNR in the configuration which gives the minimum average value. It can be seen that the effect of configuration is variable, with the CNR for Delrin® (DuPont UK Ltd, Stevenage, UK) in the Blank configuration being 2.1 ± 0.2 times the minimum value (in the Complete 1 configuration), while for aluminium, there is no significant difference in the measured CNRs between the three setups. The corresponding ratio for LDPE is 1.5 ± 0.1, 1.3 ± 0.1 for air and 1.2 ± 0.1 for PTFE.
Figure 3.
Ratio of the contrast-to-noise ratio (CNR) in a specific configuration and the minimum average CNR. The error bars represent twice the standard error on the mean. LDPE, low-density polyethylene; PTFE, polytetrafluoroethylene.
Figure 6.
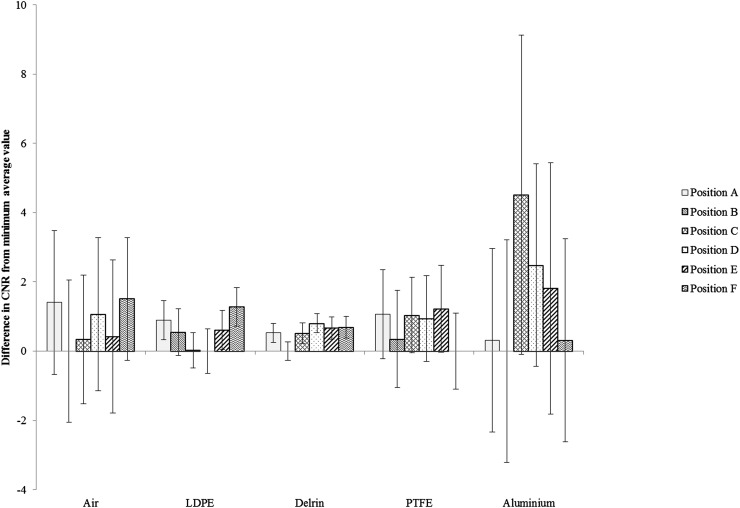
Difference between the contrast-to-noise ratio (CNR) and the minimum average CNR for each insert at each position (Complete 1 setup). The error bars represent twice the standard error on the mean. LDPE, low-density polyethylene; PTFE, polytetrafluoroethylene.
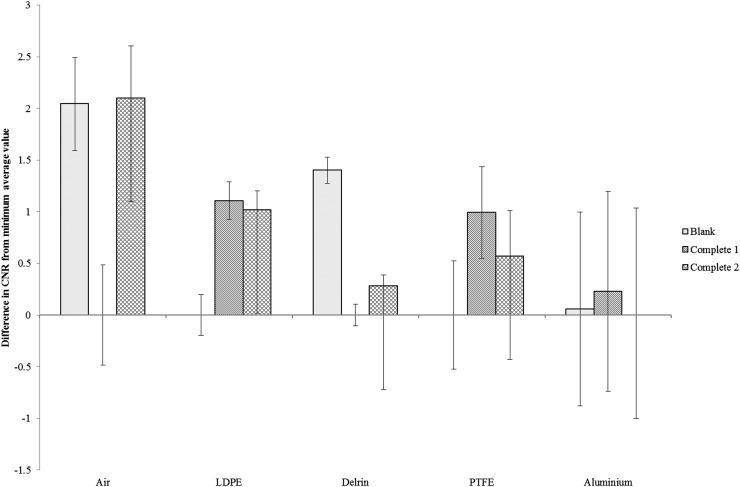
Figure 4 shows the same data, but presented in terms of the CNR in one configuration minus the minimum average CNR for each material. The absolute difference in CNR ranges from 0.06 ± 0.94 for aluminium to 2.1 ± 0.5 for air.
Figure 4.
Difference between the contrast-to-noise ratio (CNR) in a specific configuration and the minimum average CNR. The error bars represent twice the standard error on the mean. LDPE, low-density polyethylene; PTFE, polytetrafluoroethylene.
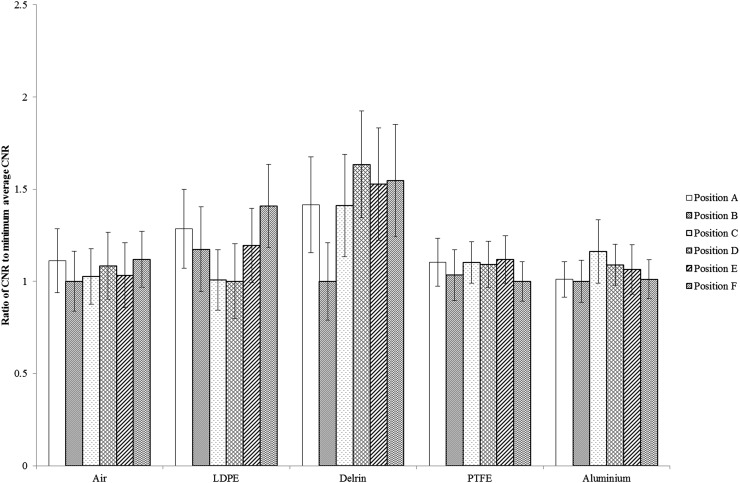
Figure 5 shows, for each material, the ratio between the average CNR at each position and the CNR at the position which gives the minimum average value. Again, a wide variation in the measured CNR with position is observed in some materials, with a ratio of maximum-to-minimum CNR for Delrin of 1.6 ± 0.3 and 1.4 ± 0.2 for LDPE. Variation was observed to be smaller in the other three materials, with a ratio of maximum-to-minimum CNR of 1.2 ± 0.2 for aluminium, 1.1 ± 0.1 for PTFE and 1.1 ± 0.2 for air.
Figure 5.
Ratio of the contrast-to-noise ratio (CNR) and the minimum average CNR for each insert at each position (Complete 1 setup). The error bars represent twice the standard error on the mean. LDPE, low-density polyethylene; PTFE, polytetrafluoroethylene.
Figure 6 shows the difference between CNR and the minimum measured CNR for each insert at each position, with the phantom in the Complete 1 setup. The maximum differences range from 4.5 ± 4.6 (for aluminium at Position F) to 0.8 ± 0.3 (for Delrin at Position D). The corresponding values for air, LDPE and PTFE are 1.5 ± 1.8, 1.3 ± 0.6 and 1.2 ± 1.2, respectively.
Discussion
An obvious limitation of this study is that it has been performed only on a single CBCT unit, under a single set of exposure parameters. It is not necessarily generalizable to other dental CBCT units or different sets of irradiation conditions with the same unit. However, it does serve to illustrate some of the caveats inherent in measuring CNR in routine dental CBCT QC and provides a possible methodology for the setting of remedial levels.
Repeatability of measurements ranged from 1.8% to 4.6%, the most reproducible measurements being obtained for those materials exhibiting the greatest attenuation from their backgrounds. The data were presented in terms of both the ratio and the difference between the average CNR and the minimum average CNR. Analysis of ratio demonstrates the fact that materials in the middle of the density range (Delrin and LDPE), where the standard deviation is similar to or greater than the difference between the MPV of the material and the background, exhibit greater variability in CNR In addition, analyzing the ratio facilitates a direct comparison with current remedial levels, which are expressed in terms of percentage differences. Although this is the typical way in which tolerances are set, it does not seem appropriate in this instance, as the percentage difference can be so large (up to 110% with configuration and up to 60% with position). Taking the absolute difference between the maximum and minimum average CNR yields values which are of the same order of magnitude regardless of the material and therefore lend themselves more to the setting of remedial levels.
The minimum average CNR was chosen as a reference not because it had any significance in terms of clinical image quality, but rather to demonstrate the extent to which CNR values are influenced by adjacent inserts and position in the FOV.
Considering the CNR measurements in the three phantom configurations, the ratio of the average CNR and the minimum average value was greatest for Delrin, giving a maximum CNR of 2.1 ± 0.2 times the minimum value. For aluminium, there was no significant difference between configurations, while the ratio between the maximum and minimum values ranged from 1.2 ± 0.1 to 1.5 ± 0.1 for the other three materials. The largest variations were found for materials in the middle of the density range (Delrin and LDPE); this has been noted previously by Pauwels et al6 and is thought to be owing to the fact that in this range, the greater predominance of noise yields more diverse pixel values. The HPA and EC guidance give a remedial level of the baseline value ±±10% for measurements of both MPV and noise. Combining the remedial levels in accordance with Equation (1) and assuming a CNR of 10 would give, as a rough approximation, a corresponding remedial level ±14% for CNR. This means that for all materials other than aluminium, the variation which arises as a result of different phantom configurations greatly exceeds this approximate remedial level.
With the phantom in the Complete 1 configuration, a considerable variation in CNR with position was observed for some materials, with a ratio between the maximum and minimum values of 1.6 ± 0.3 for Delrin, 1.4 ± 0.2 for LDPE and 1.2 ± 0.2 for aluminium. Air and LDPE exhibited ratios of 1.1 ± 0.2 and 1.1 ± 0.1, respectively. Again, this suggests that CNR measurements for Delrin, LDPE and aluminium could be well outside the remedial tolerances with no change in equipment performance, by virtue of the orientation of the phantom in the FOV; this is due to the fact that the inhomogeneous scatter distribution means that MPVs (and hence CNR) are highly sensitive to position. It should be noted that the maximum and minimum values of CNR are encountered in different positions for different materials, suggesting that the CNR is influenced by a complex interplay of field uniformity (primarily governed by the distribution of scattered radiation in the imaging volume) and the influence of adjacent inserts. Taking into consideration the variation in CNR with phantom configuration and position, and the size of the errors involved, more appropriate remedial tolerances could be set in terms of absolute difference from the baseline value. A possible set derived from combining the maximum differences and associated errors is given in Table 4. These levels are intended to indicate that a real change in image quality has occurred since the baseline value was established, accounting for the errors inherent in the measurement. It should be noted that these levels are applicable only to the 3D Accuitomo 170 CBCT unit, under the irradiation conditions studied here. However, this work does give a possible methodology for the determination of remedial tolerances, which could be extended to cover other systems and sets of exposure parameters.
Table 4.
Suggested remedial levels for contrast-to-noise ratio (CNR) measurements in dental CBCT quality control
| Material | Maximum difference in CNR owing to configuration | Maximum difference in CNR owing to position | Sum of maximum differences | Suggested remedial level |
|---|---|---|---|---|
| Air | 2.1 ± 0.5 | 1.4 ± 2.1 | 3.5 ± 2.1 | Baseline ± 5 |
| LDPE | 1.1 ± 0.2 | 1.3 ± 0.6 | 2.4 ± 0.6 | Baseline ± 3 |
| Delrin® | 1.4 ± 0.1 | 0.8 ± 0.3 | 2.2 ± 0.3 | Baseline ± 3 |
| PTFE | 1.0 ± 0.4 | 1.2 ± 1.2 | 2.2 ± 1.3 | Baseline ± 3 |
| Aluminium | 0.2 ± 1.0 | 4.5 ± 4.6 | 4.7 ± 4.7 | Baseline ± 10 |
LDPE, low-density polyethylene; PTFE, polytetrafluoroethylene.
In conclusion, the effects of phantom configuration and positioning on CNR measurements for dental CBCT QC were investigated for the 3D Accuitomo 170 dental CBCT unit, and possible remedial tolerances were suggested on this basis.
References
- 1.Scarfe WC, Farman AG. What is cone beam CT and how does it work? Dent Clin North Am 2008; 52: 707–30. doi: http://dx.doi.org/10.1016/j.cden.2008.05.005 [DOI] [PubMed] [Google Scholar]
- 2.Health Protection Agency. Guidance on the safe use of dental cone beam CT (computed tomography) equipment. HPA-CRCE-10. Dicot, UK: Health Protection Agency; 2010. [Google Scholar]
- 3.European Commission. Criteria for acceptability of medical radiological equipment used in diagnostic radiology, nuclear medicine and radiotherapy, radiation protection 162. Luxembourg: Office for Official Publications of the European Communities; 2012. [Google Scholar]
- 4.European Commission. Cone beam CT for dental and maxillofacial radiology, evidence-based guidelines, radiation protection 172. Luxembourg: Office for Official Publications of the European Communities; 2012. [Google Scholar]
- 5.Pauwels R, Stamatakis H, Manousaridis G, Walker A, Michielsen K, Bosmans H, et al. Development and applicability of a quality control phantom for dental cone-beam CT. J Appl Clin Med Phys 2011; 12: 3478. doi: http://dx.doi.org/10.1120/jacmp.v12i4.3478 [DOI] [PMC free article] [PubMed] [Google Scholar]
- 6.Pauwels R, Silkosessak O, Jacobs R, Bogaerts R, Bosmans H, Panmekiate S. A pragmatic approach to determine the optimal kVp in cone beam CT: balancing contrast-to-noise ratio and radiation dose. Dentomaxillofac Radiol 2014; 43: 20140059. doi: http://dx.doi.org/10.1259/dmfr.20140059 [DOI] [PMC free article] [PubMed] [Google Scholar]
- 7.Suomalainen A, Kiljunen T, Käser Y, Peltola J, Kortesniemi M. Dosimetry and image quality of four dental cone beam computed tomography scanners compared with multislice computed tomography scanners. Dentomaxillofac Radiol 2009; 38: 367–78. doi: http://dx.doi.org/10.1259/dmfr/15779208 [DOI] [PubMed] [Google Scholar]
- 8.Siewerdsen JH, Jaffray DA. Cone-beam computed tomography with a flat-panel imager: Magnitude and effects of x-ray scatter. Med Phys 2001; 28: 220–31. doi: http://dx.doi.org/10.1118/1.1339879 [DOI] [PubMed] [Google Scholar]
- 9.Bryant JA, Drage NA, Richmond S. Study of the scan uniformity from an i-CAT cone-beam computed tomography dental imaging system. Dentomaxillofac Radiol 2008; 37: 365–74. [DOI] [PubMed] [Google Scholar]
- 10.Leedstestobjects.com. Boroughbridge: Leeds Test Objects Ltd; c2016 [Updated 29 March 2016; cited 1 April 2016]. Available from: http://www.leedstestobjects.com/
- 11.Sedentexct.eu. Manchester: SEDENTEXCT Project; c2016. [Updates 7 March 2016; cited 1 April 2016]. Available from http://www.sedentexct.eu/


