

Abstract
Graphene and graphene oxide receive much attention these years, because they add attractive properties to a wide range of applications and products. Several studies have shown toxicological effects of other carbon‐based nanomaterials such as carbon black nanoparticles and carbon nanotubes in vitro and in vivo. Here, we report in‐depth physicochemical characterization of three commercial graphene materials, one graphene oxide (GO) and two reduced graphene oxides (rGO) and assess cytotoxicity and genotoxicity in the murine lung epithelial cell line FE1. The studied GO and rGO mainly consisted of 2–3 graphene layers with lateral sizes of 1–2 µm. GO had almost equimolar content of C, O, and H while the two rGO materials had lower contents of oxygen with C/O and C/H ratios of 8 and 12.8, respectively. All materials had low levels of endotoxin and low levels of inorganic impurities, which were mainly sulphur, manganese, and silicon. GO generated more ROS than the two rGO materials, but none of the graphene materials influenced cytotoxicity in terms of cell viability and cell proliferation after 24 hr. Furthermore, no genotoxicity was observed using the alkaline comet assay following 3 or 24 hr of exposure. We demonstrate that chemically pure, few‐layered GO and rGO with comparable lateral size (> 1 µm) do not induce significant cytotoxicity or genotoxicity in FE1 cells at relatively high doses (5–200 µg/ml). Environ. Mol. Mutagen. 57:469–482, 2016. © 2016 The Authors. Environmental and Molecular Mutagenesis Published by Wiley Periodicals, Inc.
Keywords: comet assay, elemental analysis, reactive oxygen species, electron microscopy
INTRODUCTION
Graphene constitutes a new group of carbon‐based nanomaterials defined as a high‐aspect ratio material due to the single‐ or few layered carbon structured 2‐dimensional layers arranged in a hexagonal lattice [Bianco et al., 2013]. The lateral size of individual graphene layers spans from nanoscale to microscale [Wick et al., 2014].
Production of 2‐dimensional graphene carbon materials is currently increasing and more manufacturers produce graphene at industrial‐scale [Ren and Cheng, 2014]. One atom thickness, high conductivity, and transparency are some of the properties that make the 2‐dimensional carbon material graphene attractive in future applications, as component in electronics or in medical devices.
Graphene is a carbon‐based nanomaterial and chemically similar to carbon nanotubes and carbon black nanoparticles, but with very different morphology. Graphene‐based materials are nanosized in one dimension, whereas carbon nanotubes are nanosized in two and carbon black nanoparticles are nanosized in three dimensions. Graphene is usually manufactured by chemical vapor deposition [Li et al., 2009; Reina et al., 2009] or oxidation and exfoliation from graphite [Park and Ruoff, 2009]. In particular, production by graphite exfoliation has increased over the last few years [Ren and Cheng, 2014]. The graphene derivatives graphene oxide (GO) and reduced graphene oxide (rGO) are prepared from oxidation of graphite (GO) followed by, for example, N chemical reduction (rGO). GO is categorized as an insulator due to altered graphitic structure and up to 50% oxygen content [Bianco et al., 2013]. Electric conductivity can partially be restored during reduction to rGO resulting in significantly lowered oxygen content although a complete reduction has not yet been achieved [Park and Ruoff, 2009; Wick et al., 2014].
Graphene [Ambrosi and Pumera, 2014] and carbon black nanoparticles [Jacobsen et al., 2008b; Hogsberg et al., 2013] are usually chemically pure and primarily consist primarily of C, O, and H with low levels of metal impurities whereas carbon nanotubes often have varying levels of inorganic impurities [Jackson et al., 2015]. Due to attractive physicochemical properties of GO for biomedical applications, GO toxicity has been subject to multiple in vitro toxicity studies. Currently, most of the studies have addressed cytotoxicity of relatively small GO layers with lateral sizes below 0.5 µm [Chang et al., 2011; Ali‐Boucetta et al., 2013; Lammel et al., 2013; Wang et al., 2013; Wang et al., 2014; Sydlik et al., 2015]. The potential genotoxicity of GO has only been assessed in a few studies [Liu et al., 2013; Wang et al., 2013; Chatterjee et al., 2014].
We have previously studied cytotoxicity and genotoxicity in vitro of both carbon black nanoparticles and 15 different carbon nanotubes in murine lung epithelial cells (FE1) [Jacobsen et al., 2007; Jacobsen et al., 2008b; Jacobsen et al., 2011; Poulsen et al., 2013; Jackson et al., 2015]. The advantage of using this cell line is that it contains 80 copies of the λgt10lacZ transgene, thus allowing for determination of the mutation frequency based on a positive selection assay for a defective functional cII repressor [Jacobsen et al., 2007]. We have previously reported that carbon black was not cytotoxic, but generated reactive oxygen species (ROS) in cellular and acellular assays [Jacobsen et al., 2008b], induced DNA strand breaks and FPG‐sensitive sites in FE1 cells [Jacobsen et al., 2007]. Further, carbon black increased the mutant frequency to a similar level as NIST1650 diesel exhaust particles [Jacobsen et al., 2008a]. The mutation spectrum was consistent with being caused by ROS [Jacobsen et al., 2011]. We recently assessed cytotoxicity and genotoxicity of 15 different commercial multiwalled carbon nanotubes (MWCNT) with varying physicochemical properties in FE1 cells [Jackson et al., 2015]. None of the studied MWCNT induced cytotoxicity and only one MWCNT induced DNA strand breaks.
In this study, we compare the cellular response of GO and rGO to the cellular responses of MWCNTs and carbon black using FE1 cells. We conducted an in‐depth physicochemical characterization of commercially available GO and rGO and assessed cytotoxicity and genotoxicity in the murine lung epithelial cell line FE1.
MATERIALS AND METHODS
Materials
Graphene materials were manufactured and supplied by Graphenea (San Sebastian, Spain). Materials included one graphene oxide in aqueous suspension (GO) and two reduced graphene oxide rGO‐small (rGO‐s) and rGO‐large (GO‐l) in powder form. GO was synthesized by chemical exfoliation of graphite using a modified Hummer's method. Synthetic graphite was dispersed in concentrated sulphuric acid in an ice bath under magnetic stirring and potassium permanganate was slowly added to avoid overheating. The reaction was then heated at 35ºC for 1 hr. The reaction is exothermic and to stop the reaction, water and later hydrogen peroxide was added and the reaction solution was transferred to an ice bath. The final solution was cleaned thoroughly with water followed by sonication to obtain GO. GO was chemically reduced to obtain rGO. To remove non‐exfoliated graphite, the final solution of GO was sonicated (60 Hz) for 1 hr followed by centrifugation for 10 min (10,000 rpm). Ascorbate, an effective reducing and environmental friendly agent, was added and the solution was heated to 95ºC. To obtain the rGO in powder form, the solution was then washed with methanol, filtered and air‐dried at 150ºC for 48 hr in a vacuum oven.
Carbon black Printex90, a gift from Degussa‐Hüls (Frankfurt, Germany) was included in this study as a reference material.
Material—Characterization
Raman Spectroscopy
rGO materials were dispersed in isopropanol and drop casted on a SiO2/Si substrate (100 nm SiO2 to increase the optical contrast and Raman signal). GO was supplied in aqueous suspension and therefore, an amount of liquid was deposited on the substrate. Raman analysis was performed at room temperature using a custom‐built confocal microscope operating with a 633 nm laser for excitation. The laser power on the sample was kept low (< 100 µW/µm2) to avoid heating effects. For comparison between the various materials, the spectra were normalized to the G peak intensity at ∼1,590 cm−1.
Transmission Electron Microscopy
Transmission electron microscopy (TEM) was performed at the French Alternative Energies and Atomic Energy Commission, CEA (Grenoble, France). Before TEM analysis, GO and rGO were dispersed in isopropanol, and ultra‐sonicated for 30 sec. A small droplet was put on top of a Lacey carbon on copper TEM grid with Lacey carbon and mounted in OSIRIS/Titan ultimate (FEI, Eindhoven, The Netherlands) operated at 80 kV.
Scanning (Transmission) Electron Microscopy
Scanning (transmission) electron microscopy (SEM and STEM) were performed at Danish Technological Institute (Taastrup, Denmark). Samples were dispersed in ethanol followed by transfer to a TEM grid and analyzed in SEM (Carl Zeiss XB‐1540, Zeiss, Ober‐Cochem, Germany). SEM images were acquired at 30 kV with a secondary electron detector in addition to a STEM detector.
Specific Surface Area
Analysis of the specific surface area was performed at Quantachrome GmbH & Co. KG (Odelzhausen, Germany) by multipoint Brunauer–Emmet–Teller (BET) analysis as previously described [Jackson et al., 2015]. Specific surface area by BET analysis was possible for rGO materials but not for the aqueous GO.
Combustion Elemental Analysis
The total content of carbon (C), hydrogen (H), nitrogen (N), and oxygen (O) was analyzed by DB Lab A/S (Odense, Denmark). Five mg of GO (following storage in freezer for 5–6 hr at −70ºC and freeze‐drying overnight) and rGO were weighed into tin capsules and burned at 950ºC. Excess O2 was removed from the formed gasses (CO2, H2O, and N2). Graphene material of 5 mg for oxygen determination were weighed into silver capsules and burned at 1,060°C resulting in conversion of oxygen to CO. The analyses were performed on a FLASH 2000 Organic elemental Analyzer (Thermo Scientific) and the final gasses were analyzed by gas chromatography. A detailed description of the procedure for preparation and combustion analysis is presented in [Jackson et al., 2015]. Assuming that all measured oxygen was present as hydroxyl (OH) or carboxyl groups (COOH), respectively, a calculated molar content (mmol/g) and surface density (mmol/m2) of functionalization was calculated by division with the BET surface area.
Wavelength Dispersive X‐Ray Fluorescence
The graphene samples were investigated with wavelength dispersive X‐ray fluorescence (WDXRF) analysis to derive a relative chemical abundance of the inorganic impurities. rGO materials were handled and treated as loose powders. Approximately 0.3 g of each was weighed into a 40 mm‐XRF‐sample cup with Mylar 0.3 µm foil (Fluxana, Tyskland). Cotton vat of 0.3 g was gently placed on top of the loose powder, to hold it in place, and a plastic lid for closing the cup. Aqueous GO was poured in the same type of sampling cup to a filling height of 10 mm. The prepared samples were analyzed using a Bruker Tiger S8 with a scan over all elements from Na to U with appropriate tube conditions (60kV/67mA; 50kV/81mA; 30kV/135mA) for the regarded lines, respectively. Measurements were automatically corrected for contribution from the foil, vat and sampling cup. All samples were measured 3 times. C was calculated as matrix element in a post processing step. Results are given in Table 2 as weight percent of oxides for each element measured. Statistical error and lower limit of detection for each value, respectively, are given in Supporting Information Table SI.
Table 2.
Chemical Composition of the Studied GO, rGO, and Printex90, Subdivided in Organic and Inorganic Elements
| GO | rGO‐s | rGO‐l | Printex90a | |
|---|---|---|---|---|
| Organic elemental composition | ||||
| C (wt%) | 43.3 ± 1 | 78.8 ± 2 | 76.8 ± 2 | 96.0 ± 3 |
| C, H, N, O (wt%) | 88.3 | 92.4 | 91.5 | 97.0 |
| C (mmol/g) b | 36.05 ± 1.44 | 65.61 ± 2.62 | 63.94 ± 2.56 | 71.77 ± 2.9 |
| H (mmol/g) b | 21.73 ± 0.87 | 4.96 ± 0.20 | 5.16 ± 0.21 | 0.14 ± 0.003 |
| N (mmol/g) b | 0.19 ± 0.01 | 0.59 ± 0.04 | 0.55 ± 0.03 | 0.17 ± 0.005 |
| O (mmol/g) b | 26.56 ± 1.06 | 7.69 ± 0.31 | 8.38 ± 0.34 | 1.45 ± 0.03 |
| OH (mmol/g) c | 26.56 | 7.69 | 8.38 | — |
| COOH (mmol/g) c | 13.28 | 3.84 | 4.19 | — |
| OH (mmol/m2) d | — | 0.019 | 0.025 | — |
| COOH (mmol/m2) d | — | 0.009 | 0.013 | — |
| Inorganic elemental composition (oxide weight %) | ||||
| SO3 | 0.02% | 0.33% | 0.55% | 0.66% |
| MnO | 0.0023% | 0.16% | 0.40% | — |
| SiO2 | 0.04% | 0.23% | 0.20% | — |
| K2O | — | 0.02% | 0.04% | — |
| CaO | — | 0.02% | 0.03% | — |
| Cl | 0.0081% | 0.01% | 0.01% | 0.03% |
| Al2O3 | 0.02% | 0.01% | 0.0088% | 0.01% |
| Fe2O3 | 0.0011% | 0.0049% | 0.0058% | 0.006% |
| MoO3 | — | 0.0011% | — | — |
| ZnO | — | 0.0010% | 0.0010% | 0.001% |
| CuO | 0.0010% | 0.0009% | 0.0015% | 0.0005% |
| NiO | 0.0004% | — | 0.0003% | 0.0003% |
| Pd | 0.0040% | — | — | — |
| Ru | 0.0032% | — | — | — |
Organic elements were determined with combustion elemental analysis. Inorganic elements were determined by WDXRF with C as matrix.
[Jackson et al., 2015].
± 95% confidence limits are based on expanded uncertainty of combustion elemental analysis and a coverage factor of 2.
Calculated based on combustion elemental analysis assuming either all oxygen is bound in OH or in COOH.
Calculated based on combustion elemental analysis assuming either all oxygen is bound in OH or in COOH and finally divided by the BET surface area.
Gas Chromatography‐Mass Spectrometry
Ten µl of the aqueous GO suspension was injected into a tube filled with 2,6‐diphenyl‐p‐phenylene oxide Tenax® TA and purged with Helium for 10 min. The tube was then analyzed by Thermal Desorption‐Gas Chromatography‐Mass Spectrometry (TD‐GCMS) using a Perkin Elmer Turbomatrix 350 (Perkin Elmer, Waltham, MA) Bruker SCION QQQ (Bruker Daltonics, Bremen, DE) at a desorption temperature of 325ºC.
Endotoxin
The levels of endotoxin (endotoxin unit, EU) in GO and rGO were assessed (EU/mg) with the Limulus Amebocyte Lysate assay (Kinetic‐QCL endotoxin kit, Lonza Walkersville, MD) in duplicate as described [Jackson et al., 2015].
Generation of Reactive Oxygen Species
The potential generation of reactive oxygen species (ROS) of GO and rGO was analyzed with the 2′,7′‐dichlorofluorescein diacetate (DCFH‐DA) oxidation assay (H2DCFDA, Life Technologies) as previously described [Saber et al., 2012]. DCFH‐DA was hydrolyzed to DCFH by NaOH and later diluted in Hank's buffered saline solution (HBSS). Particle suspensions were prepared in HBSS prior sonication as described above. The final particle suspension and DCFH was added to 96‐well plates at DCFH concentration of 0.01 mM. The plates were incubated at 37ºC for 3 hr. GO, rGO, and the reference material Printex90 were incubated (in triplicates) at concentrations ranging from 0 to 135 µg/ml (0, 1.4, 2.8, 5.6, 11.25, 22.5, 45, 90, and 135 µg/ml). The level of DCF was measured spectrofluorometrically with λ exitation 490nm and λ emmision 520 nm (Victor Wallac‐2 1420, Perkin Elmer, Denmark). For assay including GO and Printex90, fluorescent intensity for sonicated HBSS without particles was measured to 18,466 units/s and for assay including rGO‐s and rGO‐l, fluorescent intensity for sonicated HBSS without particles was 24,590 units/s. The initial slope (1.4–5.6 µg/ml) of the dose‐response curve was used to rank the efficiency (fold increase) of ROS generation of the materials when compared to the Fluorescent intensity for HBSS without particles. Data were log‐transformed before statistical analysis for relevant concentrations (1.4–5.6 µg/ml).
Preparation of Dispersions
To achieve a homogenous dispersion of graphene in cell culture medium (2 mg/ml), GO, rGO‐s, rGO‐l, and Printex90 were weighed and sonicated before cell exposure. GO‐aqueous suspension (4 mg/ml) was diluted in cell culture medium to achieve a final concentration of 2 mg/ml.
Sonication was performed for 16 min at 400 watt and 10% amplitude as described previously [Jackson et al., 2015]. To standardize exposure of cells at all concentrations, 10% of cell culture medium with or without nanomaterial was sonicated before exposure.
Hydrodynamic Size
The hydrodynamic size of GO and rGO in cell culture medium (2 mg/ml) was determined by dynamic light scattering (DLS) immediately after sonication. Graphene dispersion of 700 µl was transferred to a 4.5 ml polystyrene spectrophotometer cuvette for DLS analysis (Malvern Zetasizer Nano ZS. Malvern Electronics Ltd, UK). Hydrodynamic size distribution (number weighed distribution), light intensity weighed mean size (Z‐average) and Polydispersity Index (PDI) were determined at 25ºC. Viscosity was set to 0.97 mPa.s. Refractive (R i) and absorption index (R a) was used when transforming from light intensity distribution to number distribution for GO and rGO (R i: 2.039, R a: 2.00), and for printex90 (R i: 2.020, R a: 2.00). DLS was repeatedly performed 6 times and a mean was calculated for all parameters.
Zeta Potential and pH Level
The stability of GO and rGO in cell culture suspension (2 mg/ml) was evaluated by zeta potential. Before measurements, GO or rGO was prepared in cell culture medium and sonicated as described above. Seven hundred microliter was added to a disposable folded capillary cell DTS1070 (Malvern Instruments Ltd, UK). Measurement was performed on a Malvern Zetasizer Nano ZS (Malvern Instruments Ltd, UK). Each sample was repeatedly measured 3 times and a mean value was calculated. The pH level was measured with a Meterlab standard pH meter PHM2010 (Radiometer Analytical SAS, France). The pH value of the delivered aqueous GO‐suspension was 2.54.
Murine Lung Epithelial Cell Line
The spontaneously immortalized murine pulmonary epithelial cell line (FE1), derived from the transgenic mouse strain 40.6 MUTA‐Mouse [White et al., 2003] was used in this study. FE1 cells were cultured in an incubator (37ºC, 5% CO2) in cell culture medium (DMEM/F.−12 + GlutaMAX, Life Technologies, 31331‐028) supplied by 2% heat‐inactivated Fetal Bovine Serum (Gibco, 10106‐169), 1% Penicillin (10,000 IU/ml) Streptomycin (10,000 µg/ml, Biological Industries, 949‐208), and 0.001% Epidermal growth factor (Sigma E4127).
Cell Exposure
FE1 cells were seeded in 24‐well cell‐culture plates (Greiner, 662160) at a concentration of 1 × 10⁵ cells/ml. Cells were exposed to GO or rGO at concentrations 0, 5, 10, 25, 50, 100, 200 µg/ml in duplicates (corresponding to 0, 2.8, 5.7, 14.1, 28.3, 56.6, and 113.2 µg/cm3). Cell exposures were performed in three independent experiments across different days and cell passages. During harvest, all wells were washed with PBS and 100 µl trypsin was added afterwards. One hundred fifty microliter freeze medium (83.3% FBS, Biological industries, 04‐007‐1 and 16.7% DMSO, Uvasol, 1.02950.0500) were added and cells were aliquoted into tubes for cytotoxicity (100 µl) and genotoxicity (50 µl).
Cytotoxicity
Cell viability (%) and proliferation were assessed after 24 hr of exposure. Immediately after harvesting, the total number of cells was counted by Nucleocounter NC‐200® (Chemometec A/S, Allerod Denmark) using Via1‐Cassettes (Cat No: 941‐0012, Chemometec A/S, Allerod Denmark). Data were analyzed with the enclosed computer software Chemometec Nucleoview NC‐200. For statistical analysis, the percentages of viable cells were transformed to arcsin‐values (n = 3). Cell proliferation was determined as the percentage change in the total number of cells. An effect on cell proliferation was only considered relevant if the effect was statistically significant and dose‐dependent across the dose range (0–200 µg/ml). To minimize variability across experiments, data for cell proliferation were normalized to the mean of the control level (0 µg/ml) for the respective experiment (n = 3).
Genotoxicity
DNA strand break levels were determined using the comet assay as described [Jackson et al., 2013]. In brief, 10 µl cell suspensions of FE1 cells, preserved in 17% DMSO + 83% fetal bovine serum, were embedded in agarose gel on 20‐well Trevigen comet slides (Gaithersburg, MD). Slides were placed in lysis buffer overnight at 4°C. The next day, the slides were placed in alkaline solution for 30 min prior to alkaline electrophoresis (25 min, 1.15V/cm, and 294 mA) with circulation (70 ml/min). After electrophoresis, slides were neutralized for 10 min. Then, the slides were stained with SYBR Green for 30 min. FE1 cells exposed for 30 min at 4ºC to PBS or 7.5, 15, 30 µm hydrogen peroxide were included as negative and positive control, respectively. Analysis and scoring of DNA strand breaks was performed with IMSTAR pathfinder system (IMSTAR, Paris, France). DNA strand breaks were quantified as comet tail length (TL) and %DNA in the tail (%DNA). For statistical analysis TL and %DNA were normalized to the mean control level (0 µg/ml) for the respective experiment. A549 cells exposed to PBS or 60 µm hydrogen peroxide were included on all Trevigen slides as negative and positive electrophoresis controls, respectively. Duration of exposure was 30 min at 4ºC as described [Jackson et al., 2013]. DNA strand breaks in 60 µM hydrogen peroxide‐exposed A549 cells were significantly increased (TL = 25.9 ± 4.5 and 45.1 ± 11.5, %DNA 17.3 ± 2.6, and 37.9 ± 7.7) compared to PBS exposed (TL = 18.8 ± 6.3 and 12.1 ± 3.5, %DNA 10.0 ± 5.1 and 4.8 ± 0.4).
Statistical Analyses
All statistical analyses were performed in R (v3.10) and Rstudio (v 0.98.1091). The statistical analyses were performed with One Way Analysis of Variance (ANOVA) and presented as mean ± standard error of the means (SEM). Data were separated by individual particle and dose was set as categorical variable. In case of significant main effect of dose (significance level; 0.05), a pairwise comparison across doses was performed with Tukey's honest significant difference (HSD) test with adjusted correction (significant level; 0.05, confidence interval; 0.95).
RESULTS
Material Characterization
Raman Spectroscopy
The graphene materials used in this study, one GO and two rGO materials, were produced by the chemical exfoliation of graphite. Raman spectroscopy was performed to characterize isolated flakes of the different materials (Fig. 1). Four main peaks associated with highly defective wrinkled graphene were observed, that is, the D and G bands (∼1,325 cm−1 and ∼1,595 cm−1, respectively) and the higher order 2D and D + D′ peaks (∼2,645 and ∼2,895 cm−1, respectively) [Martins Ferreira et al., 2010]. The high degree of disorder in the materials was evidenced by the large > 50 cm−1 width of the G peak and precludes an accurate determination of the number of stacked graphene layers via Raman spectroscopy. However the increase in the D/G intensity ratio and concurrent decrease of the D peak width on reduction of GO is consistent with a lower oxygen concentration and a larger average size of sp2 clusters in rGO [Claramunt et al., 2015].
Figure 1.
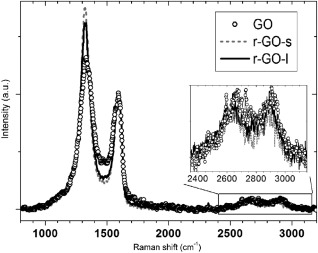
633 nm Raman spectra of isolated flakes of GO, rGO‐s, and rGO‐l normalized to the G peak intensity (∼1,595 cm−1).
Electron Microscopy
For further characterization and visualization of the graphene layers, electron microscopy imaging was performed (Fig. 2). SEM imaging of rGO clearly showed high degrees of agglomeration of graphene layers. To investigate isolated GO and rGO unit layers, GO suspended in aqueous solution and rGO dispersed in isopropanol were dropped on the TEM grid. Agglomeration of layers at different sizes was still found on the TEM grid, especially in rGO the samples. The lateral size of only perfectly isolated unit layers was measured to estimate the real exfoliated lateral size. The typical lateral size of the isolated GO layers observed by TEM imaging was 2–3 µm, while the isolated rGO layers were typically 1–2 µm (Fig. 2, Table 1 and Supporting Information Fig. S1). The difference in average size between GO and rGO samples might be due to their different morphologies. The GO layers appeared quite flat because of the suspension in liquid, while the rGO plates appeared highly crumpled because of the compaction during the reduction steps. High resolution TEM imaging was also performed to estimate the average number of layers. High resolution TEM image of the edge and the partial wrinkles allowed us to estimate the typical number of layers. Both the GO and rGO consisted mainly of 2–3 stacked graphene layers (Fig. 3 and Supporting Information Fig. S2). Additionally, 1–2 more layers may be present at the center of wrinkled graphene layers in the rGO samples (Fig. 4). In STEM imaging (Table 1 and Fig. 2), the lateral size for rGO‐s and rGO‐l were estimated to 0.5–2.0 and 0.2–0.8 µm, respectively. Due to handling when applying GO to the carbon film, GO adjusted to holes in the carbon film (Fig. 2). This may have affected the morphology. Therefore, it was not possible to accurately estimate the lateral size of individual GO layers with STEM.
Figure 2.
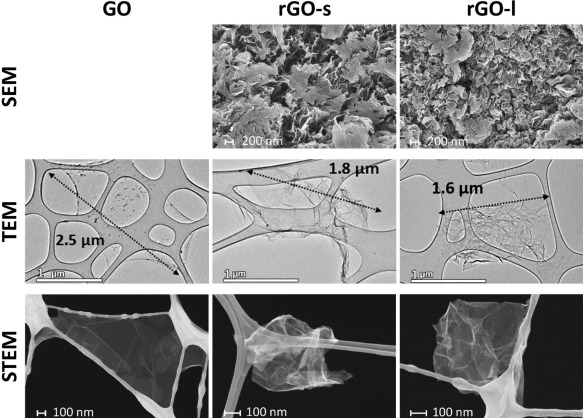
Morphology of GO (Left), rGO‐s (middle), and rGO‐l (right): Agglomeration of graphene layers visualized by SEM microscopy. The Lateral size of graphene layers was determined by TEM and STEM microscopy.
Table 1.
Characterization of GO, rGO‐s, rGO‐l, and Printex90
| GO | rGO‐s | rGO‐l | Printex90 | |
|---|---|---|---|---|
| Number of layers | 2–3 | 2–3 | 2–3 | — |
| Lateral size TEM (µm) | 2–3 | 1–2 | 1–2 | — |
| Lateral size STEM (µm) | ∼1 | 0.5–2.0 | 0.2–0.8 | — |
| Surface area BET (m2/g) | — | 411 | 335 | 338a |
| Z‐average DLS (nm) b | 157 | 274 | 284 | 129 |
| PDI c | 0.354 | 0.337 | 0.312 | 0.193 |
| Zeta potential (mV) d | −39.3 ± 1.5 | −10.7 ± 0.6 | −12.2 ± 0.6 | — |
| pH | 7.02 | 8.04 | 8.04 | — |
Figure 3.
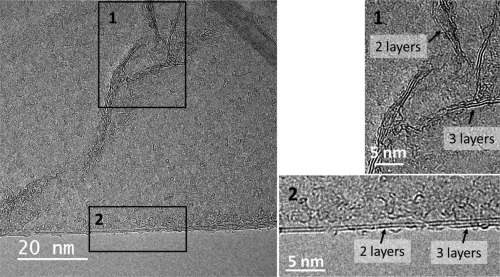
High resolution TEM microscopy of rGO‐s showing of 2–3 layers of superposed graphene layers.
Figure 4.
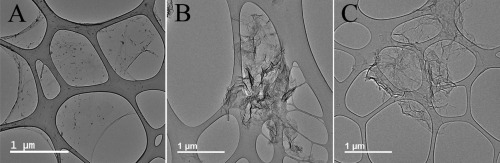
Less wrinkling of graphene layers for GO (A) compared to rGO‐s (B) and rGO‐l (C) visualized by TEM microscopy.
Specific Surface Area
The surface area (Table 1) was quite similar for rGO‐s (411 m2/g) and rGO‐l (335 m2/g) and similar to the surface area of Printex90 (338 m2/g). Assessment of specific surface area by BET analysis was only possible for rGO‐s and rGO‐l.
Analysis of Organic Elemental Composition
The total content of carbon (C), hydrogen (H), nitrogen (N), and oxygen (O) determined by combustion elemental analysis showed large difference in the content of organic elements between GO and rGO as expected (Table 2). GO had almost equimolar content of C, O, and H (36.05 ± 1.44, 26.56 ± 1.06 mmol/g, and 21 mmol/g, respectively). For GO, the molar contents of O and H in relation to C were 1.4 for the C/O‐ratio and 1.7 for the C/H ratio, respectively. For rGO materials, the molar contents of O and H were much lower (Table 2) and the C/O and C/H ratios were 8 and 12.8, respectively, for rGO‐s and rGO‐l, confirming lower levels of functionalization compared to GO. The molar contents of N in GO, rGO‐s, and rGO‐l materials were all low (< 0.59 mmol/g). Calculated surface density (mmol/m2) of hydroxyl and carboxyl groups was quite similar for rGO‐s and rGO‐l (Table 2).
Analysis of Inorganic Elemental Composition
We determined the levels of inorganic impurities in graphene materials using WDXRF. Impurities (wt%) in GO, rGO‐s and rGO‐l, compared to Printex90, are presented in Table 2. Overall, the contents of inorganic impurities were below 1.5 wt%. Sulphur (S), manganese (Mn), and silicon (Si) were the most abundant impurities across all materials. The level of impurities was generally lowest in GO. However, GO was measured in an aqueous suspension, whereas the rGO‐s and rGO‐l were measured as powders.
Analysis of Organic Impurities
We analyzed the GO‐aqueous suspension by TD‐GC‐MS to assess high molecular weight organic impurities. We mainly observed Sulphur dioxide (SO2). The organic content of the suspension was very low.
Endotoxin
Low levels of endotoxin were found in both GO and rGO, presented as EU/mg and EU/ml. The highest level of endotoxin was observed in GO (1.77 EU/mg). The levels of endotoxin were determined to 1.05 EU/mg and 0.23 EU/mg for rGO‐s and rGO‐l, respectively.
Generation of Reactive Oxygen Species
The ability of each material to generate ROS was determined using the DCFH oxidation assay (Fig. 5 and Supporting Information Table S2). All materials generated statistically significant amounts of ROS at all relevant concentrations (Supporting Information Table S2). A bell‐shaped curve was observed for Printex90 and to a lesser extent for rGO‐s. A similar curve of ROS production has been observed previously for Printex90 [Vesterdal et al., 2012; Hogsberg et al., 2013]. It has been speculated that the presence of high absorbance particles such as amorphous carbon black may cause quenching of the signal by depleting the fluorophore [Wilson et al., 2002; Hemmingsen et al., 2011; Zhao and Riediker, 2014; Zhang et al., 2015]. ROS generation was therefore assessed as the initial slopes of the ROS generation curves. GO was most efficient in generation of ROS at increasing dose (slope: 3.5 in arbitrary units) up to 90 µg/ml. rGO‐s and rGO‐l also generated ROS but less efficiently. The level of ROS generation for rGO‐s was about half of GO (slope: 1.9). rGO‐l had the lowest ability to generate ROS (slope: 0.7). However, all the graphene materials had much lower ROS generating potential compared to the reference material Printex90 (slope: 7.7).
Figure 5.
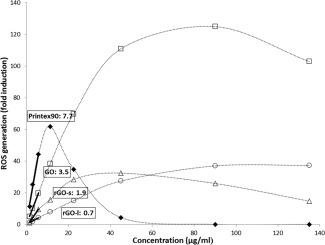
Generation of reactive oxygen species (ROS) was measured with dichlorofluorescein diacetate (DCFH‐DA) oxidation assay for GO (squares), rGO (triangles), rGO‐l (circles), and carbon black Printex90 (black diamonds) following incubation for 3 hr (1.4, 2.8, 5.6, 11.25, 22.5, 45, 90, and 135 µg/ml). Values are shown as mean fold induction of three replicates within one experiment. ROS generation was calculated by linear regression from the initial slope of each individual curve (1.4, 2.8, and 5.6 µg/ml) as presented in boxes.
Dispersion in Cell Culture Medium
The hydrodynamic size distributions of GO and rGO dispersed in cell culture medium were analyzed by dynamic light scattering (Table 1 and Fig. 6). Overall, the hydrodynamic size (expressed as Z‐average), was lower for GO than for the two rGO materials. Z‐average for GO was 157 nm while Z‐average for rGO‐s and rGO‐l was determined to 274 and 284 nm, respectively. PDI values were determined to 0.354, 0.337, and 0.312 for GO, rGO‐s, and rGO‐l, respectively, indicating a trend of monodispersity when dispersed in cell culture medium. However, visual inspection of rGO indicated instability, where especially rGO‐l formed agglomerates and precipitated immediately after sonication (Supporting Information Fig. S2). The high zeta‐potenitals of rGO‐s and rGO‐l (Table 1) were consistent with lower dispersability compared to GO.
Figure 6.
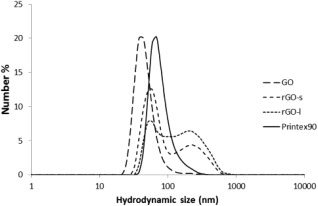
Hydrodynamic size distribution of GO, rGO‐s, rGO‐l, and Printex90 dispersed in cell culture medium (2 mg/ml). Results are presented as mean number distribution (number %) based on six repeated measurements.
Cytotoxicity
Cytotoxicity of GO and both rGO in FE1 cells was assessed after 24 hr exposure (Table 3). Overall, no significant decrease in cell viability was observed in cells exposed to 5–200µg/ml of GO, rGO‐s, and rGO‐l or the reference Printex90 (viability >94%). Furthermore, cell proliferation was unaffected at all doses, although there was a trend towards decreased proliferation for cells exposed to Printex90. However, the decrease was not statistically significant.
Table 3.
Cell Viability and Proliferation of FE1 Cells Exposed to GO, rGO‐s, and rGO‐l for 24 hr at Doses 0–200ug/ml
| µg/ml | 0 | 5 | 10 | 25 | 50 | 100 | 200 |
|---|---|---|---|---|---|---|---|
| µg/cm2 | 0 | 2.8 | 5.7 | 14.1 | 28.3 | 56.6 | 113.2 |
| Viability % | |||||||
| GO | 98 ± 1 | 92 ± 8 | 97 ± 1 | 97 ± 1 | 99 ± 0 | 99 ± 1 | 98 ± 0 |
| rGO‐s | 98 ± 0 | 98 ± 1 | 98 ± 1 | 98 ± 1 | 99 ± 0 | 93 ± 5 | 96 ± 1 |
| rGO‐l | 98 ± 1 | 98 ± 0 | 98 ± 1 | 98 ± 1 | 99 ± 0 | 99 ± 0 | 97 ± 2 |
| Printex90 | 95 ± 1 | 95 ± 1 | 96 ± 0 | 94 ± 1 | 94 ± 1 | 95 ± 1 | 95 ± 1 |
| Proliferation | |||||||
| GO | 100a | 93 ± 15 | 80 ± 16 | 92 ± 25 | 77 ± 15 | 87 ± 22 | 57 ± 12 |
| rGO‐s | 100a | 122 ± 10 | 156 ± 35 | 153 ± 38 | 83 ± 19 | 92 ± 10 | 86 ± 8 |
| rGO‐l | 100a | 101 ± 6 | 94 ± 16 | 111 ± 11 | 111 ± 27 | 94 ± 6 | 89 ± 10 |
| Printex90 | 100a | 72 ± 13 | 71 ± 17 | 71 ± 19 | 86 ± 3 | 75 ± 5 | 63 ± 8 |
Results are shown as mean ± SEM (n = 3).
Controls (0 µg/ml) were set to 100% and proliferation are presented as % difference relative to the corresponding control.
Genotoxicity
The levels of DNA strand breaks were assessed with the comet assay and presented as TL and %DNA. As positive control, FE1 cells exposed to 7.5, 15, and 30 µM hydrogen peroxide for 30 min were included and showed statistically significantly increased DNA strand break levels compared to PBS exposed cells (Fig. 7). Levels of DNA strand breaks were determined in FE1‐cells after exposure to GO, rGO‐s, and rGO‐l (5–200 µg/ml) following 3 hr (Table 4 and Supporting Information Fig. S3) and 24 hr (Table 4 and Fig. 8) of exposure. Exposure had no effect on DNA strand break levels at doses up to 200 µg/ml at either time point. Carbon black Printex90 was included as a reference particle. At 100 µg/ml Printex90, there was a nonstatistically significant ∼20% increase in both TL and %DNA. Although there was no statistically significant effects on DNA strand break levels following exposure to GO, rGO‐s, and rGO‐l, there was correlation (Pearson's correlation) between TL and %DNA of 0.724 and 0.718 following 3 or 24 hr of exposure, respectively (results not snown).
Figure 7.
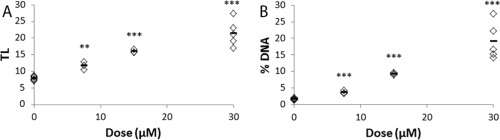
Dose‐response relationship of DNA strand breaks, expressed as TL (A) and %DNA (B) in FE1 cells and mean values (black lines) following 30 min exposure to 0 (n = 6), 7.5 (n = 3), 15 (n = 3), and 30 (n = 6) µM hydrogen peroxide within one experiment. *, **, and *** indicates statistically significant difference compared to control level (0 µm) at P < 0.05, and P < 0.01, and P < 0.001, respectively.
Table 4.
DNA Strand Breaks Assessed by the Comet Assay, Expressed as Tail Length (TL) or Percent DNA in the Tail (%DNA) in FE1 Cells Exposed to Graphene Materials or Reference Material Printex90
| µg/ml | 0 | 5 | 10 | 25 | 50 | 100 | 200 |
|---|---|---|---|---|---|---|---|
| µg/cm2 | 0 | 2.8 | 5.7 | 14.1 | 28.3 | 56.6 | 113.2 |
| 3 hr | |||||||
| GO | |||||||
| TL | 17.4 ± 1.9 | 17.3 ± 3.2 | 16.8 ± 2.6 | 15.9 ± 2.4 | 16.5 ± 2.3 | 15.4 ± 2.1 | 16.5 ± 2.3 |
| %DNA | 5.7 ± 2.2 | 6.5 ± 2.6 | 6.4 ± 2.2 | 5.7 ± 1.6 | 5.4 ± 2.2 | 5.8 ± 1.7 | 6.4 ± 2.3 |
| rGO‐s | |||||||
| TL | 21.9 ± 2.7 | 20.9 ± 3.1 | 23.5 ± 2.6 | 22.4 ± 4.9 | 20.0 ± 4.3 | 24.9 ± 2.7 | 21.5 ± 4.3 |
| %DNA | 6.6 ± 1.8 | 6.8 ± 1.9 | 7.1 ± 2.0 | 7.4 ± 2.1 | 6.3 ± 2.0 | 9.0 ± 1.6 | 7.5 ± 1.3 |
| rGO‐l | |||||||
| TL | 14.0 ± 2.1 | 13.6 ± 2.5 | 13.5 ± 1.4 | 13.2 ± 2.7 | 13.6 ± 2.1 | 12.8 ± 1.6 | 13.0 ± 0.6 |
| %DNA | 5.7 ± 1.5 | 5.8 ± 1.9 | 5.9 ± 2.1 | 6.0 ± 2.1 | 6.3 ± 1.8 | 5.7 ± 1.3 | 5.9 ± 1.1 |
| Printex90 | |||||||
| TL | 15.3 ± 0.5 | 16.3 ± 0.9 | 15.0 ± 1.1 | 15.0 ± 3.3 | 18.0 ± 2.1 | 19.9 ± 3.4 | 17.8 ± 1.6 |
| %DNA | 6.0 ± 1.2 | 5.5 ± 0.5 | 5.1 ± 0.7 | 5.9 ± 0.7 | 7.0 ± 0.8 | 7.5 ± 0.8 | 7.0 ± 0.8 |
| 24 hr | |||||||
| GO | |||||||
| TL | 19.8 ± 0.6 | 18.0 ± 1.1 | 19.1 ± 0.9 | 17.1 ± 1.0 | 13.3 ± 0.7 | 14.1 ± 0.9 | 15.4 ± 0.3 |
| %DNA | 6.7 ± 0.3 | 6.4 ± 1.2 | 6.7 ± 0.6 | 6.4 ± 1.2 | 5.3 ± 0.7 | 5.5 ± 0.8 | 7.2 ± 1.0 |
| rGO‐s | |||||||
| TL | 22.6 ± 0.2 | 19.6 ± 1.3 | 20.1 ± 0.4 | 22.1 ± 0.9 | 20.0 ± 0.3 | 22.0 ± 0.5 | 22.5 ± 1.4 |
| %DNA | 8.9 ± 1.3 | 5.7 ± 0.3 | 6.7 ± 0.3 | 7.5 ± 0.6 | 6.8 ± 0.6 | 7.0 ± 0.1 | 8.5 ± 1.7 |
| rGO‐l | |||||||
| TL | 14.5 ± 0.5 | 13.6 ± 0.8 | 12.7 ± 0.1 | 12.9 ± 0.3 | 13.0 ± 0.6 | 13.3 ± 0.4 | 13.7 ± 0.2 |
| %DNA | 4.5 ± 0.4 | 4.7 ± 0.3 | 4.1 ± 0.4 | 4.4 ± 0.2 | 4.6 ± 0.4 | 4.5 ± 0.1 | 5.6 ± 0.4 |
| Printex90 | |||||||
| TL | 12.2 ± 0.4 | 12.0 ± 0.2 | 11.0 ± 0.8 | 10.9 ± 1.0 | 10.1 ± 1.0 | 12.0 ± 1.4 | 11.4 ± 1.1 |
| %DNA | 2.8 ± 0.1 | 3.5 ± 0.2 | 2.4 ± 0.3 | 2.8 ± 0.4 | 2.6 ± 0.1 | 3.8 ± 0.2 | 4.0 ± 0.4 |
Results are shown as Mean ± SEM (n = 3).
Figure 8.
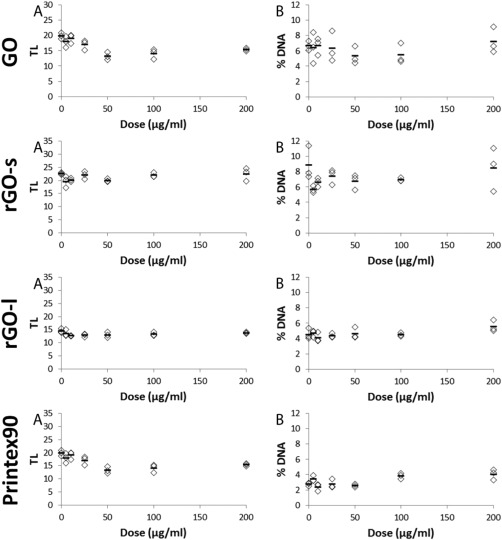
Level of DNA strand breaks in FE1 cells following exposure to GO, rGO‐s, rGO‐l, and Printex90 for 24 hr at doses 0–200 µg/ml. DNA strand breaks is expressed as TL (A) and %DNA (B) as individual data points (n = 3) and mean values (black lines).
DISCUSSION
In this study, we present an in‐depth physicochemical characterization of commercially available GO and rGO materials alongside assessment of cytotoxicity and genotoxicity in the murine lung epithelial cell line FE1.
The studied GO and rGO materials mainly existed as few‐layered graphene with lateral sizes in the respirable size range (<5 µm). All materials were highly dispersible although lateral size and wrinkling differed between GO and rGO materials. Wrinkling may be due to lower level of surface oxidation resulting in increased electrostatic repulsion. Lower level of oxidation and subsequent higher degree of wrinkling has also previously been reported (Das et al. 2013). In addition, smaller hydrodynamic sizes than determined in TEM may be interpreted as wrinkling of layers in cell culture medium. Furthermore, TEM imaging indicated similar lateral sizes for rGO‐s and rGO‐l. In accordance with this, BET surface area of rGO‐s and rGO‐l were comparable. Although GO existed as few‐layered graphene with larger size, less wrinkling of layers supports an estimated surface area comparable to those of rGO‐s and rGO‐l.
GO is typically produced with a C/O ratio of 2–4, while reduction will increase C/O ratio to approximately 12 [Wick et al., 2014]. In general, graphite exfoliation by Hummers method introduces a higher level of O than other methods [Chua et al., 2012]. As expected, GO had high contents of O and H, rGO‐s, and rGO‐l contained less. The C/O ratios for GO (∼1.4) and rGO (∼8.0) materials used in this study are similar to C/O ratios of graphene materials used in previous toxicological studies of 0.7–2.9 for GO [Mattevi et al., 2009; Das et al., 2013; Lammel et al., 2013; Sydlik et al., 2015] and 5‐12.5 for rGO [Mattevi et al., 2009; Akhavan et al., 2012; Chng and Pumera, 2013; Das et al., 2013; Zhang et al., 2015], respectively. The estimated surface density of hydroxyl groups on the rGO‐s and rGO‐l (0.019 and 0.025 mmol/m2, respectively) are comparable to levels estimated for hydroxylated MWCNTs (< 0.029 mmol/m2) [Jackson et al., 2015].
The main inorganic impurities found in the present study (manganese and silicon) are most likely contaminants from the oxidation step with sulphuric acid and potassium permanganate, while the reduction step may have led to increased levels of, for example, iron, copper, and zinc due to the use of synthesis reagents that could have been already contaminated [Wong et al., 2014]. However, the level of impurities present in GO and rGO are comparable to or lower than levels found in MWCNTs [Jackson et al., 2015].
The dispersions of the graphenes differed greatly in stability due to the hydrophobic properties of rGO materials. Achieving a stable dispersion in cell culture medium and administration to cells were challenges that need to be highlighted. Immediately following sonication, rGO‐s in particular, formed large agglomerates which precipitated (Supporting Information Fig. S3). This may have affected the measurements of the hydrodynamic size. Zeta‐potential measurement supports the indication of colloid instability in cell culture medium. Higher instability rGO compared to GO has also been reported previously [Yue et al., 2012; Wang et al., 2013; Chatterjee et al., 2014]. Instability of rGO in cell culture medium correlates with previous findings showing that graphene with C/O ratio exceeding 3 is difficult to disperse in water and quickly sediments [Zhang et al., 2015]. Varying degree of sedimentation may result in differences in cellular uptake of GO and rGO. Cellular uptake was not quantified in the current study but would be highly relevant to assess. Twenty four hours exposures were included to allow uptake to take place, whereas the 3 hr time point was included to detect transient genotoxicity.
Cytotoxicity and genotoxicity in cultured FE1 cells were assessed following exposure to 5–200 µg/ml GO and rGO. Overall, we observed no effect on cytotoxicity (cell viability > 92%) or cell proliferation at any dose after 24 hr exposure to GO or rGO. The experimental setup used in this study is based on our previous toxicity studies with related carbon nanomaterials in FE1 cells at comparable dose‐range (5–200 µg/ml); The spherical‐shaped carbon black [Jacobsen et al., 2007; Jacobsen et al., 2008b] and a wide range of MWCNTs with varying lengths and functionalization levels [Poulsen et al., 2013; Jackson et al., 2015]. Jacobsen et al. [Jacobsen et al., 2008b] reported no effect on cell viability in spite of ROS generation by carbon black. However, dose‐dependent reduction of cell proliferation was observed for some of the MWCNTs [Jackson et al., 2015].
GO is the most frequently investigated graphene‐derivative in toxicological research due to the potential in biomedical applications. Cytotoxicity of graphite exfoliated GO with lateral size below ∼0.5 µm has commonly been studied in vitro in the human adenocarcinoma alveolar basal epithelial cells line A549. Chang et al [Chang et al., 2011] reported size and dose‐dependent cytotoxicity of 160–780 nm GO (50‐200 µg/ml) and GO with smaller lateral size was shown to be most cytotoxic. Dose‐dependent cytotoxicity of GO (20–100 µg/ml) was also observed by Hu and colleagues [Hu et al., 2011] in a study where the lateral size of GO layers was not clearly determined. Cytotoxicity of 100 nm GO (125 µg/ml) was also observed in a later study [Ali‐Boucetta et al., 2013]. By contrast, a single study reported no cytotoxicity for 300 nm GO (100 and 300 µg/ml) [Jin et al., 2014].
Cytotoxicity has also been reported in human lung fibroblasts and b‐lymphocytes cells after exposure to 100–200 nm GO [Wang et al., 2013; Wang et al., 2014]. Cytotoxicity of > 1 µm GO and rGO with lateral size above 1 µm has only been reported at a dose of 1,000 µg/ml in monocytes and macrophages [Sydlik et al., 2015].
Our findings of no cytotoxicity of GO and rGO with lateral size above 1 µm are thus consistent with the current literature.
Introduction of hydroxyl groups has been suggested to increase cytotoxicity of MWCNTs [Magrez et al., 2006; Ursini et al., 2012]. Likewise, it has been suggested that the level of oxidation of GO and rGO may affect cytotoxicity in vitro. Das and colleagues [Das et al., 2013] investigated cytotoxicity of < 800 nm GO and rGO in human endothelial cells and human keratinocytes (10 µg/ml). Although the lateral size was reported to influence cytotoxicity, higher level of oxidation was the major contributor to the reported cytotoxicity. In contrast, Zhang et al. [2015] recently reported increased cytotoxicity of GO in mouse embryo fibroblasts when decreasing level of oxygen. However, the study design was weak, since cell exposures were only performed once. In this current study, the oxidation level had no effect on cytotoxicity.
Generation of ROS by nanoparticles has been linked to cytotoxicity and genotoxicity [Halliwell and Whiteman, 2004]. A covariation of cytotoxicity and ROS generation was recently found following MWCNT exposure of FE1 cells [Jackson et al., 2015]. Current studies on toxicity of GO have reported a correlation between high ROS generation and cytotoxicity [Chang et al., 2011; Schinwald et al., 2012; Lammel et al., 2013; Wang et al., 2013]. In the present study, both GO and rGOs were shown to generate ROS without being cytotoxic. Our results are consistent with the observation that carbon black nanoparticles are efficient ROS generators without inducing cytotoxicity in FE1 cells [Jacobsen et al., 2007; Jacobsen et al., 2008b] and taken together, the results indicate that ROS is not a predictor of cytotoxicity in FE1 cells. Metal impurities such as iron in MWCNTs have been reported to induce toxicity in vivo [Koyama et al., 2009]. In addition, manganese, derived from potassium permanganate used during graphite exfoliation, induced cytotoxicity in, for example, murine macrophages [Yue et al., 2012]. However, the trace amount of metal impurities in the presently studied rGOs and rGO‐l were comparable to levels in MWCNTs that were also non‐cytotoxic [Jackson et al., 2015].
Overall, we show that ROS generating GO and rGO with larger lateral size (>1 µm) and relatively free of impurities were not cytotoxic even at relatively high doses.
Only few other studies have assessed the in vitro genotoxicity of graphite exfoliated graphene [Das et al., 2013; Wang et al., 2013]. Wang and colleagues [Wang et al., 2013] reported a dose‐dependent increase in the level of DNA strand breaks of 200–500 nm GO at a dose‐range of 1–100 µg/ml. DNA strand breaks was also reported by Das et al [Das et al., 2013] with reduced genotoxicity following further reduction of GO. In both studies ROS generation was proposed as the main mechanism of genotoxicity.
In the present study, GO and rGO did not induce DNA strand breaks at any of the studied doses and time points. 3 hr and 24 hr were chosen to reflect both transient and prolonged genotoxicity. In the previously mentioned MWCNT study [Jackson et al., 2015], and Printex90 was included as reference particle and induced a 20% increase in DNA strand breaks at 200 µg/ml, determined as TL. In the present study, we also found 20% increase in TL for Printex90 at 100 µg/ml, although the increase was not statistically significant. However, hydrogen peroxide, used as positive control, induced a dose‐dependent increase in DNA strand breaks (Fig. 7). Carbon black Printex90 is both an efficient ROS generator and induces DNA strand breaks in the comet assay in FE1 cells. MWCNT induce less ROS and only one of 15 tested MWCNT induced DNA strand breaks in the comet assay in FE1 cells. Our results that rGO and GO induce less ROS compared to Printex90 and no genotoxicity, are consistent with the notion that ROS generation may be an important determinant for genotoxicity. Furthermore, the lack of genotoxicity in the current study suggests that relatively high levels of ROS generation are required for genotoxicity in FE1 cells.
Carbon black has been shown to be both genotoxic and mutagenic in vivo and in vitro and is classified as possibly carcinogenic to humans [International Agency for Research on Cancer, 2010]. The mutation spectrum of carbon black‐induced mutations indicates that the mutations may be caused by ROS. For MWCNTs, results are less clear. Several types of MWCNT have been shown to induce ROS and two different MWCNT were shown to induce DNA strand breaks in lung tissue following pulmonary exposure [Poulsen et al., 2015], whereas limited genotoxicity was found in vitro [Jackson et al., 2015]. The biological mechanism underlying the MWCNT‐induced genotoxicity in lung tissue is unclear. The genotoxicity may be caused directly by ROS or indirectly by inflammation as suggested for man‐made mineral fibers [Topinka et al., 2006]. In our recent study of pulmonary exposure to ten different MWCNT in mice, large diameter of MWCNT was found to predict genotoxicity (Sarah Sos Poulsen et al., submitted for publication), supporting the notion that the observed in vivo MWCNT‐induced genotoxicity was not ROS‐dependent. The present results suggests that ROS generation by GO and rGO does not induce genotoxicity in FE1 cells. In a future study, it will be informative to compare the present data to in vivo genotoxicity following pulmonary exposure.
In conclusion, we report that few layered GO and rGO with lateral size above 1> µm were not cytotoxic or genotoxic to FE1 murine lung epithelial cells at concentrations up to 200 µg/ml.
AUTHOR CONTRIBUTIONS
SB was involved in study design and performed the experiments, including analysis and interpretation of cytotoxicity and comet assay; interpreted results from SEM, dynamic light scattering, zeta‐potential and ROS measurements; participated in interpretation of organic elemental analysis; performed all statistical analysis; drafted the manuscript. KK performed and interpreted the WDXRF results and drafted relevant sections. AM performed and interpreted endotoxin analysis. AN performed and interpreted the Gas Chromatography‐Mass Spectrometry results and drafted the relevant sections. PC interpreted organic elemental analysis and participated in drafting relevant section. NJ participated in study design and critically reviewed the manuscript. AP, BA and AZ manufactured and provided the studied graphene materials and drafted relevant sections. RR performed Raman spectroscopy, interpreted the results and drafted relevant sections. HO and JD performed TEM, interpreted the results and drafted the relevant sections. HW critically reviewed the manuscript. UBV participated in selection of test materials, design of the study, critically reviewing the manuscript and are responsible for the final result interpretation. All authors have read the manuscript critically and approved the final result interpretation.
Supporting information
Supporting Information
ACKNOWLEDGMENTS
The authors thank the technical staff for their help during this project. Anne‐Karin Asp from NRCWE for assistance during cell culturing, pH measurements, zeta‐potential, and comet assay; Lourdes Pedersen from NRCWE for assistance with comet assay; Elzbieta Christiansen from NRCWE for performing ROS measurements. Katrine Bjørnoe from Danish Technological Institute (Taastrup Denmark) for SEM and STEM imaging; DB Lab A/S (Odense, Denmark) for organic element analysis and Quantach‐ rome GmbH & Co. KG (Odelzhausen, Germany) for conducting BET.
Conflict of interest: The authors declare that they have no competing interests.
REFERENCES
- Akhavan O, Ghaderi E, Akhavan A. 2012. Size‐dependent genotoxicity of graphene nanoplatelets in human stem cells. Biomaterials 33:8017–8025. [DOI] [PubMed] [Google Scholar]
- Ali‐Boucetta H, Bitounis D, Raveendran‐Nair R, Servant A, Van den BJ, Kostarelos K. 2013. Purified graphene oxide dispersions lack in vitro cytotoxicity and in vivo pathogenicity. Adv Healthc Mater 2:433–441. [DOI] [PubMed] [Google Scholar]
- Ambrosi A, Pumera M. 2014. The CVD graphene transfer procedure introduces metallic impurities which alter the graphene electrochemical properties. Nanoscale 6:472–476. [DOI] [PubMed] [Google Scholar]
- Bianco A, Cheng HM, Enoki T, Gogotsi Y, Hurt RH, Koratkar N, Kyotani T, Monthioux M, Park CR, Tascon JMD, Zhang J. 2013. All in the graphene family GÇô A recommended nomenclature for two‐dimensional carbon materials. Carbon 65:1–6. [Google Scholar]
- Chang Y, Yang ST, Liu JH, Dong E, Wang Y, Cao A, Liu Y, Wang H. 2011. In vitro toxicity evaluation of graphene oxide on A549 cells. Toxicol Lett 200:201–210. [DOI] [PubMed] [Google Scholar]
- Chatterjee N, Eom HJ, Choi J. 2014. A systems toxicology approach to the surface functionality control of grapheneGÇôcell interactions. Biomaterials 35:1109–1127. [DOI] [PubMed] [Google Scholar]
- Chng EL, Pumera M. 2013. The toxicity of graphene oxides: Dependence on the oxidative methods used. Chemistry 19:8227–8235. [DOI] [PubMed] [Google Scholar]
- Chua CK, Sofer Z, Pumera M. 2012. Graphite oxides: Effects of permanganate and chlorate oxidants on the oxygen composition. Chemistry 18:13453–13459. [DOI] [PubMed] [Google Scholar]
- Claramunt S, Varea A, López‐Díaz D, Veláízquez MM, Cornet A, Cirera A. 2015. The importance of interbands on the interpretation of the Raman spectrum of graphene oxide. J Phys Chem C 119:10123–10129. [Google Scholar]
- Das S, Singh S, Singh V, Joung D, Dowding JM, Reid D, Anderson J, Zhai L, Khondaker SI, Self WT, Seal S. 2013. Oxygenated functional group density on graphene oxide: Its effect on cell toxicity. Part Part Syst Charact 30:148–157. [Google Scholar]
- Halliwell B, Whiteman M. 2004. Measuring reactive species and oxidative damage in vivo and in cell culture: How should you do it and what do the results mean? Br J Pharmacol 142:231–255. [DOI] [PMC free article] [PubMed] [Google Scholar]
- Hemmingsen JG, Moller P, Nojgaard JK, Roursgaard M, Loft S. 2011. Oxidative stress, genotoxicity, and vascular cell adhesion molecule expression in cells exposed to particulate matter from combustion of conventional diesel and methyl ester biodiesel blends. Environ Sci Technol 45:8545–8551. [DOI] [PubMed] [Google Scholar]
- Hogsberg T, Jacobsen NR, Clausen PA, Serup J. 2013. Black tattoo inks induce reactive oxygen species production correlating with aggregation of pigment nanoparticles and product brand but not with the polycyclic aromatic hydrocarbon content. Exp Dermatol 22:464–469. [DOI] [PubMed] [Google Scholar]
- Hu W, Peng C, Lv M, Li X, Zhang Y, Chen N, Fan C, Huang Q. 2011. Protein corona‐mediated mitigation of cytotoxicity of graphene oxide. ACS Nano 5:3693–3700. [DOI] [PubMed] [Google Scholar]
- International Agency for Research on Cancer . 2010. IARC Monographs On The Evaluation Of Carcinogenic Risks To Humans: Carbon Black, Titanium Dioxide, and Talc. Lyon, France. [PMC free article] [PubMed]
- Jackson P, Pedersen LM, Kyjovska ZO, Jacobsen NR, Saber AT, Hougaard KS, Vogel U, Wallin H. 2013. Validation of freezing tissues and cells for analysis of DNA strand break levels by comet assay. Mutagenesis 28:699–707. [DOI] [PMC free article] [PubMed] [Google Scholar]
- Jackson P, Kling K, Jensen KA, Clausen PA, Madsen AM, Wallin H, Vogel U. 2015. Characterization of genotoxic response to 15 multiwalled carbon nanotubes with variable physicochemical properties including surface functionalizations in the FE1‐Muta(TM) mouse lung epithelial cell line. Environ Mol Mutagen 56:183–203. [DOI] [PubMed] [Google Scholar]
- Jacobsen NR, Saber AT, White P, Moller P, Pojana G, Vogel U, Loft S, Gingerich J, Soper L, Douglas GR, Wallin H. 2007. Increased mutant frequency by carbon black, but not quartz, in the lacZ and cII transgenes of muta mouse lung epithelial cells. Environ Mol Mutagen 48:451–461. [DOI] [PubMed] [Google Scholar]
- Jacobsen NR, Moller P, Cohn CA, Loft S, Vogel U, Wallin H. 2008a. Diesel exhaust particles are mutagenic in FE1‐MutaMouse lung epithelial cells. Mutat Res 641:54–57. [DOI] [PubMed] [Google Scholar]
- Jacobsen NR, Pojana G, White P, Moller P, Cohn CA, Korsholm KS, Vogel U, Marcomini A, Loft S, Wallin H. 2008b. Genotoxicity, cytotoxicity, and reactive oxygen species induced by single‐walled carbon nanotubes and C(60) fullerenes in the FE1‐Mutatrade markMouse lung epithelial cells. Environ Mol Mutagen 49:476–487. [DOI] [PubMed] [Google Scholar]
- Jacobsen NR, White PA, Gingerich J, Moller P, Saber AT, Douglas GR, Vogel U, Wallin H. 2011. Mutation spectrum in FE1‐MUTA(TM) Mouse lung epithelial cells exposed to nanoparticulate carbon black. Environ Mol Mutagen 52:331–337. [DOI] [PubMed] [Google Scholar]
- Jin C, Wang F, Tang Y, Zhang X, Wang J, Yang Y. 2014. Distribution of graphene oxide and TiO2‐graphene oxide composite in A549 cells. Biol Trace Elem Res 159:393–398. [DOI] [PubMed] [Google Scholar]
- Koyama S, Kim YA, Hayashi T, Takeuchi K, Fujii C, Kuroiwa N, Koyama H, Tsukahara T, Endo M. 2009. In vivo immunological toxicity in mice of carbon nanotubes with impurities. Carbon 47:1365–1372. [Google Scholar]
- Lammel T, Boisseaux P, Fernandez‐Cruz ML, Navas JM. 2013. Internalization and cytotoxicity of graphene oxide and carboxyl graphene nanoplatelets in the human hepatocellular carcinoma cell line Hep G2. Part Fibre Toxicol 10:27 [DOI] [PMC free article] [PubMed] [Google Scholar]
- Li X, Cai W, An J, Kim S, Nah J, Yang D, Piner R, Velamakanni A, Jung I, Tutuc E, et al. 2009. Large‐area synthesis of high‐quality and uniform graphene films on copper foils. Science 324:1312–1314. [DOI] [PubMed] [Google Scholar]
- Liu Y, Luo Y, Wu J, Wang Y, Yang X, Yang R, Wang B, Yang J, Zhang N. 2013. Graphene oxide can induce in vitro and in vivo mutagenesis. Sci Rep 3:3469 [DOI] [PMC free article] [PubMed] [Google Scholar]
- Magrez A, Kasas S, Salicio V, Pasquier N, Seo JW, Celio M, Catsicas S, Schwaller B, Forro L. 2006. Cellular toxicity of carbon‐based nanomaterials. Nano Lett 6:1121–1125. [DOI] [PubMed] [Google Scholar]
- Martins Ferreira EH, Moutinho MVO, Stavale F, Lucchese MM, Capaz RB, Achete CA, Jorio A. 2010. Evolution of the Raman spectra from single‐, few‐, and many‐layer graphene with increasing disorder. Phys Rev B 82:125429 [Google Scholar]
- Mattevi C, Eda G, Agnoli S, Miller S, Mkhoyan KA, Celik O, Mastrogiovanni D, Granozzi G, Garfunkel E, Chhowalla M. 2009. Evolution of electrical, chemical, and structural properties of transparent and conducting chemically derived graphene thin films. Adv Funct Mater 19:2577–2583. [Google Scholar]
- Park S, Ruoff RS. 2009. Chemical methods for the production of graphenes. Nat Nanotechnol 4:217–224. [DOI] [PubMed] [Google Scholar]
- Poulsen SS, Jacobsen NR, Labib S, Wu D, Husain M, Williams A, Bogelund JP, Andersen O, Kobler C, Molhave K, Kyjovska ZO, Saber AT, Wallin H, Yauk CL, Vogel U, Halappanavar S. 2013. Transcriptomic analysis reveals novel mechanistic insight into murine biological responses to multi‐walled carbon nanotubes in lungs and cultured lung epithelial cells. PLoS One 8:e80452 [DOI] [PMC free article] [PubMed] [Google Scholar]
- Poulsen SS, Saber AT, Williams A, Andersen O, Kobler C, Atluri R, Pozzebon ME, Mucelli SP, Simion M, Rickerby D, Mortensen A, Jackson P, Kyjovska ZO, Molhave K, Jacobsen NR, Jensen KA, Yauk CL, Wallin H, Halappanavar S, Vogel U. 2015. MWCNTs of different physicochemical properties cause similar inflammatory responses, but differences in transcriptional and histological markers of fibrosis in mouse lungs. Toxicol Appl Pharmacol 284:16–32. [DOI] [PubMed] [Google Scholar]
- Reina A, Jia X, Ho J, Nezich D, Son H, Bulovic V, Dresselhaus MS, Kong J. 2009. Large area, few‐layer graphene films on arbitrary substrates by chemical vapor deposition. Nano Lett 9:30–35. [DOI] [PubMed] [Google Scholar]
- Ren W, Cheng HM. 2014. The global growth of graphene. Nat Nanotechnol 9:726–730. [DOI] [PubMed] [Google Scholar]
- Saber AT, Jensen KA, Jacobsen NR, Birkedal R, Mikkelsen L, Moller P, Loft S, Wallin H, Vogel U. 2012. Inflammatory and genotoxic effects of nanoparticles designed for inclusion in paints and lacquers. Nanotoxicology 6:453–471. [DOI] [PubMed] [Google Scholar]
- Schinwald A, Murphy FA, Jones A, MacNee W, Donaldson K. 2012. Graphene‐based nanoplatelets: A new risk to the respiratory system as a consequence of their unusual aerodynamic properties. ACS Nano 6:736–746. [DOI] [PubMed] [Google Scholar]
- Sydlik SA, Jhunjhunwala S, Webber MJ, Anderson DG, Langer R. 2015. In vivo compatibility of graphene oxide with differing oxidation states. ACS Nano 9:3866–3874. [DOI] [PMC free article] [PubMed] [Google Scholar]
- Topinka J, Loli P, Dusinska M, Hurbankova M, Kovacikova Z, Volkovova K, Kazimirova A, Barancokova M, Tatrai E, Wolff T, et al. 2006. Mutagenesis by man‐made mineral fibres in the lung of rats. Mutat Res 595:174–183. [DOI] [PubMed] [Google Scholar]
- Ursini CL, Cavallo D, Fresegna AM, Ciervo A, Maiello R, Buresti G, Casciardi S, Tombolini F, Bellucci S, Iavicoli S. 2012. Comparative cyto‐genotoxicity assessment of functionalized and pristine multiwalled carbon nanotubes on human lung epithelial cells. Toxicol In Vitro 26:831–840. [DOI] [PubMed] [Google Scholar]
- Vesterdal LK, Mikkelsen L, Folkmann JK, Sheykhzade M, Cao Y, Roursgaard M, Loft S, Moller P. 2012. Carbon black nanoparticles and vascular dysfunction in cultured endothelial cells and artery segments. Toxicol Lett 214:19–26. [DOI] [PubMed] [Google Scholar]
- Wang A, Pu K, Dong B, Liu Y, Zhang L, Zhang Z, Duan W, Zhu Y. 2013. Role of surface charge and oxidative stress in cytotoxicity and genotoxicity of graphene oxide towards human lung fibroblast cells. J Appl Toxicol 33:1156–1164. [DOI] [PubMed] [Google Scholar]
- Wang Y, Wu S, Zhao X, Su Z, Du L, Sui A. 2014. In vitro toxicity evaluation of graphene oxide on human RPMI 8226 cells. Biomed Mater Eng 24:2007–2013. [DOI] [PubMed] [Google Scholar]
- White PA, Douglas GR, Gingerich J, Parfett C, Shwed P, Seligy V, Soper L, Berndt L, Bayley J, Wagner S, Pound K, Blakey D. 2003. Development and characterization of a stable epithelial cell line from Muta Mouse lung. Environ Mol Mutagen 42:166–184. [DOI] [PubMed] [Google Scholar]
- Wick P, Louw‐Gaume AE, Kucki M, Krug HF, Kostarelos K, Fadeel B, Dawson KA, Salvati A, Vazquez E, Ballerini L, Tretiach M, Benfenati F, Flahaut E, Gauthier L, Prato M, Bianco A. 2014. Classification framework for graphene‐based materials. Angew Chem Int Ed Engl 53:7714–7718. [DOI] [PubMed] [Google Scholar]
- Wilson MR, Lightbody JH, Donaldson K, Sales J, Stone V. 2002. Interactions between ultrafine particles and transition metals in vivo and in vitro. Toxicol Appl Pharmacol 184:172–179. [DOI] [PubMed] [Google Scholar]
- Wong CH, Sofer Z, Kubesova M, Kucera J, Matejkova S, Pumera M. 2014. Synthetic routes contaminate graphene materials with a whole spectrum of unanticipated metallic elements. Proc Natl Acad Sci USA 111:13774–13779. [DOI] [PMC free article] [PubMed] [Google Scholar]
- Yue H, Wei W, Yue Z, Wang B, Luo N, Gao Y, Ma D, Ma G, Su Z. 2012. The role of the lateral dimension of graphene oxide in the regulation of cellular responses. Biomaterials 33:4013–4021. [DOI] [PubMed] [Google Scholar]
- Zhang W, Yan L, Li M, Zhao R, Yang X, Ji T, Gu Z, Yin JJ, Gao X, Nie G. 2015. Deciphering the underlying mechanisms of oxidation‐state dependent cytotoxicity of graphene oxide on mammalian cells. Toxicol Lett 237:61–71. [DOI] [PubMed] [Google Scholar]
- Zhao J, Riediker M. 2014. Detecting the oxidative reactivity of nanoparticles: A new protocol for reducing artifacts. J Nanopart Res 16:2493 [DOI] [PMC free article] [PubMed] [Google Scholar]
Associated Data
This section collects any data citations, data availability statements, or supplementary materials included in this article.
Supplementary Materials
Supporting Information