Abstract
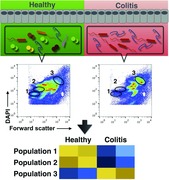
Using high‐resolution flow cytometry of bacterial shape (forward scatter) and DNA content (DAPI staining), we detected dramatic differences in the fecal microbiota composition during murine colitis that were validated using 16S rDNA sequencing. This innovative method provides a fast and inexpensive tool to interrogate the microbiota on the single‐cell level.

Keywords: Flow cytometry, IBD, Microbiota, Single‐cell analysis, T‐cell transfer colitis
For the determination of the complexity of the microbiota, we have developed an approach based on high‐resolution flow cytometric determination of bacterial forward scatter and DNA content. This analysis resolves up to 80 different populations per fecal microbiota. Individual populations are phylogenetically homogeneous and their frequencies change dramatically when monitored in the course of murine T‐cell transfer‐induced colitis. High‐resolution flow cytometry of the microbiota provides a fast and inexpensive tool for the analysis of the microbiota and offers the unique opportunity to isolate defined bacterial populations for further molecular and functional analysis.
The mammalian gut is colonized by a myriad of microbes referred to as the commensal microbiota. It has been estimated that the human intestine harbors a total number of 1013 bacteria. Recent evidence suggests that 99% of the total human microbiota are comprised of 66 species and that 75% of each individual's microbiota are composed of about 40 different species 1, 2. These bacteria are not only important for nutrient metabolism but also for the development and homeostasis of the immune system 3, 4. Pathological changes in the composition of the microbiota, known as dysbiosis, are suggested to contribute to an array of diseases including inflammatory bowel disease (IBD), arthritis, encephalitis, and cancer 5. Up‐to‐date few technologies for the determination of the composition of the microbiota exist. Classical microbiological technologies such as in vitro cultivation are confined to a few species. With the advent of high‐throughput sequencing the profiling of the commensal microbiota by 16s rDNA or metagenome sequencing has become the current standard in the field, but it is time and labor intensive 6. While sequencing can provide information on the taxonomy of the microbiota, it tends to overestimate the microbial diversity 1 and is not easy to standardize 7.
Here, we introduce a method based on the flow cytometric measurement of light scattering and DNA content to analyze the heterogeneity and dynamic changes of the intestinal microbiota. In the murine model of T‐cell transfer‐induced colitis 8, we could demonstrate that overall microbial diversity decreases and that changes in the composition of the fecal microbiota in colitis coincide with weight loss and diarrhea.
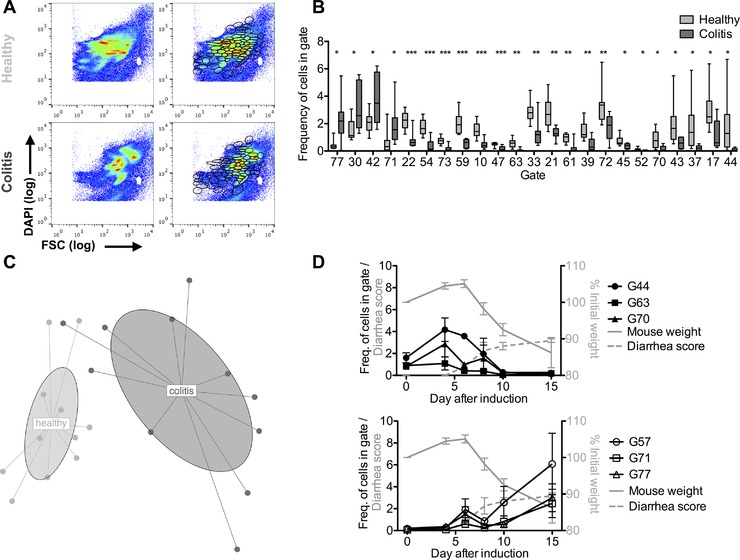
Colitis was induced by transfer of 4 × 10⁵ CD4+CD45RBhi Th cells into Rag1 −/− recipients. Colitis was characterized by weight loss, diarrhea, and histopathological changes of the colonic mucosa (Supporting Information Fig. 1). To analyze colitis‐associated changes in the composition of the microbiota at the level of single bacterial cells, fecal bacteria were harvested before induction of colitis and during established colitis, formaldehyde‐fixed, Tween‐permeabilized, stained with DAPI, and analyzed by flow cytometry. According to forward scatter (FSC) and DNA content (DAPI staining) of the fecal bacteria, discrete populations of the microbiotic community were detectable (Fig. 1A). For quantitative assessment of the changes measured by flow cytometry between the different samples, we used the cytometric barcoding (flowCyBar) approach 9 for which we defined a gate template composed of all gates occurring in any of the samples of the study (Fig. 1A, right panel and Supporting Information Fig. 2 for gating and numbering). In established colitis, the frequencies of bacteria in four gates defined by flowCyBar significantly increased, while in 19 others frequencies significantly decreased, as compared with the microbiota of the same mice before induction of colitis (Fig. 1B, Supporting Information File 2). Comparing the frequencies of bacteria in all of the 80 gates of 12 healthy and 11 colitic mice by nonmetric, multidimensional scaling allowed the unambiguous distinction between colitic and healthy mice (Fig. 1C). Similarly, using an unbiased comparison approach, the cytometric histogram image comparison (CHIC) algorithm 10, the microbiota of healthy versus colitic mice was clearly distinguishable (Supporting Information Fig. 3).
Figure 1.

Flow cytometry detects dynamic changes in the microbiota during colitis. Colitis was induced by i.v. transfer of 4 × 10⁵ CD4+ CD45RBhi T cells into Rag1−/− recipients. Fecal bacteria were stained with DAPI and analyzed by flow cytometry as detailed in the Materials and methods provided in the supplemental information. (A) Representative plots of bacterial forward scatter (FSC, x‐axis) and DNA content (DAPI, y‐axis) of the fecal microbiota in healthy mice (upper panel) and during colitis (lower panel) without (left) and with (right) electronic gates. The two white spots mark the area of the control beads, 0.5 and 1 μm diameter which were gated out electronically (See Supporting Information Fig. 2 for full gating strategy). (B) Frequencies of events in gates shown in (A) for healthy and colitic mice filtered for significantly different gates and sorted for FDR‐adjusted p‐value depicted as median and 25th/75th percentile (box) and min/max values (whiskers). Data show n = 12 healthy mice and n = 11 mice after colitis onset pooled from three independent experiments. *p < 0.05, **p < 0.01, and ***p < 0.001 by Student's t‐test for independent samples and Benjamini–Hochberg FDR adjustment. (C) Nonmetric multidimensional scaling (NMDS) plot for n = 12 healthy mice and n = 11 mice after colitis onset (same as for (A) and (B)). (D) Frequencies of fecal bacteria in selected populations analyzed at days 0, 4, 6, 8, 10, and 15 after colitis induction in four individual mice (black lines and symbols, mean ± SEM, left y‐axis). Means ± SEM of relative weight (gray line, right y‐axis) and diarrhea score (gray dashed, left y‐axis). Shown is one representative experiment of two experiments with comparable results.
Changes in the microbiota composition coincided with clinical signs of colitis, i.e. weight loss and diarrhea. Weight loss and diarrhea developed between day 6 and 10 after T‐cell transfer (Fig. 1D). The populations of gates 44, 63, and 70 started to contract at day 6 and were almost absent on day 10. Cell populations in three gates (57, 71, and 77) that were increased in established colitis, started to expand at day 6. Evidently, dysbiosis coincides with the clinical manifestation of colitis. Together, these data demonstrate that high‐resolution flow cytometry of bacterial size and DNA content allows for the rapid detection of dynamic changes of the fecal microbiota composition during colonic inflammation.
The dysbiosis was validated by the current gold standard, 16s rDNA sequencing, before and during established colitis. Similarly to the cytometric assessment, the overall microbial diversity was reduced in colitic mice, as compared with healthy mice, as indicated by a decreased Shannon index and smaller numbers of different species found in the rarefraction analysis (Supporting Information Fig. 4 and File 3).
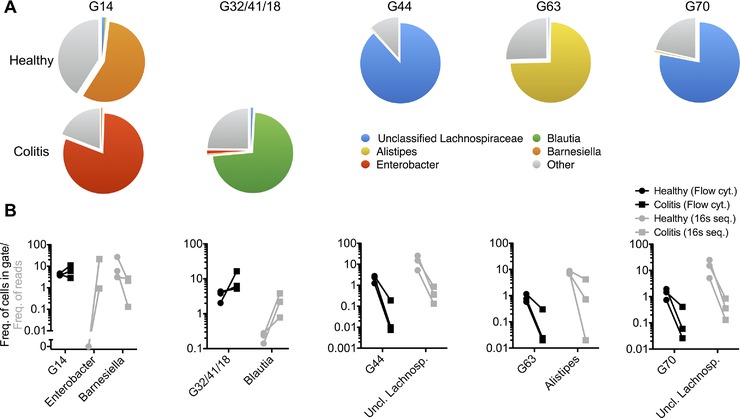
To identify the bacteria contained in distinct cytometric gates, we sorted 5 × 10⁵ bacterial cells from representative gates (Supporting Information Fig. 5) and determined their composition by 16s rDNA sequencing. As indicated in Fig. 2A, all sorted populations of the microbiota were composed to at least 50% of one single genus (Fig. 2A, Supporting Information Fig. 6 and File 3).
Figure 2.

Electronic gates comprise distinct bacterial phyla. Bacteria were sorted by FACS from the feces of n = 3 individual mice before and/or after the onset of T‐cell transfer‐induced colitis. Isolated DNA was analyzed by next‐generation sequencing and classified with the Ribosomal Database Project (RDP) as specified in the Materials and methods provided in the supplemental information. (A) 16s rDNA sequence analysis of flow‐sorted populations of fecal bacteria from n = 3 individual mice (same individuals as for Supporting Information Fig. 4) before and/or after the onset of T‐cell transfer colitis. Depicted is the phylogenetic composition of the gates as median frequencies of bacterial taxa that make up ≥ 50% of at least one of the sorted populations. (See Supporting Information Fig. 6 for detailed composition) (B) Frequencies of events in cytometric gates (black symbols) and corresponding frequencies of 16s rDNA reads (gray symbols) for the taxa identified in (A) in n = 3 individual healthy mice (filled circles) and after the onset of colitis (filled rectangles).
Gates 44 and 70, populated only in healthy mice, were composed to 88 and 78%, respectively, of Lachnospiraceae (Fig. 2A, Supporting Information File 3). Gate 63, also only populated in healthy mice, consisted to 75% of the genus Alistipes. Gates 32/41/18, populated only in colitic mice, were composed to 73% of the genus Blautia. The composition of gate 14, populated in healthy and colitic mice, changed upon induction of colitis, in that in healthy mice, 57% of the bacteria belonged to the genus Barnesiella, and after induction of colitis, 80% belonged to the genus Enterobacter.
The changes in the cytometric gates 44, 70, 63, and 32/41/18 and the overall changes of the microbiome according to 16s rDNA sequencing of healthy versus colitic mice were similar (Fig. 2B, Supporting Information Files 2 and 3). Whereas gates 44 and 70 showed a median reduction of 150‐fold and 28‐fold, respectively, their main constituting taxon unclassified Lachnospiraceae was reduced 40‐fold, according to 16s rDNA sequencing. The frequency of events in gate 63 decreased 30‐fold in colitis, while its constituting genus Alistipes was reduced ninefold in the microbiome. The 1.6‐fold expansion of events in gates 32/41/18 in colitis was paralleled by a 16‐fold increase in Blautia 16s rDNA, the prevailing genus found in that gate.
While the frequency of events in gate 14 did not differ between healthy mice and colitic mice, the changes in its composition paralleled those detectable by 16s rDNA sequencing of the entire microbiome. Enterobacter 16s rDNA increased in colitis in total fecal bacteria from below 1 to 21%. Conversely, 16s rDNA of Barnesiella, the main constituent of gate 14 in healthy mice, dropped 13‐fold in colitic microbiomes. Taken together, 16s rDNA sequencing confirmed the relative colitis‐accompanying changes in the fecal microbiota composition detected by flow cytometry.
In summary, we show here for the first time, that flow cytometry offers unique options to analyze the heterogeneity of the intestinal microbiota. We have used this cytometric approach for the profiling of the microbiota from healthy and colitic mice. We were able to discriminate up to 80 distinct populations per microbiome, most of which had a rather homogenous phylogenetic composition. When compared with the current gold standard, 16s rDNA sequencing, our flow cytometric approach revealed similar relative changes in the fecal microbiota composition upon colitis. Flow cytometry of the microbiota thus qualifies for high‐throughput clinical studies that aim at linking dynamic changes in the fecal microbiota to diagnosis and prognosis of diseases.
Conflict of interest
The authors declare no financial or commercial conflict of interest.
Supporting information
As a service to our authors and readers, this journal provides supporting information supplied by the authors. Such materials are peer reviewed and may be re‐organized for online delivery, but are not copy‐edited or typeset. Technical support issues arising from supporting information (other than missing files) should be addressed to the authors.
Supporting information
Supporting information
Supporting information
Supporting information
Acknowledgements
We are grateful to J. Kirsch and T. Kaiser, operators of the flow cytometry core facility (FCCF). This work was supported by the German Research Council (DFG SFB 633, SFB 650, SPP 1656, and GRK1121) and the European Research Council advanced grant ERC‐2010‐AdG_20100317 Grant 268987. The DRFZ is a Leibniz institute. J.Z. planned and performed the experiments, obtained samples, performed the analysis, and wrote the manuscript. T.H. prepared, acquired, and sorted the samples and, together with F.S. and J.S. analyzed the flow cytometry data. J.S. performed the hierarchical clustering and generated the NMDS plots. P.D. analyzed the 16s rDNA sequencing data. M.F. and R.G. obtained samples. A.R., S.M., B.S., and H.‐D.C. supervised the research and edited the manuscript.
References
- 1. Martínez, I. et al, PLoS ONE. 2013. 8: e69621 DOI: 10.1371/journal.pone.0069621.s009. [DOI] [PMC free article] [PubMed] [Google Scholar]
- 2. Schloissnig, S. et al, Nature 2012. 493: 45–50. DOI: 10.1038/nature11711. [DOI] [PMC free article] [PubMed] [Google Scholar]
- 3. Ramakrishna, B. S. J. Gastroenterol. Hepatol. 2013. 28: 9–17. DOI: 10.1111/jgh.12294. [DOI] [PubMed] [Google Scholar]
- 4. Hooper, L. V. et al, Science 2012. 336: 1268–1273. DOI: 10.1126/science.1223490. [DOI] [PMC free article] [PubMed] [Google Scholar]
- 5. Dzutsev, A. et al, Eur. J. Immunol. 2014. 45: 17–31. DOI: 10.1002/eji.201444972. [DOI] [PubMed] [Google Scholar]
- 6. Wu, G. D. and Lewis, J. D. Clin. Gastroenterol. Hepatol. 2013. 11: 774–777. DOI: 10.1016/j.cgh.2013.03.038. [DOI] [PMC free article] [PubMed] [Google Scholar]
- 7. Maukonen, J. et al, FEMS Microbiol. Ecol. 2011. 79: 697–708. DOI: 10.1111/j.1574-6941.2011.01257.x. [DOI] [PubMed] [Google Scholar]
- 8. Powrie, F. et al, Int. Immunol. 1993. 5: 1461–1471. [DOI] [PubMed] [Google Scholar]
- 9. Koch, C. et al, Nature Protocols 2013. 8: 190–202. DOI: 10.1038/nprot.2012.149. [DOI] [PubMed] [Google Scholar]
- 10. Koch, C. et al, Cytometry 2013. 83A: 561–567. DOI: 10.1002/cyto.a.22286. [DOI] [PubMed] [Google Scholar]
Associated Data
This section collects any data citations, data availability statements, or supplementary materials included in this article.
Supplementary Materials
As a service to our authors and readers, this journal provides supporting information supplied by the authors. Such materials are peer reviewed and may be re‐organized for online delivery, but are not copy‐edited or typeset. Technical support issues arising from supporting information (other than missing files) should be addressed to the authors.
Supporting information
Supporting information
Supporting information
Supporting information


