

Abstract
This paper quantifies the factors explaining long‐term improvements in child height for age z‐scores in Bangladesh (1996/1997–2011), India (1992/1993–2005/2006), Nepal (1997–2011) and Pakistan (1991–2013). We apply the same statistical techniques to data from a common data source from which we have extracted a set of common explanatory variables that capture ‘nutrition‐sensitive’ factors. Three are particularly important in explaining height for age z‐score changes over these timeframes: improvements in material well‐being; increases in female education; and improvements in sanitation. These factors have comparable associations across all four countries.
Keywords: chronic malnutrition, economics constraints, infant and child nutrition, international child health nutrition, low income countries, socioeconomic factors
Key messages.
In the last two decades, HAZ scores have improved by 15 – 25 percent in Bangladesh, India, Nepal and Pakistan. Three factors account for much of the observed change in HAZ in all countries: assets, women's education and reductions in open defecation. Strikingly, there is little variation in the magnitudes of the estimated coefficients across countries. India's relatively poor performance is driven by smaller changes in these variables.
Introduction
South Asia has long been synonymous with unusually high rates of child undernutrition (Ramalingaswami et al., 1997). Demographic Health Surveys from the 1990s suggested that more than half of South Asian pre‐schoolers were stunted, a rate that far exceeds that of sub‐Saharan Africa, a region substantially poorer than South Asia. These exceptionally high rates of undernutrition in South Asia have spawned substantial research into possible explanations, including intrahousehold biases (Pande, 2003, Jayachandran and Pande, 2013), low status of women (Shroff et al., 2009, Menon, 2012), early marriage and child birth (Raj et al., 2010), genetic predispositions (Nubé, 2009), low quality diets (Deaton and Dreze, 2008, Headey et al., 2012), poverty and household food insecurity (Menon, 2012), the inefficacy of nutritional programmes and strategies (Das Gupta et al., 2005, World‐Bank, 2005) and exceptionally poor sanitation (Spears, 2013, Spears et al., 2013). These studies invariably focus on explaining South Asia's lack of progress against undernutrition, even though recent decades have seen some significant increases in child growth outcomes across much of the sub‐continent, with child height for age z‐score (HAZ) improving by 15.6% to 25.6% in Bangladesh, Nepal, Pakistan and India. This progress suggests that reversing the focus of studies on South Asian nutrition – from a focus on why undernutrition is so high to a focus on why it has begun to drop – represents a potentially fruitful line of enquiry.
This encouraging trend in child nutrition provides the motivation for this paper, in which our focus is on explaining nutritional change over time. While there is a vast array of single country studies looking at associations between child, household and community characteristics and undernutrition – usually in a single cross‐section – there are no comparative studies that systematically quantify and compare the factors that might explain long‐term reductions in child undernutrition. Cross‐country comparisons are problematic to interpret when there are differences in statistical methods, data collection techniques and explanatory variables across countries. To address this concern, building on (Headey et al., 2015) and (Headey and Hoddinott, 2014), we apply the same statistical techniques to data from a common data source from which we have extracted a set of common explanatory variables that capture ‘nutrition‐sensitive’ factors: improvements in material well‐being (asset indices), expansions in female and male education, improvements in water and sanitation, demographic changes and improvements in access to health services. We use this common set of indicators to statistically explain improvements child nutrition in four South Asian countries over extended periods of time: Bangladesh (1996/1997–2011), India (1992/1993–2005/2006), Nepal (1997–2011) and Pakistan (1991–2013). Given the theme of this supplement, we focus on HAZs. Linear growth is widely regarding as the single most relevant indicator of overall nutrition with poor HAZs causally linked to a whole host of poorer later life outcomes (Hoddinott et al, 2013).
The paper is structured as follows. Section 2 outlines the data and methods used in the paper. Section 3 presents our results, while Section 4 concludes.
Data and methods
Data sources
We use Demographic Health Surveys (DHS) from four South Asian countries – Bangladesh, India, Nepal and Pakistan – to analyze long‐term nutritional change. We chose these specific South Asian countries as they have multiple DHS surveys containing data on anthropometric outcomes and a common set of explanatory variables. Details of these data sets and the surveys underlying them are found in (ICF‐International, 2015). These multi‐cluster surveys of ever‐married women of reproductive age are well suited to our purposes. They are high quality, nationally representative surveys that cover a broad range of the hypothesized drivers of nutritional change. We use all available DHS data for these countries. Specifically, we use the 1996/1997, 1999/2000, 2004, 2007 and 2011 rounds of the Bangladesh DHS, the 1996, 2001, 2006 and 2011 rounds of the Nepal DHS, the 1992/1993 and 2005/2006 rounds of the India DHS, and the 1991 and 2013 rounds of the Pakistan DHS. Note that we cannot use the 1998 Indian DHS because in this survey round, it is not possible to uniquely identify households.
Our outcome variables are HAZs for pre‐school children aged 0 to 59 months as measured against WHO growth standards that are described in de Onis et al. (2007). Table 1 presents weighted country HAZ means for the first and last round of data available to us. For all four countries, mean HAZ scores improved substantially from the 1990s to 2010s. The changes are larger in Bangladesh and Nepal (25.6% and 22.8%, respectively) than those in India and Pakistan (16.7% and 15.6%, respectively), especially in per annum terms. Indeed, (Headey et al., 2015) and (Headey and Hoddinott, 2014) find that Bangladesh and Nepal recorded two of the fastest reductions in undernutrition in the world in the 2000s.
Table 1.
Changes in the means of HAZ scores and potential explanatory factors between earliest and latest DHS: Bangladesh, India, Nepal and Pakistan
| Year | HAZ | Asset index (1‐10) | Maternal educ. (years) | Paternal educ. (years) | Four or more antenatal visits (%) | Born in a medical facility (%) | Open defecation(cluster %) | Piped water (%) | Tube well water (%) | Birth interval (years) | Number of children |
|---|---|---|---|---|---|---|---|---|---|---|---|
| Bangladesh (N = 16,279) | |||||||||||
| 1997 | −2.2 | 1.4 | 2.4 | 3.5 | 6.6 | 4.4 | 26.0 | 4.0 | 93.6 | 3.4 | 3.3 |
| 2011 | −1.6 | 3.5 | 5.3 | 4.9 | 24.0 | 24.6 | 4.8 | 10.4 | 87.7 | 4.2 | 2.5 |
| Change | 0.6 | 2.1 | 2.9 | 1.4 | 17.4 | 20.2 | −21.2 | 6.3 | −5.9 | 0.8 | −0.8 |
| Percent change (%) | −25.6 | 144.7 | 122.4 | 41.2 | 262.6 | 462.9 | −81.6 | 157.7 | −6.3 | 22.8 | −23.6 |
| Nepal (N = 9,852) | |||||||||||
| 1996 | −2.1 | 1.0 | 1.1 | 4.0 | 9.4 | 7.9 | 86.8 | 28.9 | 42.3 | 3.0 | 3.4 |
| 2011 | −1.6 | 4.0 | 3.5 | 5.6 | 48.9 | 35.0 | 48.5 | 39.4 | 43.8 | 3.4 | 2.8 |
| Change | 0.5 | 3.0 | 2.4 | 1.6 | 39.4 | 27.2 | −38.3 | 10.5 | 1.5 | 0.4 | −0.6 |
| Percent change (%) | −22.8 | 285.2 | 211.1 | 39.3 | 417.8 | 345.8 | −44.1 | 36.2 | 3.6 | 13.9 | −18.6 |
| India (N = 39,568) | |||||||||||
| 1993 | −1.9 | 2.4 | 3.4 | 5.9 | 32.0 | 29.9 | 63.5 | 35.2 | 56.4 | 3.0 | 3.1 |
| 2006 | −1.6 | 3.3 | 4.9 | 6.7 | 45.9 | 45.4 | 45.6 | 41.5 | 36.6 | 3.0 | 2.9 |
| Change | 0.3 | 1.0 | 1.6 | 0.8 | 14.0 | 15.4 | −17.9 | 6.3 | −19.8 | 0.0 | −0.2 |
| Percent change (%) | −16.7 | 41.9 | 46.2 | 13.0 | 43.7 | 51.5 | −28.2 | 18.0 | −35.1 | 1.2 | −6.9 |
| Pakistan (N = 4,865) | |||||||||||
| 1991 | −2.0 | 3.5 | 1.8 | 4.5 | 16.4 | 15.2 | 50.2 | 38.7 | 51.9 | 2.8 | 4.5 |
| 2013 | −1.7 | 5.3 | 3.5 | 5.9 | 38.4 | 49.8 | 22.1 | 32.6 | 54.1 | 2.7 | 3.9 |
| Change | 0.3 | 1.8 | 1.7 | 1.4 | 22.0 | 34.6 | −28.1 | −6.1 | 2.2 | −0.1 | −0.6 |
| Percent change (%) | −15.6 | 52.9 | 98.7 | 31.3 | 134.6 | 227.4 | −55.9 | −15.7 | 4.3 | −3.8 | −13.4 |
Source: Authors' calculations from DHS surveys.
HAZ, height for age z‐score; DHS, Demographic Health Surveys.
The explanatory variables represent several broad sources of nutritional change: changes in asset ownership, maternal schooling, paternal schooling, take up of ante‐natal care, sanitation and demographic factors. Some of the strengths and weaknesses of these indicators are discussed later.
As noted in Headey et al. (2015), one candidate for sustained nutritional change is general economic progress, which facilitates larger expenditures on food, health and other nutrition‐relevant expenditures. While the DHS does not contain information on income or expenditures, it does collect information on assets and housing characteristics. These include ownership of household durables (TV, radio, motorcycle, tables and chairs and wardrobe), housing characteristics (floor, wall and roof materials and access to electricity), house ownership and farm land ownership. The precise list of assets varies across countries. In our analysis, we use the set of assets that are recorded in all rounds for each country. Specifically, we use this information to construct an asset (or wealth) index. The weights of the different assets in this index were derived by running principal components analysis for all the pooled rounds of data available for a given country. Within each country, common weights are then used across rounds to ensure consistent measurement of asset scores over time. The index is then scaled so that it varies between 0 and 10, with 10 being the maximum score observed across all rounds in a country and zero being the minimum. The values of these indices rose by more than 100% from late 1990s to 2011 for Bangladesh and Nepal, and by around 50% for India and Pakistan (Table 1). World Bank poverty estimates also suggest that all four countries achieve substantial growth in household income and significant reductions in poverty (World‐Bank, 2013).
The rapid expansion of education, especially among women as reflected in Table 1, is another significant change in South Asia, which may well have played a role in the reductions in child undernutrition, especially where improved female schooling is correlated with reductions in early marriage and improved women's status.
Table 1 shows that all four South Asia countries made improvements in the utilization of health care. However, the DHS data do not allow us to assess whether this reflects changes in provision or changes in take up of existing services. As these healthcare variables are likely to be highly correlated with factors that cannot be completely controlled for, we also estimate models that drop these variables as a robustness test to gauge whether other coefficients in the model are sensitive to this exclusion.
We follow Spears (2013) in measuring sanitation as cluster‐level open defecation. The assumption in this approach is that any fixed point defecation is likely to be better than open defecation and that negative community level sanitation externalities are more harmful that sanitation practices within the household. Both assumptions are contestable, and we do explore sensitivity to alternative definitions. The proportion of villages engaging in open defecation declined in all four countries, with the most marked decline in Bangladesh. This large change in sanitation contrasts with the small change in access to water (Table 1).
Lastly, the DHS has rich information on demographic factors that might affect undernutrition. We include two: the number of children born to mothers and the preceding birth interval. Rationales for this selection are discussed in Headey et al. (2015).
Statistical analysis
Following Headey et al (2015), using all available survey rounds, we estimate ordinary least squares regression models to assess the associations between HAZ for a child i at time t and the covariates described earlier (X). We include additional control variables (child and maternal age dummies, location fixed effects;μ i) and trend effects represented by a vector of year dummy variables (T). The vector of coefficients (β) constitutes the set of parameters of principal interest. Adding in a white noise term (ε i,t), we represent this relationship by Equation (1):
| (1) |
Stata version 13.0 was (Stata Corp, College Station, TX, USA) used to estimate regressions equations taking the form in (1). An important assumption within Equation (1) is that the model is appropriately specified in other dimensions, particularly in terms of capturing non‐linearities in nutrition relationships. To that end, we took two steps. First, we adopted a very flexible specification of the time‐invariant determinants including monthly dummy variables to capture the progressive growth faltering process that malnourished populations undergo until around 2 years of age (Shrimpton et al., 2001, Victora et al., 2009). Second, we undertook non‐parametric graphical analyses of all time‐varying continuous variables to examine whether there exists non‐linearities in their relationships with HAZ scores (available on request). Most of the continuous explanatory variables have approximately linear relationships with HAZ scores with one important exception. Open defecation at the village level has a strikingly non‐linear relationship. In the range of 0 to 30% open defecation (approximately), the gradient is steeply negative, but thereafter, it is mostly flat, before becoming negative again for the few very high levels of open defecation. As we did in Headey et al. (2014), to capture this non‐linear relationship, we use a fractional polynomial transformation by raising this variable to the power of one‐third.
We use the estimated parameters from Equation (1) to conduct a simple decomposition analysis described by Equation (2).
| (2) |
For this analysis, we select the earliest DHS round (t = 1) and the most recent round (t = k, where k is the number of DHS surveys used for each country). This decomposition analysis entails multiplying observed changes in the means of each explanatory variable by its regression coefficient. Doing so gives the predicted change in HAZ from each change in a nutrition‐sensitive factor and thus shows the estimated contributions of each variable to changes in HAZ. For example, suppose that women's education rises by three grades between the first and last surveys for a given country, that is . Suppose also that the estimated coefficient on women's schooling, β, equals 0.025. Multiplying these together yields 0.075. This indicates that the observed changes in women's schooling over time would predict a 0.075 increase in HAZ. We can do analogous calculations for other potential drivers of nutritional change to gauge the extent to which each factor explains changes in HAZ over time, as well as how all the explanatory variables as a whole (i.e. the model) performs in explaining HAZ changes. Note, however, that a key assumption in this very simple decomposition approach is that the regression coefficients are constant over time. This contestable assumption is discussed in the results section.
Results
Results of estimating Equation (1) for all four countries are shown in Table 2. There are several striking findings.
Table 2.
Height for age z‐score regressions pooled across years for full sample
| Model | (1) Bangladesh | (2) Nepal | (3) India | (4) Pakistan |
|---|---|---|---|---|
| Asset index, 1–10 | 0.069*** | 0.047*** | 0.071*** | 0.054*** |
| (0.0067) | (0.0078) | (0.0059) | (0.0172) | |
| Maternal education (years) | 0.023*** | 0.028*** | 0.022*** | 0.032*** |
| (0.0041) | (0.0052) | (0.0028) | (0.0084) | |
| Paternal education (years) | 0.024*** | 0.018*** | 0.014*** | 0.021*** |
| (0.0034) | (0.0039) | (0.0024) | (0.0068) | |
| Four or more antenatal visits | 0.053 | 0.095** | 0.069*** | 0.137** |
| (0.032) | (0.0380) | (0.0211) | (0.0664) | |
| Born in a medical facility | 0.114*** | 0.146*** | 0.071*** | 0.254*** |
| (0.037) | (0.0475) | (0.0218) | (0.0714) | |
| Open defecation† | −0.150*** | −0.172*** | −0.165*** | −0.185* |
| (0.0417) | (0.0617) | (0.0386) | (0.101) | |
| Piped water‡ | 0.0201 | −0.149*** | −0.0790* | −0.138 |
| (0.0667) | (0.0519) | (0.0464) | (0.109) | |
| Tube well water‡ | 0.282*** | 0.198*** | −0.0239 | −0.0172 |
| (0.0763) | (0.0515) | (0.0449) | (0.0922) | |
| Birth interval | 0.049*** | 0.032*** | 0.044*** | 0.043** |
| (0.0060) | (0.0086) | (0.0057) | (0.0168) | |
| Number of children | −0.030*** | −0.022** | −0.035*** | −0.031** |
| (0.0098) | (0.0102) | (0.0068) | (0.0140) | |
| Female child | 0.005 | 0.017 | 0.041*** | 0.062 |
| (0.0205) | (0.0249) | (0.0152) | (0.0470) | |
| R‐squared | 0.183 | 0.236 | 0.175 | 0.223 |
| N | 16279 | 9852 | 39568 | 4865 |
Notes: Village‐level clustered standard errors in parentheses. *, ** and *** indicate significance at 10%, 5% and 1% levels, respectively. The regressions earlier include a number of time‐variant controls, including regional fixed effects, year fixed effects, month‐specific child age dummy variables and dummy variables for various categories of maternal age.
‘Open defecation’ is measured as a cubic fraction for Bangladesh and Pakistan to capture the non‐linear relationships observed in the non‐parametric graphs (otherwise linear).
‘Piped water’ and ‘Tube well water’ is measured as a cubic fraction for all countries except for India to capture the non‐linear relationships observed in the non‐parametric graphs (otherwise linear).
First, a number of explanatory variables have statistically significant associations with HAZ in all four countries. These include the asset score, maternal schooling, paternal schooling, being born in a medical facility, open defecation, birth intervals and number of children.
Second, there is little variation in the magnitudes of the estimated coefficients across countries. For example, an additional year of maternal schooling improves HAZ by 0.022 standard deviations (SD) in India, 0.023 SD in Bangladesh, 0.028 SD in Nepal and 0.032 SD in Pakistan. We see that reductions in open defecation having equally strong associations across all countries. We also see equally sized impacts for our asset index (ranging from 0.047 to 0.071). Similar associations across countries are also found for paternal schooling (from 0.014 to 0.024), birth intervals (from 0.032 to 0.049) and number of children (from −0.022 to −0.035).
Third, greater variation is seen in the associations between HAZ and access to health care. It is possible that this results from differences in quality of care, something we cannot observe in these data. Or it may be that demand for health care is often driven by other factors in the model, such as the asset index or parental education.
Lastly, the variable denoting the sex of the child is insignificant in three countries (Bangladesh, Nepal and Pakistan), and in the fourth (India), the estimated coefficient shows a positive association between being a girl and HAZ.
Results from the decomposition analysis are shown in Fig. 1. The vertical axis is HAZs, and so the height of the bars shows the estimated impact of changes in the explanatory variable on HAZ over time. So, for example, the value of 0.14 for assets in Bangladesh tells us that changes in asset holdings in Bangladesh between 1996/1997 and 2011 yield an estimated 0.14 SD improvement in HAZ. Looking across all countries, we see three factors account for much of the observed change in HAZ: assets, women's education and reductions in open defecation. In Pakistan and to a lesser extent Nepal, improvements in access to health care (four or more antenatal visits plus being born in a health facility) are also estimated to lead to sizeable changes in HAZ. India's relatively poor performance is driven heavily by smaller changes in assets, maternal education and open defecation relative to these other countries. Also of note – but not directly discernible from Fig. 1 – is that most of these models do a relatively good job of explaining total HAZ change over time. The share of total estimated HAZ change (from all X variables) to actual HAZ change varies from 52% in India, 65% in Bangladesh and 84% in Nepal. In Pakistan, the model explains 21% more HAZ change than is actually observed in practice, most likely because of the exceptionally large coefficients on health service indicators observed in the Pakistan regression model in Table 2. It may be that these coefficients are biased upwards because of some form of model misspecification.
Figure 1.
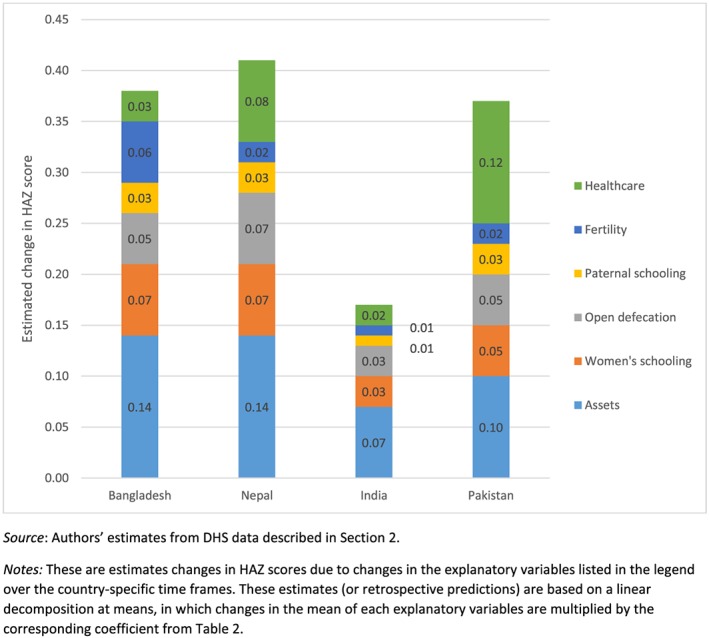
Estimated contributions of selected factors to changes in height for age z‐score (HAZ). Source: Authors' estimates from Demographic Health Surveys data described in Section 2. Notes: These are estimates changes in HAZ scores due to changes in the explanatory variables listed in the legend over the country‐specific time frames. These estimates (or retrospective predictions) are based on a linear decomposition at means, in which changes in the mean of each explanatory variables are multiplied by the corresponding coefficient from Table 2.
These regression and decomposition results are based on pooling DHS data across years. We estimated these models separately by year and tested to see whether coefficients were stable over time. In the vast majority of cases, we could not reject the null that there were no changes in parameter values (results available on request). As a robustness check, we re‐calculated our decompositions using coefficients from the first and last DHS surveys in each country; doing so does not change the pattern of results found in Fig. 1.
We also conducted additional robustness checks. We re‐estimated Equation (1) using stunting and severe stunting as the dependent variables. Doing so provides similar results to those reported in Table 2. Specifically, improvements in asset holdings, maternal schooling and reductions in open defecation all lead to statistically significant improvements in children's nutritional status, and the magnitudes of these associations are similar across countries. We experimented with the functional form specification of our control variables, such as maternal and child age, but doing so does not affect our findings. Adding other control variables, including access to vaccinations and additional fertility‐related controls, does not materially affect our findings.
Lastly, we estimated models that excluded indicators of healthcare and demographic variables, on grounds that these might be potentially endogenous; for example, they might primarily be a function of assets and education. We find that excluding health and fertility variables lead to increases in the coefficients on the asset index and maternal education variable but that the magnitudes remain comparable across countries. If we exclude the health and demographic variables, asset accumulation and maternal education account for more than three fourths of the predicted change.
Discussion
In this paper, we systematically quantify and compare the factors that might explain long‐term reductions in child undernutrition in four south Asian countries: Bangladesh, India, Nepal and Pakistan. We find that the same explanatory variables have statistically significant associations with HAZ in all four countries: assets, maternal schooling, paternal schooling, being born in a medical facility, open defecation, birth intervals and number of children. Strikingly, there is little variation in the magnitudes of the estimated coefficients across countries. Moreover, assets, women's education and reductions in open defecation account for much of the observed change in HAZ in all countries. The models also do well in accounting for aggregate change in HAZ scores across countries.
These findings confirm the multidimensional nature of nutritional change and the important role of nutrition‐sensitive sectors, including broader economic development, education (particularly for girls), sanitation (and like also water and hygiene, although the former is not measured well and latter not measured at all), health and family planning. The statistical results imply that rapid nutritional change at a national level requires substantial progress in most if not all of these sectors, along with nutrition‐specific interventions that are clearly important (Black et al., 2013), but not measured in our model. This finding also has important implications for nutritional monitoring. One implication is that monitoring ought to cover a broader range of socioeconomic variables (rather than a narrower focus on nutrition‐specific factors). Another is that this kind of decomposition analysis could be used to diagnose potential determinants of undernutrition in any given setting, in order to prioritize policies and investments for reducing undernutrition. For example, high rates of open defecation relative to income and education levels – which is common enough in many parts of India – would be an obvious red flag.
The importance of asset accumulation in explaining HAZ outcomes is particularly interesting given the controversies surrounding the nutritional impacts of economic growth, particularly in India (Subramanyam et al., 2011). However, economic growth is typically measured as changes in GDP per capita, which is widely known to be an imperfect indicator of economic development both for conceptual and measurement reasons. Indeed, even poverty estimates based on household survey data have been hotly contested in the Indian context (Deaton and Dreze, 2002). In Table 1, we observed that India (42%) and Pakistan (53%) had much smaller growth rates in their respective asset indices than Bangladesh (145%) and Nepal (285%). In contrast, World Bank (2013) estimates suggest that Nepal (81%) and Pakistan (57%) had the fastest growth in household income over these same periods, distantly followed by India (33%) and Bangladesh (23%). Hence, the Indian paradox of rapid economic growth with slower improvements in child nutrition could partly be due to national accounts and household surveys overstating the extent of progress in material well‐being. Strikingly, India also made much less progress on other variables that had significant associations in these regressions, notably women's education, sanitation and access to health services. This much weaker progress likely relates to India's well‐known problems of public service delivery in these sectors (Jha and Laxminarayan, 2009, Patil et al., 2014), but also to the much smaller role of non‐governmental organizations in India (certainly when compared with Bangladesh and Nepal). Hence, the model quite accurately predicts less nutritional change in India relative to Bangladesh and Nepal, especially.
Our study has limitations. Our data are observational so are results should not be interpreted as causal; rather, our focus is on the ability of these factors to explain observed changes in stunting over time. Causal estimates can only be assured by experimental designs, although experiments on large scale income, education or sanitation programmes are very costly and often infeasible. Hence, our observational analysis complements the more experimental evaluations of nutritional programmes. Another limitation is that the need for comparability in model specification constrains us to include only those variables that appear in DHS surveys in all countries. So, for example, we cannot include maternal height because while it is available in all rounds for some countries (such as Bangladesh), it is not available in all rounds for other countries. Also, several of our covariates, such as assets, are ‘black box’ determinants of undernutrition, meaning that we can estimate associations between these variables and HAZ, but our data cannot tell us why such associations exist.
Set against these weaknesses are several study strengths, most notably the application of the same statistical techniques to national level data from a common data source from which we have extracted a set of consistently measured explanatory variables. Furthermore, our results are robust to a variety of checks, all of which consistently point to some common and very plausible drivers of nutritional change in South Asian countries.
Conflicts of interest
The authors declare that they have no conflicts of interest.
Contributions
DH and JH designed the study. SP led the statistical analysis with support from DH and JH. All authors contributed to data interpretation and manuscript writing and have read and approved the final submission.
Source of Funding
This paper is a product of the research consortium Transform Nutrition and is funded by UK aid from the UK government.
Headey, D. , Hoddinott, J. , and Park, S. (2016) Drivers of nutritional change in four South Asian countries: a dynamic observational analysis. Maternal & Child Nutrition, ????: 210–218. doi: 10.1111/mcn.12274.
The copyright line for this article was changed on 25 July 2019 after original online publication.
References
- Black R.E., Victora C.G., Walker S.P., Bhutta Z.A., Christian P., De Onis M. et al. (2013) Maternal and child undernutrition and overweight in low‐income and middle‐income countries. The Lancet 382, 427–451. [DOI] [PubMed] [Google Scholar]
- Das Gupta M., Lokshin M., Gragnolati M. & Ivaschenko O. 2005. Improving child nutrition outcomes in India: can the integrated child development services be more effective? [Online]. Policy Research Working Paper Series No. 3647. Washington DC: The World Bank. Available: http://ideas.repec.org/p/wbk/wbrwps/3647.html
- De Onis M., Garza C., Onyango A.W. & Borghi E. (2007) Comparison of the WHO child growth standards and the CDC 2000 growth charts. The Journal of Nutrition 137, 144–148. [DOI] [PubMed] [Google Scholar]
- Deaton A. & Dreze J. (2002) Poverty and inequality in India: a Re‐examination. Economic and Political Weekly, September 7, 3729–3748. [Google Scholar]
- Deaton A. & Dreze J. (2008) Food and nutrition in India: facts and interpretations. Economic and Political Weekly, XLIV, 42–65. [Google Scholar]
- Headey, D. & Hoddinott, J. 2014. Understanding the rapid reduction of undernutrition in Nepal, 2001‐2011 [Online]. Discussion Paper No. 01384. THE INTERNATIONAL FOOD POLICY RESEARCH INSTITUTE (IFPRI), Washington DC. Available: http://www.ifpri.org/publication/understanding-rapid-reduction-undernutrition-nepal-2001-2011
- Headey D., Chiu A. & Kadiyala S. (2012) Agriculture's role in the Indian enigma: help or hindrance to the malnutrition crisis? Food Security 4, 87–102. [Google Scholar]
- Headey D., Hoddinott J., Ali D., Tesfaye R. & Dereje M. (2015) The other asian enigma: explaining the rapid reduction of undernutrition in Bangladesh. World Development 66, 749–761. [Google Scholar]
- Hoddinott J., Maluccio J., Behrman J., Martorell R, Melgar P., Quisumbing A., Ramirez‐Zea M., Stein A. & Yount K. 2013. Adult consequences of growth failure in early childhood. American Journal of Clinical Nutrition 98, 1170–1178. [DOI] [PMC free article] [PubMed] [Google Scholar]
- ICF‐INTERNATIONAL (2015) The Demographic and Health Surveys Program.
- Jayachandran S. & Pande R. (2013). Why Are Indian Children Shorter Than African Children? [Online]. Department of Economics Working Paper. Harvard University, Cambridge MA: Available: http://www.hks.harvard.edu/fs/rpande/papers/Indianchildrenheight.pdf [Google Scholar]
- Jha P. & Laxminarayan R. (2009) Choosing Health: An Entitlement for all Indians. Centre for Global Health Research: Toronto. [Google Scholar]
- Menon P. (2012) Childhood undernutrition in south Asia: perspectives from the field of nutrition. CESifo Economic Studies 58(2), 274–295. [Google Scholar]
- Nubé M. (2009) The Asian enigma: predisposition for low adult BMI among people of South Asian descent. Public Health Nutrition 12, 507–516. [DOI] [PubMed] [Google Scholar]
- Pande R. (2003) Selective gender differences in childhood nutrition and immunization in rural India: the role of siblings. Demography 40, 395–418. [DOI] [PubMed] [Google Scholar]
- Patil S.R., Arnold B.F., Salvatore A.L., Briceno B., Ganguly S., Colford J.M. JR. et al. (2014) The effect of India's total sanitation campaign on defecation behaviors and child health in rural Madhya Pradesh: a cluster randomized controlled trial. PLoS Medicine 11, e1001709. [DOI] [PMC free article] [PubMed] [Google Scholar]
- Raj A., Saggurti N., Winter M., Labonte A., Decker M., Balaiah D. & Silverman J. (2010). The effect of maternal child marriage on morbidity and mortality of children under 5 in India: Cross sectional study of a nationally representative sample. British Medical Journal, 340, b4258. [DOI] [PMC free article] [PubMed] [Google Scholar]
- Ramalingaswami V., Jonson U. & Rohde J. (1997) The Progress of Nations In: The Asian Enigma. UNICEF: New York. [Google Scholar]
- Shrimpton R., Victora C.G., DE ONIS M., Costa Lima R., Blössner M. & Clugston G. (2001) The worldwide timing of growth faltering: implications for nutritional interventions. Pediatrics, e75. [DOI] [PubMed] [Google Scholar]
- M. Shroff, P. Griffiths, L. Adair, C. Suchindran & M. Bentley (2009). Maternal autonomy is inversely related to child stunting in Andhra Pradesh, India. Maternal and Child Nutrition, 5(1), 64-74. [DOI] [PMC free article] [PubMed] [Google Scholar]
- Spears D. (2013) How Much International Variation in Child Height can Sanitation Explain? [Online]Working paper. Princeton University, NJ. [Google Scholar]
- Spears D., Ghosh A. & Cumming O. (2013) Open defecation and childhood stunting in India: an ecological analysis of new data from 112 Districts. PLoS ONE 8, e73784. [DOI] [PMC free article] [PubMed] [Google Scholar]
- Subramanyam M.A., Kawachi I., Berkman L.F. & Subramanian S.V. (2011) Is economic growth associated with reduction in child undernutrition in India? PLoS Medicine 8, 424–437. [DOI] [PMC free article] [PubMed] [Google Scholar]
- Victora C.G., De Onis M., Curi Hallal P., Blössner M. & Shrimpton R. (2009) Worldwide timing of growth faltering: revisiting implications for interventions. Pediatrics 2010, 473–480. [DOI] [PubMed] [Google Scholar]
- WORLD‐BANK (2005) Bangladesh Integrated Nutrition Project: Project Performance Assessment Report. Report No. 32563. World Bank: Washington Dc. [Google Scholar]
- WORLD‐BANK (2013) PovCalNet. The World Bank. [Google Scholar]