Abstract
Cisplatin is an effective anticancer drug; however, cisplatin use often leads to nephrotoxicity, which limits its clinical effectiveness. In this study, we determined the effect of dichloroacetate, a novel anticancer agent, in a mouse model of cisplatin-induced AKI. Pretreatment with dichloroacetate significantly attenuated the cisplatin-induced increase in BUN and serum creatinine levels, renal tubular apoptosis, and oxidative stress. Additionally, pretreatment with dichloroacetate accelerated tubular regeneration after cisplatin-induced renal damage. Whole transcriptome sequencing revealed that dichloroacetate prevented mitochondrial dysfunction and preserved the energy-generating capacity of the kidneys by preventing the cisplatin-induced downregulation of fatty acid and glucose oxidation, and of genes involved in the Krebs cycle and oxidative phosphorylation. Notably, dichloroacetate did not interfere with the anticancer activity of cisplatin in vivo. These data provide strong evidence that dichloroacetate preserves renal function when used in conjunction with cisplatin.
Keywords: acute renal failure, cisplatin nephrotoxicity, renal protection
Cis-diamminedichloroplatinum (cisplatin; CP) has proven to be a highly effective chemotherapeutic drug against a wide range of cancers. It is a mainstay for the treatment of bladder, cervix, head and neck, esophageal, and small cell lung cancer, among others,1,2 and more recently in the treatment of triple-negative breast cancers.3 Unfortunately, its therapeutic effectiveness is limited due to the manifestation of severe side effects in normal tissues, primarily nephrotoxicity, which occurs in up to one-third of patients undergoing CP therapy.2,4 Patients exhibit a progressive decline in renal function after a single dose of CP that is characterized by a decreased GFR and increased serum creatinine, urea, sodium, and potassium levels.5 The antineoplastic effect of CP has been principally ascribed to its ability to form intra- and interstrand DNA crosslinks that interfere with DNA replication and synthesis, and lead to cell death.6 Multiple pathways mediate CP-induced nephrotoxicity, but a complete understanding of the mechanisms involved and how they cooperate to cause renal failure have remained elusive. CP primarily targets proximal renal tubular cells ultimately causing their death via mechanisms that involve the induction of inflammation,7 oxidative stress,8 mitochondrial dysfunction,9,10 formation of nephrotoxins,11 intrinsic and extrinsic apoptotic pathways,12,13 cell-cycle perturbations,14 and DNA damage signaling.15,16 The discovery of novel approaches to prevent nephrotoxicity during CP chemotherapy is, therefore, a high priority in order to increase the clinical utility of this drug.
A resurgence of interest in cancer bioenergetics has established that the reprogramming of tumor cell metabolism to a glycolytic phenotype (the “Warburg Effect”) represents a cause and not a consequence of carcinogenesis, and is associated with apoptosis resistance.17 By inhibiting pyruvate dehydrogenase kinase, thereby activating pyruvate dehydrogenase (PDH), and directing energy metabolism through the Krebs cycle, dichloroacetate (DCA) reverses the glycolytic phenotype in in vitro and in vivo settings, sensitizing cancerous cells to apoptotic stimuli.18–22 DCA therefore has considerable potential as a novel anticancer agent. A number of clinical trials assessing the potential anti-cancer properties of DCA are in progress (www.clinicaltrials.gov; trials NCT01163487, NCT00566410, and NCT01386632). It is therefore highly likely that DCA will be used in combination with other well established anticancer drugs. Consequently, it is crucial to determine the effects DCA has on the anticancer activity and off-target toxicities of existing frontline anticancer drugs. In this study, we sought to determine what influence DCA potentially had on the antineoplastic and nephrotoxic effects of one of the most common anticancer drugs, CP.
Results
DCA Attenuates CP-Induced Renal Injury
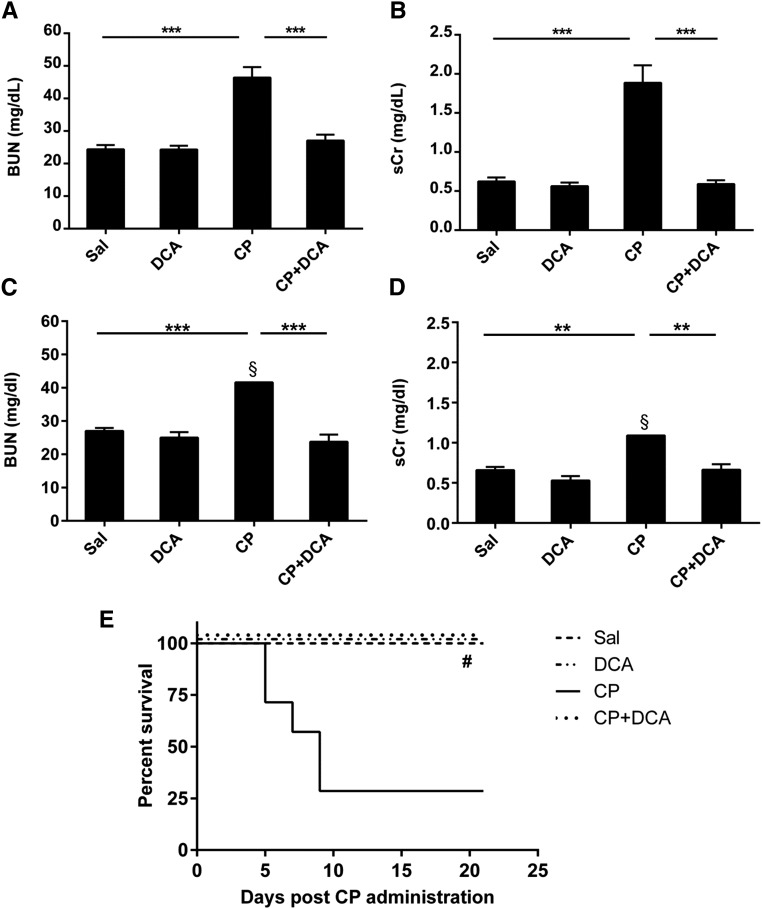
To examine the renal damage induced by CP and any potential effect of DCA on CP-induced nephrotoxicity, the severity of renal dysfunction was assessed by measurement of the levels of BUN (Figure 1A) and serum creatinine (sCr) (Figure 1B) in mice treated with DCA, CP, or both, as described in the CP-induced AKI section of the Concise Methods. The significant increases in both these toxicity markers caused by CP were completely prevented in the CP–DCA cotreated mice. Similar results were obtained in mice pretreated with DCA for only 1 day prior to CP, and in mice that were only pretreated with DCA and not cotreated during CP administration (data not shown). In a separate experiment, mice were treated as described in the CP-induced AKI section of the Concise Methods, but were observed for 21 days post CP administration. CP sustained increases in both BUN and sCr even at this later time point, and DCA cotreatment significantly attenuated the CP-induced increases in both BUN (Figure 1C) and sCr (Figure 1D). Mortality was also assessed in this experiment and it was demonstrated that the high proportion of mortality in the CP-only group (75%) was completely prevented in the CP–DCA cotreated group (Figure 1E).
Figure 1.
Effect of DCA on sCr, BUN, and mortality in CP-induced AKI. Mice were treated with sal, DCA, CP, or CP and DCA, as outlined in the CP-induced AKI model section in the Concise Methods. The mice were sacrificed 72 hours after CP administration and levels of (A) BUN and (B) sCr were determined. Results are expressed as mean±SEM, n=8 animals per group. ***P<0.001. For (C), (D), and (E), mice were treated with sal, DCA, CP, or CP and DCA as outlined in the CP-induced AKI model section in the Concise Methods, but were observed for 21 days post CP administration. At this time point, BUN (C) and sCr (D) were determined. Mortality was also assessed up to day 21 post CP administration (E). Results are expressed as mean±SEM, n=8 animals per group. §Measurements conducted on remaining mice. ***P<0.001; **P<0.01; *P<0.05; #P<0.05 CP versus CP+DCA, CP versus Sal and CP versus DCA by log-rank test.
DCA Ameliorates CP-Induced Renal Morphologic Damage
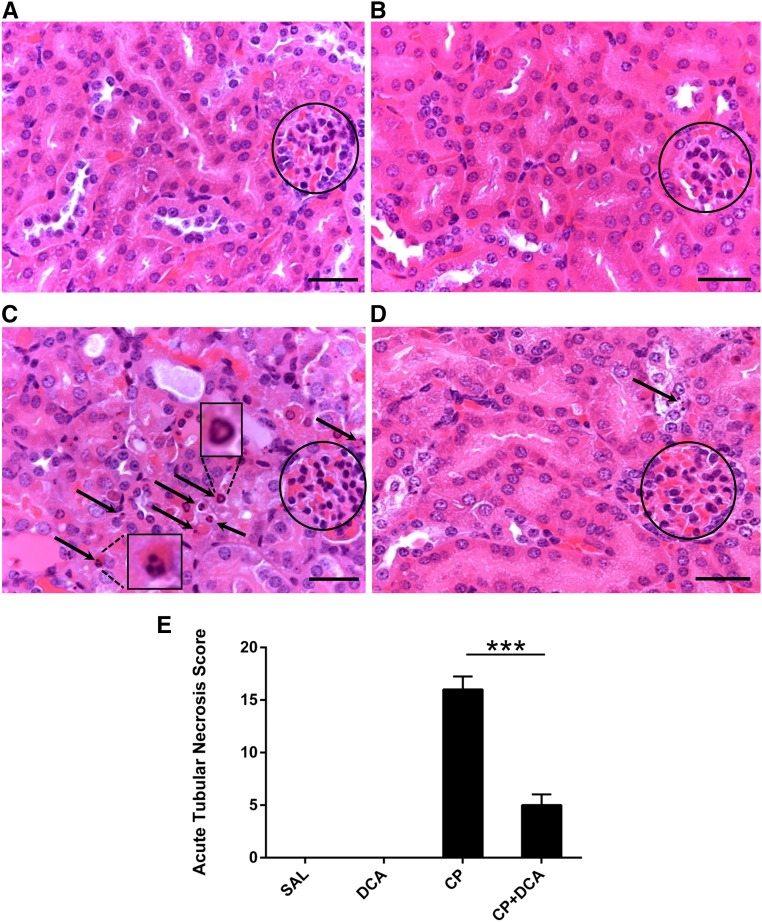
To assess renal tissue damage histologically, hematoxylin and eosin-stained sections of kidney specimens were prepared from mice 72 hours post CP administration. Whereas the normal saline (sal)- (Figure 2A) and DCA-only (Figure 2B) groups exhibited normal renal morphology, kidneys from CP-treated mice exhibited features of acute damage to the tubules (Figure 2). The most marked changes were in the proximal tubules, characterized by numerous apoptotic bodies, as well as individual necrotic cells. CP–DCA cotreated mice were almost completely protected from renal tubular damage, with only the occasional cell displaying nuclei with apoptotic morphology (Figure 2D). Pathologic features were also graded to derive an acute tubular necrosis (ATN) score for each treatment group (Figure 2E), which demonstrated that DCA conferred significant protection to the kidneys of mice challenged with CP.
Figure 2.
DCA prevents CP-induced renal morphologic changes. Representative photomicrographs (magnification ×630) of hematoxylin and eosin staining in paraffin-embedded kidney sections 72 hours after CP administration from mice treated with (A) saline, (B) DCA, (C) CP, or (D) CP and DCA, as outlined in the CP-induced AKI model section in the Concise Methods. Circles indicate glomeruli. Arrows indicate condensed nuclei of apoptotic proximal tubule cells. Insets in (C) show detail of apoptotic nuclei. Bar=50 µm. (E) ATN scoring of histopathologic features in kidney sections. The scoring system is outlined in the Concise Methods. Results are expressed as mean±SEM, n=6 animals per group. ***P<0.001.
DCA Ameliorates CP-Induced Renal Apoptosis
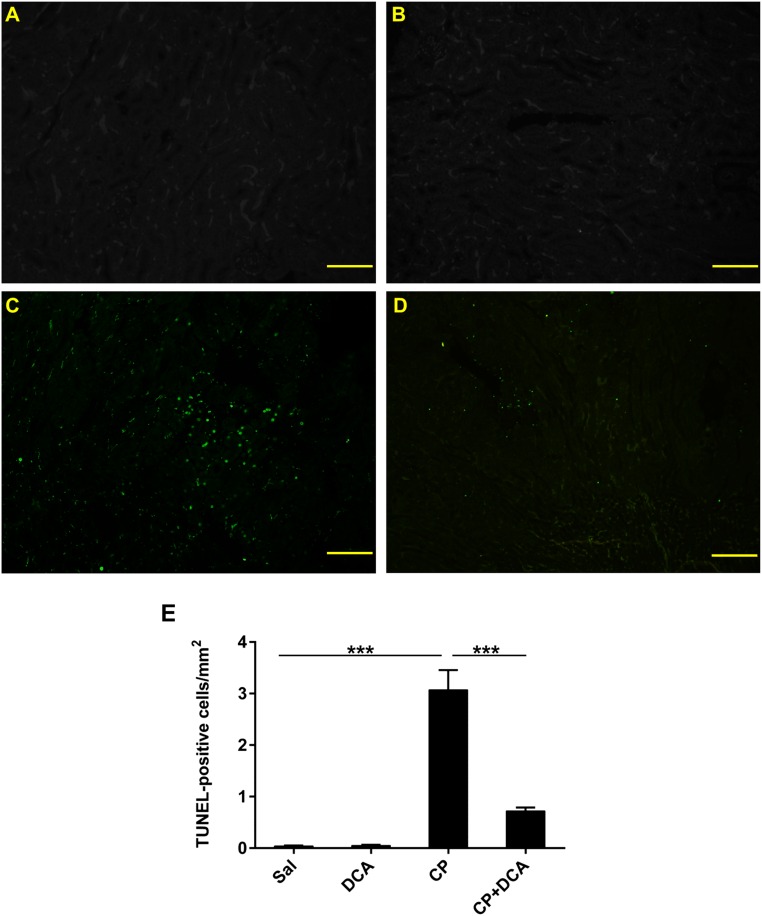
Programmed cell death plays a major role in CP-induced nephrotoxicity.23–25 Apoptosis in the kidney was assessed using the terminal deoxynucleotidyl transferase–mediated dUTP nick-end labeling (TUNEL) assay on kidney sections, which assesses DNA fragmentation as an index of apoptosis in vivo. Compared with the sal- (Figure 3A) and DCA-only groups (Figure 3B) in which no TUNEL-positive nuclei were present, CP significantly increased the number of apoptotic nuclei (Figure 3C). DCA cotreatment significantly decreased the number of TUNEL-positive cells (Figure 3, D and E), indicating that DCA confers potent antiapoptotic properties in the kidneys of CP-treated mice.
Figure 3.
DCA decreases renal cell apoptosis in CP-induced AKI. Representative photomicrographs (magnification ×100) of TUNEL staining in the kidneys of mice treated with (A) sal, (B) DCA, (C) CP, and (D) CP and DCA, as outlined in the CP-induced AKI model section in the Concise Methods, 72 hours after CP administration. Green fluorescent staining indicates TUNEL-positive nuclei. Bar=100 µm. (E) Quantitative analysis of TUNEL-positive cells. Results are expressed as mean±SEM, n=8 animals per group. ***P<0.001.
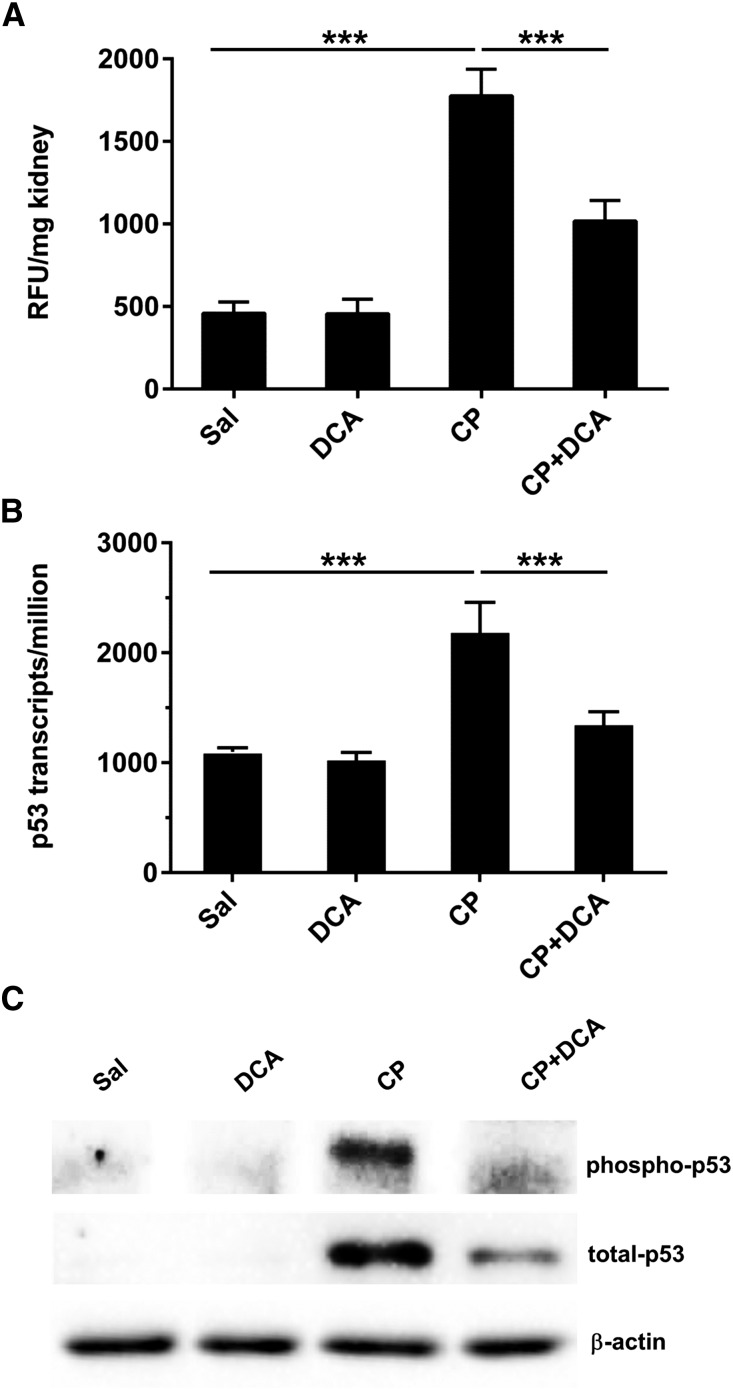
The renal activity of caspase 3, an executioner caspase that plays a major role in mediating cell death during CP-induced nephrotoxicity,26 was increased significantly in mice administered CP (Figure 4A). DCA cotreatment significantly decreased cleaved caspase 3 activity providing strong evidence that DCA attenuates cell death by attenuating apoptotic signaling.
Figure 4.
DCA attenuates CP-induced p53-mediated apoptotic signaling. Mice were treated with sal, DCA, CP, or CP and DCA, as outlined in the CP-induced AKI model section in the Concise Methods. (A) Renal caspase 3 activity expressed as mean±SEM, n=6 animals per group. (B) Transcript levels of trp53 in the kidneys, derived from transcriptome data, expressed as trp53 transcripts per million. Results are expressed as mean±SEM, n=3 animals per group. (C) Representative immunoblot of kidney lysates for phospho-p53 (Ser15) and total p53 with β‑actin indicating equal protein loading. ***P<0.001; **P<0.01. RFU, random fluorescence units.
CP-induced genotoxic stress induces p53 expression and phosphorylation in proximal tubule cells, which activates caspases, induces key proapoptotic genes and cell death.12,15 CP induced renal p53 transcription (Figure 4B), total, and phospho(ser15)-p53 levels (Figure 4C). DCA cotreatment abolished the CP-mediated induction of p53 transcription and p53 phosphorylation, and significantly reduced p53 protein levels. Therefore, DCA attenuates CP-induced p53-mediated proapoptotic signaling.
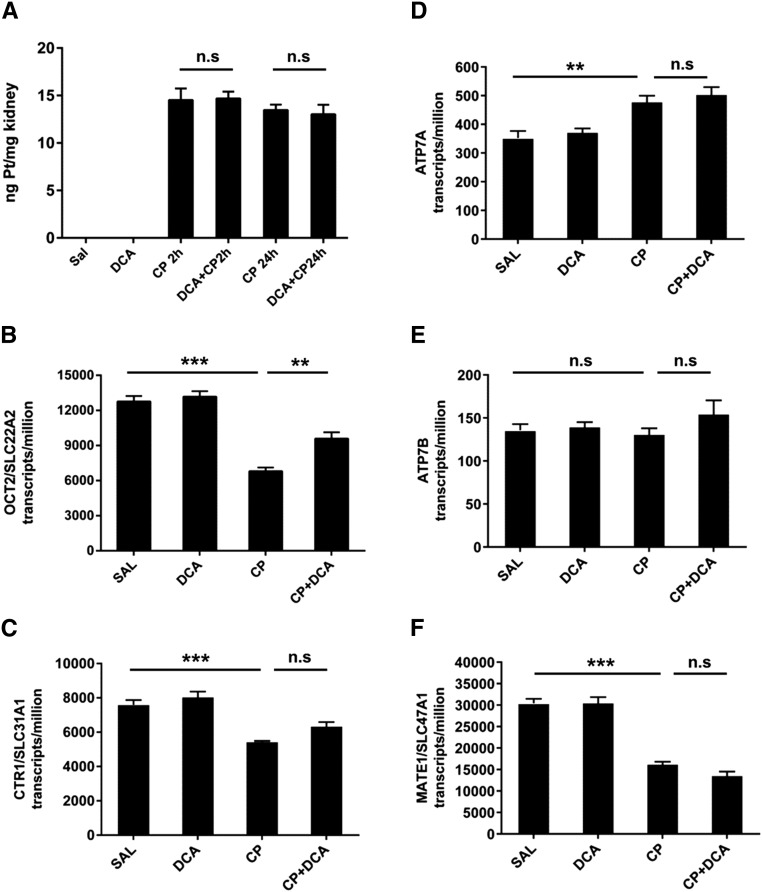
In rodent models, renal CP levels peak at or prior to 2 hours post CP administration after which the levels fall and stabilize.27–29 To examine the possibility that DCA mediates nephroprotection by decreasing CP in the kidney, renal platinum levels 2 and 24 hours after CP administration were determined. Compared with CP only–treated mice, DCA cotreatment did not alter the platinum level in the kidney at either of these time points (Figure 5A). The transcript levels of the transporters involved in CP importation, OCT2/SLC22A2,30 and CTR1/SLC31A131 were reduced 24 hours after CP administration, with DCA cotreatment increasing the expression of OCT2/SLC22A2 (Figure 5, B and C). Transporters that contribute to CP efflux, ATP7A, ATP7B,32 and MATE1/SLC49A133 were increased, remained unchanged, or were reduced by CP, respectively (Figure 5, D–F). DCA did not further alter these expression patterns. Therefore, DCA does not influence renal platinum levels during the critical 24-hour period after CP administration and does not alter the expression of CP transporters to an extent that would result in increased renal CP.
Figure 5.
DCA nephroprotection is not mediated by reduced renal CP levels or by transcriptional changes in CP transporters. Mice were treated with sal, DCA, CP, or CP and DCA, as outlined in the CP-induced AKI model section in the Concise Methods. (A) Renal platinum levels were measured in the kidneys of mice by ICP‑MS 2 and 24 hours after CP administration. Results are expressed as mean±SEM, n=8 animals per group. Transcript levels of (B) OCT2/SLC22A2, (C) CTR1/SLC31A1, (D) ATP7A, (E) ATP7B, and (F) MATE1/SLC49A1 in the kidneys, derived from transcriptome data (Supplemental Table 1), expressed as transcripts per million, from kidneys of mice treated with sal, DCA, CP, or CP and DCA, 24 hours after CP administration. Results are expressed as mean±SEM, n=3 animals per group. ***P<0.001; **P<0.01. NS, not significant.
DCA Prevents CP-Induced Inhibition of ATP-Generating Pathways and Renal ATP Levels
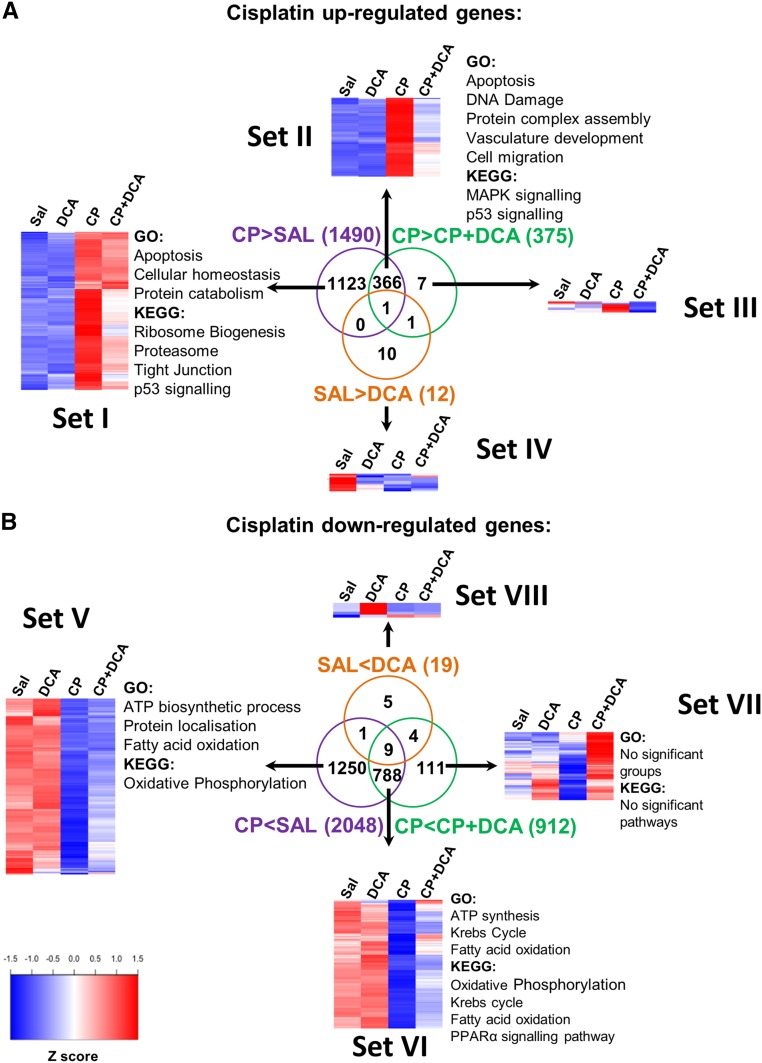
In order to gain a global perspective of the gene expression changes that contribute to DCA-mediated nephroprotection during CP-induced nephrotoxicity, whole transcriptome sequencing was conducted on the kidneys of mice treated with saline, DCA, CP, or both CP and DCA. Compared with sal-treated mice, CP upregulated the transcription of 1490 genes (Figure 6A Sets I and II; Supplemental Table 1). These genes are principally involved in apoptotic and ribosome biogenesis pathways. The upregulation of 367 (24.5%) of these genes was significantly inhibited by cotreatment with DCA (Set II) and these primarily included genes involved in apoptosis, DNA damage response, p53, and MAPK signaling pathways (Figure 6A and Supplemental Table 2). Compared with sal-treated mice, CP downregulated the transcription of 2048 genes (Figure 6B Sets V and VI; Supplemental Table 1). These genes are involved in aerobic respiration, ATP synthesis, and fatty acid oxidation pathways (Figure 6B and Supplemental Table 2). DCA significantly prevented the downregulation of 797 (38.9%) of these CP-induced genes (Set VI). This set was significantly enriched in genes involved in ATP-producing pathways (Figure 6B; Supplemental Table 2). Few significant changes were seen with DCA alone (Sets IV and VIII).
Figure 6.
Whole transcriptome sequencing reveals that DCA preserves energy-generation pathways and prevents cell death in CP-induced AKI. Mice were treated with sal, DCA, CP, or CP and DCA, as outlined in the CP-induced AKI model section in the Concise Methods. Twenty-four hours after CP administration, total RNA was extracted from kidneys and whole-transcriptome sequencing was performed. The overlap between genes significantly induced (A) or repressed (B) by CP and those genes within these groups significantly affected by DCA are shown. Pathways and biologic processes significantly enriched in the different subgroups are listed. Heat maps show the scaled average expression from three mice per treatment group. A false discovery rate cut-off of <0.05 was used for determining differential gene expression. A false discovery rate cut-off of <0.25 was used for determining Gene Ontology (GO) biologic processes and Kyoto Encyclopedia of Genes and Genomes (KEGG) pathway enrichment. Blue, low expression; Red, high expression.
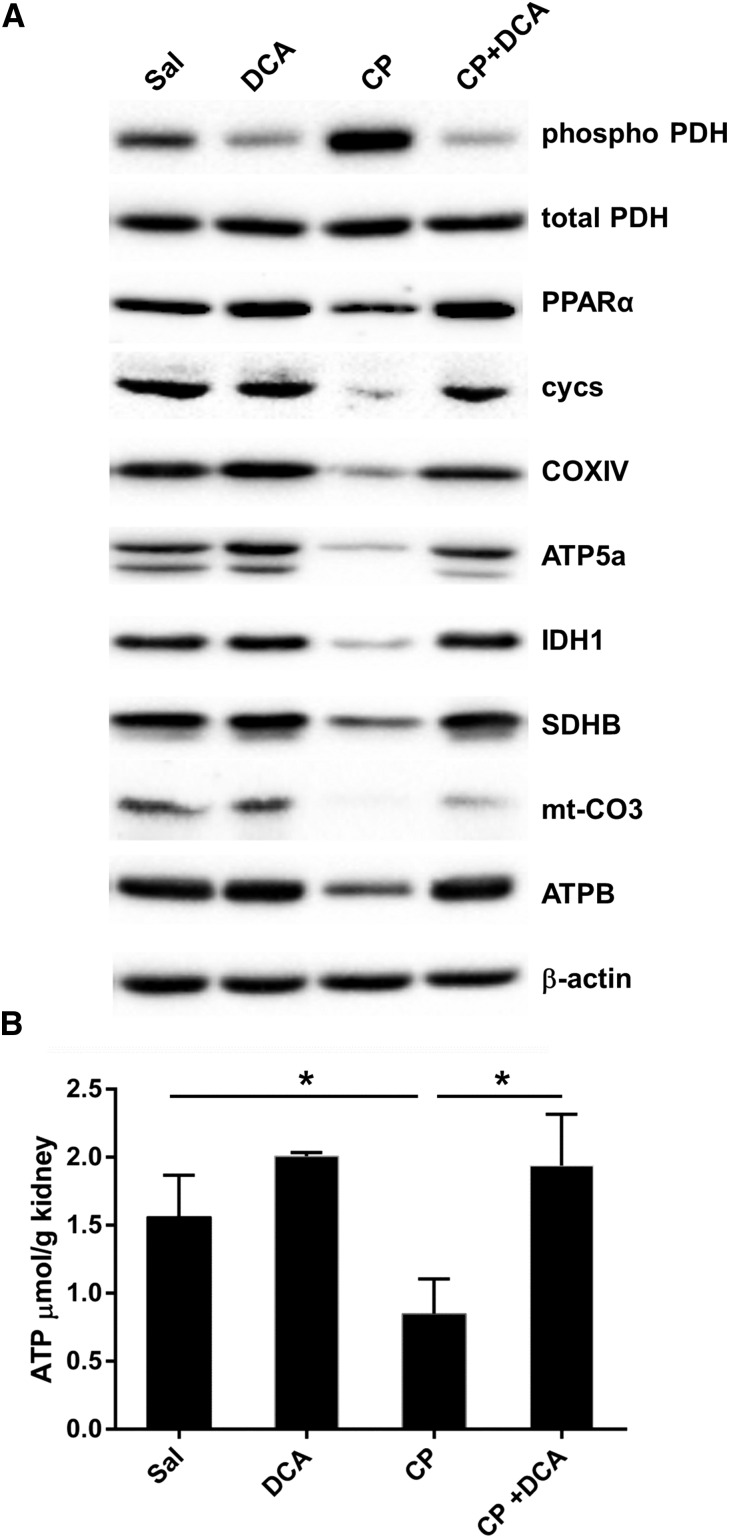
Western blotting on kidney lysates was performed to qualitatively assess the levels of key proteins involved in the principal pathways revealed by this analysis to mediate the nephroprotective effect of DCA, namely fatty acid oxidation and aerobic respiration. CP decreased renal PDH activity, assessed by the marked induction of phospho-PDH levels and DCA prevented this downregulation (Figure 7A). DCA also prevented the CP-mediated reduction of peroxisome proliferator-activated receptor‑α (PPARα), the master transcriptional regulator of fatty acid β‑oxidation (Figure 7A). Therefore, DCA restored renal capacity for glucose and fatty acid oxidation. Furthermore, DCA prevented CP-mediated reduction of key Krebs cycle and respiratory chain proteins (Figure 7A), and completely prevented CP-induced ATP depletion (Figure 7B).
Figure 7.
DCA prevents CP-induced inhibition of proteins involved in ATP production and prevents CP-induced ATP depletion. Mice were treated with sal, DCA, CP, or CP and DCA, as outlined in the CP-induced AKI section in the Concise Methods. (A) Representative immunoblots of kidney lysates for pyruvate dehydrogenase (phosphor S293) (phospho-PDH), total pyruvate dehydrogenase (tPDH), PPARα, somatic cytochrome c (cycs), cytochrome c oxidase IV (COXIV), ATP synthase subunit 5A (ATP5A), isocitrate dehydrogenase (IDH1), succinate dehydrogenase complex, subunit B iron sulfur (Ip) (SDHB), mitochondrial cytochrome c oxidase III (mt‑CO3), and ATP synthase complex V β subunit (ATPB). (B) ATP levels in the kidneys of mice treated with sal, DCA, CP, or CP and DCA. Results are expressed as mean±SEM, n=5 animals per group. *P<0.05.
Taken together, these data provide compelling evidence that CP-impaired energy production and increased apoptotic signaling were prevented by DCA. DCA prevented CP-induced inhibition of glucose and fatty acid oxidation, in addition to preventing the downregulation of components of the ATP-generating machinery. This led to the prevention of ATP depletion and ultimately the prevention of cell death.
DCA Treatment Prevents Oxidative Stress in the Kidneys of CP-Treated Mice
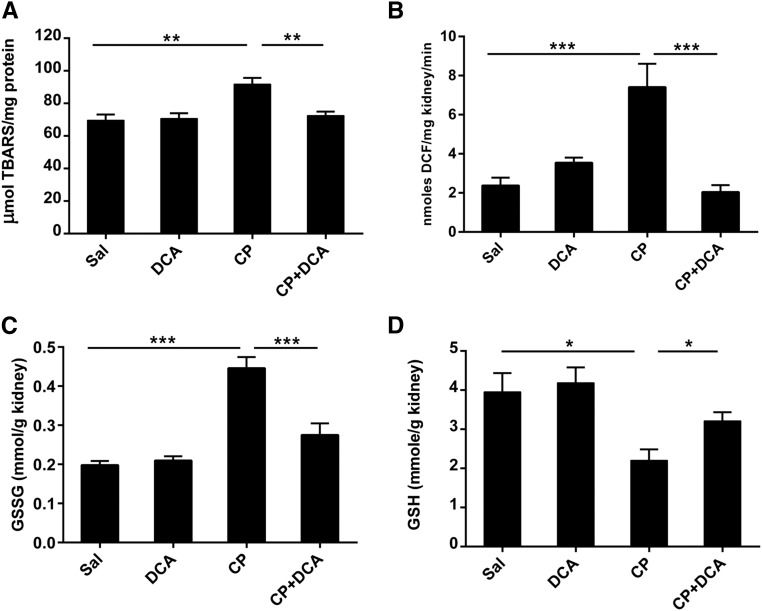
Oxidative stress is a major cause of CP-induced nephrotoxicity.34,35 Therefore, we determined whether DCA contributed to nephroprotection by attenuating oxidative stress. Indices of reactive oxygen species (ROS) generation including lipid peroxidation estimated by measuring thiobarbituric reactive substances (Figure 8A), 2′,7′‑dichlorofluorescein diacetate conversion to dichlorofluorescein (Figure 8B), and oxidized glutathione (Figure 8C) significantly increased in the kidneys of mice 72 hours after CP treatment. These increases were abolished in the DCA–CP cotreated mice. In addition, DCA significantly attenuated CP-induced reduced GSH depletion (Figure 8D). GSH is a major endogenous cellular antioxidant and it is well established that in this capacity, it plays a protective role in CP-induced nephrotoxicity.36–39 Therefore, DCA prevents the accumulation of damaging levels of endogenous ROS, thereby preventing a shift in the cellular redox status that would contribute to cell death.
Figure 8.
DCA attenuates oxidative stress in during CP-induced AKI. Mice were treated with sal, DCA, CP, or CP and DCA, as outlined in the CP-induced AKI model section in the Concise Methods. The mice were sacrificed at 72 hours after CP administration and renal levels of (A) thiobarbituric reactive substances, (B) dichlorofluorescein, (C) oxidized glutathione, and (D) GSH were measured. Results are expressed as mean±SEM, n=8 animals per group. ***P<0.001; **P<0.01; *P<0.05.
DCA Enhances Cellular Proliferation in the Kidneys of CP-Treated Mice
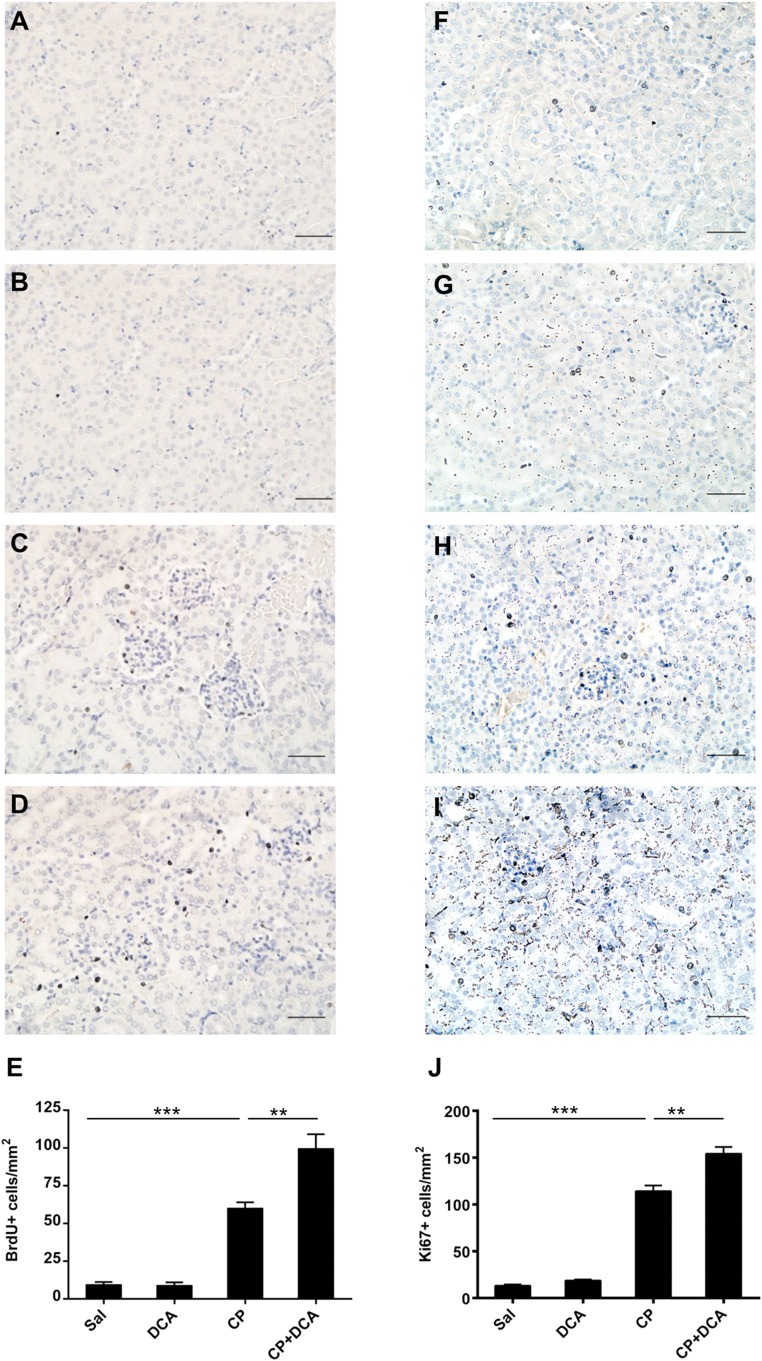
To assess whether the nephroprotective effect of DCA was due to enhanced renal cellular proliferation, the extent of 5‑bromo-2′‑deoxyuridine (BrdU) incorporation into DNA was assessed immunohistochemically on kidney sections from mice treated with sal, DCA, CP, or CP and DCA. The number of BrdU-positive cells was low in the sal (Figure 9A) and DCA groups (Figure 9B) but increased significantly in the CP-treated group (Figure 9) and, importantly, was significantly increased further in the CP–DCA cotreated group (Figure 9, D and E). Similar results were obtained in sections immunostained for the proliferation marker Ki67 (Figure 9, F–I). Therefore, DCA augments cellular proliferation in the presence of CP and indicates that enhanced replacement of CP-damaged cells accelerates recovery from nephrotoxicity.
Figure 9.
DCA enhances cellular proliferation in the kidneys during CP-induced AKI. Representative photomicrographs (magnification ×100) of BrdU staining in the kidneys of (A) Sal, (B) DCA, (C) CP, and (D) CP and DCA cotreated mice treated as outlined in the CP-induced AKI model section in the Concise Methods. BrdU-positive cells are stained brown. Bar=50 µm. (E) Quantitative analysis of BrdU-positive cells. Representative photomicrographs (magnification ×100) of Ki67 staining in the kidneys of (F) Sal, (G) DCA, (H) CP, and (I) CP and DCA cotreated mice treated, as outlined in the CP-induced AKI model section in the Concise Methods. (J) Quantitative analysis of Ki67-positive cells. Results are expressed as mean±SEM, n=8 animals per group ***P<0.001; **P<0.01.
DCA Does Not Attenuate the Anticancer Properties of CP
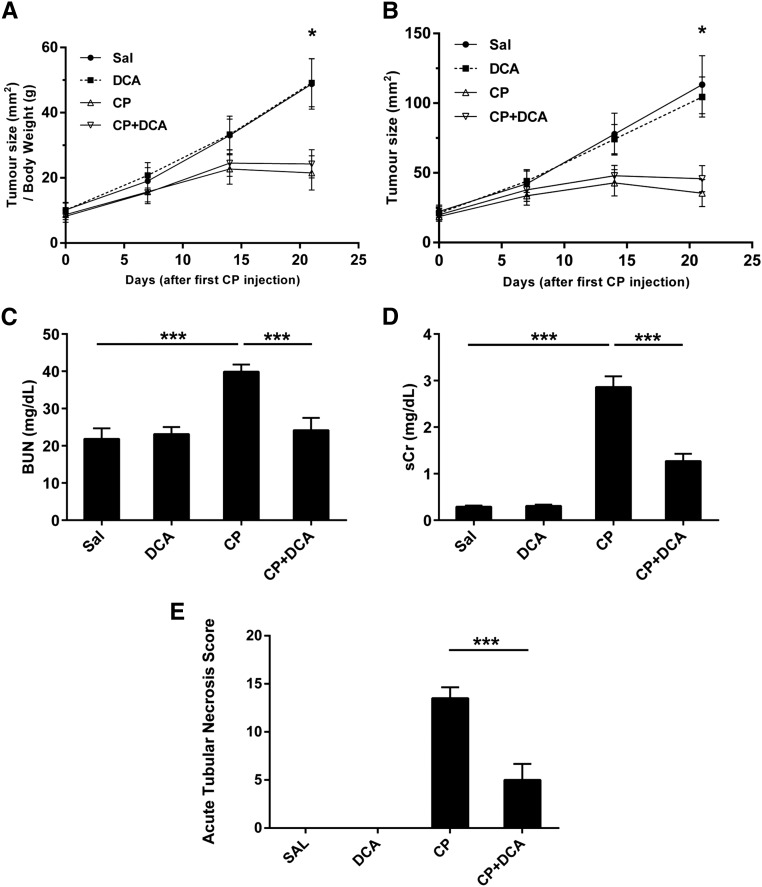
It was of critical importance to establish whether the administration of DCA had a deleterious effect on the antitumor efficacy of CP. To determine whether DCA could simultaneously mediate nephroprotection while preserving the anti-cancer activity of CP, the syngeneic 4T1 breast cancer model was employed. Subcutaneous 4T1 tumors were induced in female BALB/c mice which were then treated with CP, DCA, or both. CP significantly decreased the rate of tumor growth (Figure 10, A and B), and crucially, DCA did not attenuate this antitumor response. Importantly, increased BUN (Figure 10C), and sCr (Figure 10D) levels were prevented when CP-treated tumor-bearing mice were cotreated with DCA. DCA also attenuated kidney pathology in these tumor-bearing mice, as evidenced by the significant decrease in the severity of the ATN score (Figure 10E). Because the anticancer activity of CP was unaffected, it can also be concluded that the concurrent nephroprotection is not due to sequestration of CP by DCA in the blood. Therefore, DCA does not interfere with the antitumor properties of CP, while simultaneously effectively protecting the kidney from CP-induced nephrotoxicity.
Figure 10.
DCA does not attenuate the anticancer properties of CP in a syngeneic in vivo mouse tumor model and concurrently confers nephroprotection. Subcutaneous 4T1 tumors were induced in female BALB/c mice. Mice were then treated with Sal (•), DCA (■), CP (△), or CP and DCA (▽), as outlined in the 4T1 in vivo tumor model section of the Concise Methods. (A) Tumor sizes normalized to body weight and (B) absolute tumor size. Tumor size was measured once prior to CP administration and then weekly. Results are expressed as mean±SEM, n=8 animals per group. *P<0.05 Sal versus CP and Sal versus CP+DCA at the final tumor measurement. (C) BUN and (D) sCr assessed at the termination of the experiment. Results are expressed as mean±vSEM, n=8 animals per group ***P<0.001; **P<0.01; *P<0.05. (E) ATN score assessed at the termination of the experiment. Results are expressed as mean±SEM, n=6 animals per group. ***P<0.001.
Discussion
In this study, we determined whether DCA could exacerbate or alleviate CP-induced nephrotoxicity, an important clinical question because DCA will likely be coadministered with well-established chemotherapeutic agents such as CP. The study revealed that DCA conferred protection against CP-induced nephrotoxicity that was mediated via the maintenance of cellular respiration and antioxidant pathways, the inhibition of cell death pathways, and enhanced tubular proliferation. This protection was imparted without diminishing the anticancer activity of CP.
The discovery that DCA prevents renal ATP depletion reveals a key nephroprotective mechanism. Renal proximal tubules are reliant almost exclusively on ATP generated by mitochondrial oxidative phosphorylation and are therefore especially susceptible to mitochondrial damage.40–42 CP accumulates in mitochondria and diminishes the activity of all complexes (I–V) involved in oxidative phosphorylation, resulting in excessive ROS formation and impairment in ATP generation, leading to cell death.43,44 In cancer cells, the restoration of mitochondrial activity by DCA confers sensitization to cell death by reversing the glycolytic phenotype. By activating PDH, DCA restores mitochondrial metabolism and the intrinsic apoptotic pathways are re-established, facilitating cell death.18,45 However, in normal proximal tubules, which are not glycolytically programmed by hypoxia and oncogenic mutations, mitochondrial impairment represents an obstacle to survival. DCA prevents mitochondrial dysfunction and thereby proximal tubule death by preventing CP-induced ATP depletion and ROS formation.
In this study, we demonstrated that DCA prevented CP-induced ATP depletion by maintaining glucose and fatty acid oxidation pathways, processes that are critical for the prevention of CP-induced nephrotoxicity.46,47 DCA prevented CP-induced PDH inhibition, thereby permitting pyruvate decarboxylation to acetyl CoA to proceed unimpeded. DCA also prevented PPARα depletion, maintaining the capacity for fatty acid oxidation. The maintenance of PPARα likely accounts for the sustained levels of oxidative phosphorylation components by DCA because PPARα activation induces oxidative phosphorylation-related genes48,49 and it has been shown that DCA activates PPARα in vivo46 and in vitro.47,48 Maintenance of these components by DCA in the presence of CP ensured that inputs into the respiratory chain could efficiently be utilized for ATP generation.
The ability of DCA to accelerate the regeneration of the proximal tubule epithelium represents another major protective function mediated by DCA revealed in this study. Kidneys have a high capacity for regeneration following tubular damage, with repair ensuing as a result of the proliferation of a subset of sublethally damaged, yet surviving, proximal tubule cells.50 The acceleration of this process, as demonstrated in the present study and elsewhere, is sufficient to confer nephroprotection following CP treatment.51,52 DCA accelerates tubule regeneration to an extent that is sufficient for the recovery of renal function, whereas the rate of cellular regeneration in the CP-only group is insufficient to achieve tubule repair, resulting in renal failure. Several mechanisms may account for DCA- enhanced proliferation. The restoration of mitochondrial function by DCA via the upregulation of components of the respiratory chain may contribute to enhanced proliferation.53 The mitochondrial respiratory chain plays a critical role in cellular proliferation by controlling the rate of ATP synthesis and hence the provision of energy to proliferative pathways. Mutations in mitochondrial respiratory chain genes or agents that interfere with the activity of their subunits cause a reduction in intracellular ATP, which impedes progression through the cell cycle leading to a block in proliferation.54–58 Additionally, ROS alleviation by DCA may enhance proliferation because excessive ROS generation in proximal tubules leads to cell-cycle arrest59 and inhibits cell-cycle progression.60–62
A highly significant and clinically relevant finding of this study was that DCA did not ameliorate the anticancer activity of CP in an in vivo murine tumorigenic model while simultaneously conferring nephroprotection. CP effectively reduced the rate of tumor growth and DCA did not affect this rate of reduction. DCA and CP in combination exhibit a synergistic anti-cancer effect in lung carcinoma,43 cervical,63 and small cell lung cancer64 cell lines, and in an in vivo model of Dalton lymphoma.65 In addition, a new experimental drug, mitaplatin, a fusion of CP and DCA, exhibited cytotoxic effects enhanced, or equivalent to, CP alone, against human breast, testicular, ovarian, and osteosarcoma cell lines.66 A number of factors may account for the lack of synergistic anticancer activity of CP and DCA in our tumor model. First, 4T1 cells may have high intratumoral levels of glutathione transferase zeta which can influence the concentration of DCA reached in the tumor. DCA is a mechanism-based inactivator of glutathione transferase zeta 67 and as such may sequester a significant proportion of DCA. Second, DCA inhibits the four pyruvate dehydrogenase kinase isoforms to different extents,68 therefore, the relative expression and distribution of these isoforms will determine DCA sensitivity, and 4T1 cells may have a pyruvate dehydrogenase kinase isoform distribution that is unfavorable for inhibition by DCA. Finally, it has been demonstrated that CP induces hypoxia-inducible factor 1-alpha (HIF1‑α) in 4T1 cells69 and that inhibition of HIF1‑α is a requirement for sensitivity to DCA.70 Therefore, induction of HIF1‑α by CP in 4T1 cells may prevent DCA from sensitizing these cells to apoptosis.
In summary, our data demonstrate that DCA provides extremely valuable protection against CP nephrotoxicity without affecting its anticancer properties. DCA may, therefore, be an effective nephroprotective agent in chemotherapy regimens that include CP. Given that DCA is well tolerated,21,71–74 there is a clear pathway for its translation into clinical use as a therapy to prevent CP-induced nephrotoxicity.
Concise Methods
CP-Induced Acute Nephrotoxicity Injury Model
All mouse studies were performed according to the animal experimental guidelines issued by the Animal Experimentation Ethics Committee (AEEC) at the Australian National University. Male BALB/c mice (6–10 weeks old) were used in all acute toxicity experiments. Two groups of mice were pretreated intraperitoneally (ip) daily with DCA (250 mg/kg; Sigma-Aldrich, St Louis, MO) and an additional two groups with normal saline (sal) for 5 days. A single nephrotoxic dose of CP (20 mg/kg; Sigma-Aldrich) was administered ip to one DCA- and one sal-pretreated group, and then daily DCA or sal treatment was continued for 3 days. The remaining DCA and sal pretreatment groups were administered sal instead of CP, and daily DCA or saline treatment was continued for 3 days. Mice were sacrificed 72 hours after the CP injection. Mice were monitored twice daily and a scoring index of pathologic changes was recorded for each animal. Mice were immediately euthanized if a threshold score (according to criteria defined by the AEEC) was reached on any given examination interval.
Serum Metabolites
Commercial kits were used to measure BUN (Bioassay Systems, Hayward, CA), and sCr (Abcam, Melbourne, Australia).
Renal Histopathologic Studies
For light microscopy, 5‑µM thick sections were made from formalin-fixed paraffin-embedded kidney tissue. Sections were stained with hematoxylin and eosin (Sigma-Aldrich). Images were captured using an Olympus IX71 inverted brightfield/fluorescence microscope (Olympus, NSW, Australia). The ATN score was derived using criteria as outlined in Tavares et al.49 Individual pathologic features, if present, were assigned a severity score: tubular dilatation, thinning of the tubular epithelium, interstitial edema (0=absent, 1=mild; 2=moderate, 3=severe); cellular casts (0=absent, 1=minimal, 2=mild, 3=moderate, 4=many); protein in collecting system tubules (0=absent, 1=minimal, 2=mild, 3=moderate, 4=severe, 5=granular casts, 6=calcification); apoptosis and markers of epithelial regeneration (0=absent, 1=minimal, 2=mild, 3=moderate).
Immunoblotting
Kidneys were homogenized using T‑PER buffer (Life Technologies, Carlsbad, CA) supplemented with protease and phosphatase inhibitors (Roche, NSW, Australia). Total protein was quantitated with a BCA protein assay (Life Technologies). Proteins were resolved by SDS–PAGE, transferred to polyvinylidene difluoride membranes, which were probed with anti–phospho-p53 (S15) (Cell Signaling Technology, Danvers, MA) antitotal p53 (Santa Cruz Biotechnology, Santa Cruz, CA) anti–phospho-PDH (S293), -tPDH, -PPARα, -cycs, -COXIV, -ATP5A, -IDH1, -SDHB, -mt-CO3, and -ATPB (Abcam, Inc.). To verify equal protein loading, membranes were probed with anti-β–actin antibody (Abcam, Inc.).
Renal Platinum Levels
Platinum levels (195Pt) were determined in kidney homogenates by inductively coupled plasma mass spectrometry (ICP-MS) using a Varian 820 ICP-MS instrument (Agilent Technologies, Santa Clara, CA). Approximately 200 mg of tissue was digested in 1 ml aqua regia (3:1 hydrochloric acid/nitric acid) for 24 hours, dried, redissolved in 2 ml 2% HCl, and quantified against Tracert 195Pt standards (Sigma). Renal 195Pt levels were normalized to kidney weight. The variation in precision (10 replicates of a standard 195Pt concentration collected over 20 minutes) was <3%. The detection limit for 195Pt was <0.3 ng/L. To account for any matrix interference or drift in the instrument, 103Lr and 197Au were used as internal standards.
Whole Transcriptome Sequencing
Mice were treated as outlined in the CP-Induced Acute Nephrotoxicity Injury Model section above, except that exposure to CP was for 24 and not 72 hours. At this time point after CP injection, mice were sacrificed and whole kidneys were removed and homogenized. Total RNA was extracted with RNeasy mini kits (Qiagen, Venlo, The Netherlands) and treated with Turbo DNAse (Life Technologies). RNA quality and quantity were checked on an Agilent 2100 Bioanalyzer (Agilent Technologies). Libraries were prepared with a Truseq RNA Sample Preparation kit (Illumina, San Diego, CA). RNA (1 µg/sample) was fragmented and subject to first- and second-strand synthesis, 3′‑end adenylation, adaptor ligation, PCR amplification, and validated using the Agilent 2100 Bioanalyzer High Sensitivity DNA Chip. One-hundred base pair single-end sequencing was carried out on the Illumina HiSEquation 2500 using the TruSeq Rapid SBS Kit. Total RNA from three mice per treatment group was sequenced. Sequencing reads were trimmed with Trimmomatic (HEADCROP:14 LEADING:3 TRAILING:3 MINLEN:70)75 and mapped to the mouse genome (GRC38.72) with tophat (–b2 -very sensitive).76 Cufflinks and HTSeq (-a -s no)77 were used to count unique reads occurring in ENSEMBL genes and to create wig files for visualization. DESEquation77 was used to normalize the reads and edgeR78 to detect differential expression of genes (false discovery rate <0.05). Heatmaps were created using the Heatplus package in R and show the average of the three replicates, scaled across genes. Database for Annotation, Visualization and Integrated Discovery (DAVID, v6.7)79 was used to detect significantly (false discovery rate <25%, gene count ≥5) enriched Gene Ontology groups (biologic processes) and Kyoto Encyclopedia of Genes and Genomes (KEGG) pathways. Functional Annotation Clustering (high stringency) was used to group redundant Gene Ontology groups into clusters and only one representative from each redundant cluster is shown. Transcriptome data has been deposited in the NCBI Gene Expression Omnibus database (accession number GSE69652).
ATP Levels
ATP levels were determined in kidney homogenates using a commercial kit (Abcam, Inc.) that uses the phosphorylation of glycerol to generate a product that is quantified by fluorometric methods. The lower limit of detection of the kit is 1 µM ATP.
Oxidative Stress Markers
GSH and oxidized glutathione were measured as described previously.80 ROS were measured by monitoring dichlorofluorescein diacetate conversion to dichlorofluorescein as described elsewhere.81 Lipid peroxidation was assessed by measuring thiobarbituric reactive substances using a commercial kit (Cayman Chemicals, Ann Arbor, MI).
Caspase 3 Activity
Cleaved caspase 3 activity was measured in kidney homogenates using a commercial fluorometric kit (Abcam, Inc.).
TUNEL Staining
TUNEL was performed on formalin-fixed kidney sections using a TACS 2 Tdt Fluorescein kit (Trevigen, Gaithersburg MD). Images were captured using an Olympus IX71 inverted brightfield/fluorescence microscope. For each kidney section, TUNEL-positive cells were quantified in 20 nonoverlapping random fields viewed at ×400 magnification.
In Vivo BrdU Labeling and Detection and Ki67 Immunohistochemistry
Mice were treated with CP, DCA, or both according to the scheme described above. Mice were injected with 30 µg/g BrdU 2 hours prior to sacrifice at 72 hours post CP. BrdU was detected immunohistochemically on formalin-fixed kidney sections using a commercial BrdU detection kit (Life Technologies). Ki67 was detected immunohistochemically on formalin-fixed kidney sections. Slides were deparaffinized in xylene and antigens unmasked in 10 mM sodium citrate buffer. Sections were then incubated in 3% H2O2, blocked with Tris-buffered saline/5% normal goat serum and incubated in anti-Ki67 antibody (Cell Signaling Technology). The signal was developed using rabbit horseradish peroxidase SignalStain Boost detection reagent and SignalStain DAB chromogen (Cell Signaling Technologies). Images were captured using an Olympus IX71 inverted brightfield/fluorescence microscope. For each kidney section, BrdU- or Ki67-positive cells were quantified in 20 nonoverlapping random fields viewed at ×20 magnification.
4T1 In Vivo Tumor Model
4T1 cells are derived from the 410.4 tumor which was isolated from a spontaneously arising mammary tumor of a MMTV+ BALB/c mouse.82 4T1 cells (American Type Culture Collection, Manassas, VA) were cultured in DMEM with 10% FCS and antibiotics. 4T1 cells (104) were injected subcutaneously into 6–10-week–old female BALB/c mice. Tumor dimensions were measured with calipers and volumes estimated using the equation 1/2(length×width2).83 When tumor sizes reached a value of 18 according to this formula, the mice were divided into four groups: a sal control group, a CP-treated group, a DCA-only group, and a CP–DCA cotreated group. Two groups of mice were pretreated daily with 250 mg/kg DCA ip for 5 days and two groups were treated with saline. On day 5 of pretreatment, one sal and one DCA pretreated group were injected ip with 15 mg/kg CP, which was administered weekly for two additional weeks. The remaining sal and DCA-treated groups received a weekly sal injection in place of CP. Mice that received DCA were additionally injected with 250 mg/kg DCA daily for 3 days prior to each weekly CP injection while control groups were injected with sal. Tumor size was measured every 7 days after the initial CP injection and mice were sacrificed 7 days after the final CP injection.
Statistical Analyses
All statistical analysis was conducted with the Prism software package (GraphPad Software, La Jolla, CA). One-way ANOVA, with the application of a Bonferroni test to correct for multiple comparisons, was used to determine whether difference in means between multiple groups were statistically significant. The log-rank (Mantel–Cox) test was used to compare survival curves.
Disclosures
None.
Supplementary Material
Acknowledgments
This work was supported by a National Health and Medical Research grant (NHMRC) funded by the Australian government. We wish to thank Cathy Gillespie for assistance with microscopy, Anne Prins for assistance with histology and Amanda Bullman for assistance with immunohistochemistry.
Footnotes
Published online ahead of print. Publication date available at www.jasn.org.
This article contains supplemental material online at http://jasn.asnjournals.org/lookup/suppl/doi:10.1681/ASN.2015070827/-/DCSupplemental.
References
- 1.Cohen SM, Lippard SJ: Cisplatin: from DNA damage to cancer chemotherapy. Prog Nucleic Acid Res Mol Biol 67: 93–130, 2001 [DOI] [PubMed] [Google Scholar]
- 2.Sánchez-González PD, López-Hernández FJ, López-Novoa JM, Morales AI: An integrative view of the pathophysiological events leading to cisplatin nephrotoxicity. Crit Rev Toxicol 41: 803–821, 2011 [DOI] [PubMed] [Google Scholar]
- 3.Isakoff SJ, Mayer EL, He L, Traina TA, Carey LA, Krag KJ, Rugo HS, Liu MC, Stearns V, Come SE, Timms KM, Hartman AR, Borger DR, Finkelstein DM, Garber JE, Ryan PD, Winer EP, Goss PE, Ellisen LW: TBCRC009: A multicenter phase II clinical trial of platinum monotherapy with biomarker assessment in metastatic triple-negative breast cancer. J Clin Oncol 33: 1902–1909, 2015 [DOI] [PMC free article] [PubMed] [Google Scholar]
- 4.Arany I, Safirstein RL: Cisplatin nephrotoxicity. Semin Nephrol 23: 460–464, 2003 [DOI] [PubMed] [Google Scholar]
- 5.Pabla N, Dong Z: Cisplatin nephrotoxicity: mechanisms and renoprotective strategies. Kidney Int 73: 994–1007, 2008 [DOI] [PubMed] [Google Scholar]
- 6.Wang D, Lippard SJ: Cellular processing of platinum anticancer drugs. Nat Rev Drug Discov 4: 307–320, 2005 [DOI] [PubMed] [Google Scholar]
- 7.Mukhopadhyay P, Horváth B, Zsengellér Z, Zielonka J, Tanchian G, Holovac E, Kechrid M, Patel V, Stillman IE, Parikh SM, Joseph J, Kalyanaraman B, Pacher P: Mitochondrial-targeted antioxidants represent a promising approach for prevention of cisplatin-induced nephropathy. Free Radic Biol Med 52: 497–506, 2012 [DOI] [PMC free article] [PubMed] [Google Scholar]
- 8.Chirino YI, Pedraza-Chaverri J Role of oxidative and nitrosative stress in cisplatin-induced nephrotoxicity. Exp Toxicol Pathol 61: 223–242, 2009 [DOI] [PubMed] [Google Scholar]
- 9.Chang B, Nishikawa M, Sato E, Utsumi K, Inoue M: L-Carnitine inhibits cisplatin-induced injury of the kidney and small intestine. Arch Biochem Biophys 405: 55–64, 2002 [DOI] [PubMed] [Google Scholar]
- 10.Yang Y, Liu H, Liu F, Dong Z: Mitochondrial dysregulation and protection in cisplatin nephrotoxicity. Arch Toxicol 88: 1249–1256, 2014 [DOI] [PMC free article] [PubMed] [Google Scholar]
- 11.Townsend DM, Deng M, Zhang L, Lapus MG, Hanigan MH: Metabolism of Cisplatin to a nephrotoxin in proximal tubule cells. J Am Soc Nephrol 14: 1–10, 2003 [DOI] [PMC free article] [PubMed] [Google Scholar]
- 12.Jiang M, Wei Q, Wang J, Du Q, Yu J, Zhang L, Dong Z: Regulation of PUMA-alpha by p53 in cisplatin-induced renal cell apoptosis. Oncogene 25: 4056–4066, 2006 [DOI] [PubMed] [Google Scholar]
- 13.Park MS, De Leon M, Devarajan P: Cisplatin induces apoptosis in LLC-PK1 cells via activation of mitochondrial pathways. J Am Soc Nephrol 13: 858–865, 2002 [DOI] [PubMed] [Google Scholar]
- 14.Megyesi J, Safirstein RL, Price PM: Induction of p21WAF1/CIP1/SDI1 in kidney tubule cells affects the course of cisplatin-induced acute renal failure. J Clin Invest 101: 777–782, 1998 [DOI] [PMC free article] [PubMed] [Google Scholar]
- 15.Pabla N, Huang S, Mi QS, Daniel R, Dong Z: ATR-Chk2 signaling in p53 activation and DNA damage response during cisplatin-induced apoptosis. J Biol Chem 283: 6572–6583, 2008 [DOI] [PubMed] [Google Scholar]
- 16.Wang J, Pabla N, Wang CY, Wang W, Schoenlein PV, Dong Z: Caspase-mediated cleavage of ATM during cisplatin-induced tubular cell apoptosis: inactivation of its kinase activity toward p53. Am J Physiol Renal Physiol 291: F1300–F1307, 2006 [DOI] [PubMed] [Google Scholar]
- 17.Hanahan D, Weinberg RA: Hallmarks of cancer: the next generation. Cell 144: 646–674, 2011 [DOI] [PubMed] [Google Scholar]
- 18.Bonnet S, Archer SL, Allalunis-Turner J, Haromy A, Beaulieu C, Thompson R, Lee CT, Lopaschuk GD, Puttagunta L, Bonnet S, Harry G, Hashimoto K, Porter CJ, Andrade MA, Thebaud B, Michelakis ED: A mitochondria-K+ channel axis is suppressed in cancer and its normalization promotes apoptosis and inhibits cancer growth. Cancer Cell 11: 37–51, 2007 [DOI] [PubMed] [Google Scholar]
- 19.Gang BP, Dilda PJ, Hogg PJ, Blackburn AC: Targeting of two aspects of metabolism in breast cancer treatment. Cancer Biol Ther 15: 1533–1541, 2014 [DOI] [PMC free article] [PubMed] [Google Scholar]
- 20.Madhok BM, Yeluri S, Perry SL, Hughes TA, Jayne DG: Dichloroacetate induces apoptosis and cell-cycle arrest in colorectal cancer cells. Br J Cancer 102: 1746–1752, 2010 [DOI] [PMC free article] [PubMed] [Google Scholar]
- 21.Michelakis ED, Sutendra G, Dromparis P, Webster L, Haromy A, Niven E, Maguire C, Gammer TL, Mackey JR, Fulton D, Abdulkarim B, McMurtry MS, Petruk KC: Metabolic modulation of glioblastoma with dichloroacetate. Sci Transl Med 2: 31ra34, 2010 [DOI] [PubMed] [Google Scholar]
- 22.Sun RC, Board PG, Blackburn AC: Targeting metabolism with arsenic trioxide and dichloroacetate in breast cancer cells. Mol Cancer 10: 142, 2011 [DOI] [PMC free article] [PubMed] [Google Scholar]
- 23.Cummings BS, Schnellmann RG: Cisplatin-induced renal cell apoptosis: caspase 3-dependent and -independent pathways. J Pharmacol Exp Ther 302: 8–17, 2002 [DOI] [PubMed] [Google Scholar]
- 24.Lau AH: Apoptosis induced by cisplatin nephrotoxic injury. Kidney Int 56: 1295–1298, 1999 [DOI] [PubMed] [Google Scholar]
- 25.Liu Y, Lu X, Nguyen S, Olson JL, Webb HK, Kroetz DL: Epoxyeicosatrienoic acids prevent cisplatin-induced renal apoptosis through a p38 mitogen-activated protein kinase-regulated mitochondrial pathway. Mol Pharmacol 84: 925–934, 2013 [DOI] [PMC free article] [PubMed] [Google Scholar]
- 26.Kaushal GP, Kaushal V, Hong X, Shah SV: Role and regulation of activation of caspases in cisplatin-induced injury to renal tubular epithelial cells. Kidney Int 60: 1726–1736, 2001 [DOI] [PubMed] [Google Scholar]
- 27.Hanada K, Ninomiya K, Ogata H: Pharmacokinetics and toxicodynamics of cisplatin and its metabolites in rats: relationship between renal handling and nephrotoxicity of cisplatin. J Pharm Pharmacol 52: 1345–1353, 2000 [DOI] [PubMed] [Google Scholar]
- 28.Johnsson A, Olsson C, Nygren O, Nilsson M, Seiving B, Cavallin-Stahl E: Pharmacokinetics and tissue distribution of cisplatin in nude mice: platinum levels and cisplatin-DNA adducts. Cancer Chemother Pharmacol 37: 23–31, 1995 [DOI] [PubMed] [Google Scholar]
- 29.Yasumasu T, Ueda T, Uozumi J, Mihara Y, Kumazawa J: Comparative study of cisplatin and carboplatin on pharmacokinetics, nephrotoxicity and effect on renal nuclear DNA synthesis in rats. Pharmacol Toxicol 70: 143–147, 1992 [DOI] [PubMed] [Google Scholar]
- 30.Sprowl JA, Lancaster CS, Pabla N, Hermann E, Kosloske AM, Gibson AA, Li L, Zeeh D, Schlatter E, Janke LJ, Ciarimboli G, Sparreboom A: Cisplatin-induced renal injury is independently mediated by OCT2 and p53. Clin Cancer Res 20: 4026–4035, 2014 [DOI] [PMC free article] [PubMed] [Google Scholar]
- 31.Pabla N, Murphy RF, Liu K, Dong Z: The copper transporter Ctr1 contributes to cisplatin uptake by renal tubular cells during cisplatin nephrotoxicity. Am J Physiol Renal Physiol 296: F505–F511, 2009 [DOI] [PMC free article] [PubMed] [Google Scholar]
- 32.Samimi G, Katano K, Holzer AK, Safaei R, Howell SB: Modulation of the cellular pharmacology of cisplatin and its analogs by the copper exporters ATP7A and ATP7B. Mol Pharmacol 66: 25–32, 2004 [DOI] [PubMed] [Google Scholar]
- 33.Yonezawa A, Inui K: Organic cation transporter OCT/SLC22A and H(+)/organic cation antiporter MATE/SLC47A are key molecules for nephrotoxicity of platinum agents. Biochem Pharmacol 81: 563–568, 2011 [DOI] [PubMed] [Google Scholar]
- 34.Davis CA, Nick HS, Agarwal A: Manganese superoxide dismutase attenuates Cisplatin-induced renal injury: importance of superoxide. J Am Soc Nephrol 12: 2683–2690, 2001 [DOI] [PubMed] [Google Scholar]
- 35.Ma SF, Nishikawa M, Hyoudou K, Takahashi R, Ikemura M, Kobayashi Y, Yamashita F, Hashida M: Combining cisplatin with cationized catalase decreases nephrotoxicity while improving antitumor activity. Kidney Int 72: 1474–1482, 2007 [DOI] [PubMed] [Google Scholar]
- 36.Liu M, Grigoryev DN, Crow MT, Haas M, Yamamoto M, Reddy SP, Rabb H: Transcription factor Nrf2 is protective during ischemic and nephrotoxic acute kidney injury in mice. Kidney Int 76: 277–285, 2009 [DOI] [PubMed] [Google Scholar]
- 37.Luo J, Tsuji T, Yasuda H, Sun Y, Fujigaki Y, Hishida A: The molecular mechanisms of the attenuation of cisplatin-induced acute renal failure by N-acetylcysteine in rats. Nephrol Dial Transplant 23: 2198–2205, 2008 [DOI] [PubMed] [Google Scholar]
- 38.Santos NA, Catão CS, Martins NM, Curti C, Bianchi ML, Santos AC: Cisplatin-induced nephrotoxicity is associated with oxidative stress, redox state unbalance, impairment of energetic metabolism and apoptosis in rat kidney mitochondria. Arch Toxicol 81: 495–504, 2007 [DOI] [PubMed] [Google Scholar]
- 39.Satoh M, Shimada A, Zhang B, Tohyama C: Renal toxicity caused by cisplatinum in glutathione-depleted metallothionein-null mice. Biochem Pharmacol 60: 1729–1734, 2000 [DOI] [PubMed] [Google Scholar]
- 40.Klein KL, Wang MS, Torikai S, Davidson WD, Kurokawa K: Substrate oxidation by isolated single nephron segments of the rat. Kidney Int 20: 29–35, 1981 [DOI] [PubMed] [Google Scholar]
- 41.Uchida S, Endou H: Substrate specificity to maintain cellular ATP along the mouse nephron. Am J Physiol 255: F977–F983, 1988 [DOI] [PubMed] [Google Scholar]
- 42.Wirthensohn G, Guder WG: Renal substrate metabolism. Physiol Rev 66: 469–497, 1986 [DOI] [PubMed] [Google Scholar]
- 43.Marullo R, Werner E, Degtyareva N, Moore B, Altavilla G, Ramalingam SS, Doetsch PW: Cisplatin induces a mitochondrial-ROS response that contributes to cytotoxicity depending on mitochondrial redox status and bioenergetic functions. PLoS One 8: e81162, 2013 [DOI] [PMC free article] [PubMed] [Google Scholar]
- 44.Nowak G: Protein kinase C-alpha and ERK1/2 mediate mitochondrial dysfunction, decreases in active Na+ transport, and cisplatin-induced apoptosis in renal cells. J Biol Chem 277: 43377–43388, 2002 [DOI] [PMC free article] [PubMed] [Google Scholar]
- 45.Bhat TA, Kumar S, Chaudhary AK, Yadav N, Chandra D: Restoration of mitochondria function as a target for cancer therapy. Drug Discov Today 20: 635–643, 2015 [DOI] [PMC free article] [PubMed] [Google Scholar]
- 46.Laughter AR, Dunn CS, Swanson CL, Howroyd P, Cattley RC, Corton JC: Role of the peroxisome proliferator-activated receptor alpha (PPARalpha) in responses to trichloroethylene and metabolites, trichloroacetate and dichloroacetate in mouse liver. Toxicology 203: 83–98, 2004 [DOI] [PubMed] [Google Scholar]
- 47.Zhou YC, Waxman DJ: Activation of peroxisome proliferator-activated receptors by chlorinated hydrocarbons and endogenous steroids. Environ Health Perspect 106[Suppl 4]: 983–988, 1998 [DOI] [PMC free article] [PubMed] [Google Scholar]
- 48.Maloney EK, Waxman DJ: trans-Activation of PPARalpha and PPARgamma by structurally diverse environmental chemicals. Toxicol Appl Pharmacol 161: 209–218, 1999 [DOI] [PubMed] [Google Scholar]
- 49.Tavares MB, Chagas de Almeida MC, Martins RT, de Sousa AC, Martinelli R, dos-Santos WL: Acute tubular necrosis and renal failure in patients with glomerular disease. Ren Fail 34: 1252–1257, 2012 [DOI] [PMC free article] [PubMed] [Google Scholar]
- 50.Berger K, Moeller MJ: Mechanisms of epithelial repair and regeneration after acute kidney injury. Semin Nephrol 34: 394–403, 2014 [DOI] [PubMed] [Google Scholar]
- 51.Bagnis C, Beaufils H, Jacquiaud C, Adabra Y, Jouanneau C, Le Nahour G, Jaudon MC, Bourbouze R, Jacobs C, Deray G: Erythropoietin enhances recovery after cisplatin-induced acute renal failure in the rat. Nephrol Dial Transplant 16: 932–938, 2001 [DOI] [PubMed] [Google Scholar]
- 52.Kawaida K, Matsumoto K, Shimazu H, Nakamura T: Hepatocyte growth factor prevents acute renal failure and accelerates renal regeneration in mice. Proc Natl Acad Sci USA 91(10):4357–4361 1994 [DOI] [PMC free article] [PubMed] [Google Scholar]
- 53.Byun HO, Kim HY, Lim JJ, Seo YH, Yoon G: Mitochondrial dysfunction by complex II inhibition delays overall cell cycle progression via reactive oxygen species production. J Cell Biochem 104: 1747–1759, 2008 [DOI] [PubMed] [Google Scholar]
- 54.Chen HW, Rainey RN, Balatoni CE, Dawson DW, Troke JJ, Wasiak S, Hong JS, McBride HM, Koehler CM, Teitell MA, French SW: Mammalian polynucleotide phosphorylase is an intermembrane space RNase that maintains mitochondrial homeostasis. Mol Cell Biol 26: 8475–8487, 2006 [DOI] [PMC free article] [PubMed] [Google Scholar]
- 55.Kuznetsov AV, Margreiter R, Amberger A, Saks V, Grimm M: Changes in mitochondrial redox state, membrane potential and calcium precede mitochondrial dysfunction in doxorubicin-induced cell death. Biochim Biophys Acta 1813: 1144–1152, 2011 [DOI] [PubMed] [Google Scholar]
- 56.Mandal S, Guptan P, Owusu-Ansah E, Banerjee U: Mitochondrial regulation of cell cycle progression during development as revealed by the tenured mutation in Drosophila. Dev Cell 9: 843–854, 2005 [DOI] [PubMed] [Google Scholar]
- 57.Merkwirth C, Dargazanli S, Tatsuta T, Geimer S, Löwer B, Wunderlich FT, von Kleist-Retzow JC, Waisman A, Westermann B, Langer T: Prohibitins control cell proliferation and apoptosis by regulating OPA1-dependent cristae morphogenesis in mitochondria. Genes Dev 22: 476–488, 2008 [DOI] [PMC free article] [PubMed] [Google Scholar]
- 58.Vohwinkel CU, Lecuona E, Sun H, Sommer N, Vadász I, Chandel NS, Sznajder JI: Elevated CO(2) levels cause mitochondrial dysfunction and impair cell proliferation. J Biol Chem 286: 37067–37076, 2011 [DOI] [PMC free article] [PubMed] [Google Scholar]
- 59.Hannken T, Schroeder R, Stahl RA, Wolf G: Angiotensin II-mediated expression of p27Kip1 and induction of cellular hypertrophy in renal tubular cells depend on the generation of oxygen radicals. Kidney Int 54: 1923–1933, 1998 [DOI] [PubMed] [Google Scholar]
- 60.Boonstra J, Post JA: Molecular events associated with reactive oxygen species and cell cycle progression in mammalian cells. Gene 337: 1–13, 2004 [DOI] [PubMed] [Google Scholar]
- 61.Pyo CW, Choi JH, Oh SM, Choi SY: Oxidative stress-induced cyclin D1 depletion and its role in cell cycle processing. Biochim Biophys Acta 1830: 5316–5325, 2013 [DOI] [PubMed] [Google Scholar]
- 62.Shackelford RE, Kaufmann WK, Paules RS: Oxidative stress and cell cycle checkpoint function. Free Radical Biol Med 28: 1387–1404, 2000 [DOI] [PubMed] [Google Scholar]
- 63.Xie J, Wang BS, Yu DH, Lu Q, Ma J, Qi H, Fang C, Chen HZ: Dichloroacetate shifts the metabolism from glycolysis to glucose oxidation and exhibits synergistic growth inhibition with cisplatin in HeLa cells. Int J Oncol 38: 409–417, 2011 [DOI] [PubMed] [Google Scholar]
- 64.Olszewski U, Poulsen TT, Ulsperger E, Poulsen HS, Geissler K, Hamilton G: In vitro cytotoxicity of combinations of dichloroacetate with anticancer platinum compounds. Clin Pharmacol 2: 177–183, 2010 [DOI] [PMC free article] [PubMed] [Google Scholar]
- 65.Kumar A, Kant S, Singh SM: Antitumor and chemosensitizing action of dichloroacetate implicates modulation of tumor microenvironment: a role of reorganized glucose metabolism, cell survival regulation and macrophage differentiation. Toxicol Appl Pharmacol 273: 196–208, 2013 [DOI] [PubMed] [Google Scholar]
- 66.Dhar S, Lippard SJ: Mitaplatin, a potent fusion of cisplatin and the orphan drug dichloroacetate. Proc Natl Acad Sci USA 106: 22199–22204, 2009 [DOI] [PMC free article] [PubMed] [Google Scholar]
- 67.Anderson WB, Board PG, Anders MW: Glutathione transferase zeta-catalyzed bioactivation of dichloroacetic acid: reaction of glyoxylate with amino acid nucleophiles. Chem Res Toxicol 17: 650–662, 2004 [DOI] [PubMed] [Google Scholar]
- 68.Bowker-Kinley MM, Davis WI, Wu P, Harris RA, Popov KM: Evidence for existence of tissue-specific regulation of the mammalian pyruvate dehydrogenase complex. Biochem J 329: 191–196, 1998 [DOI] [PMC free article] [PubMed] [Google Scholar]
- 69.Sarangi S, Pandey A, Papa AL, Sengupta P, Kopparam J, Dadwal U, Basu S, Sengupta S: P2Y12 receptor inhibition augments cytotoxic effects of cisplatin in breast cancer. Med Oncol 30: 567, 2013 [DOI] [PubMed] [Google Scholar]
- 70.Hong SE, Jin HO, Kim HA, Seong MK, Kim EK, Ye SK, Choe TB, Lee JK, Kim JI, Park IC, Noh WC: Targeting HIF-1alpha is a prerequisite for cell sensitivity to dichloroacetate (DCA) and metformin. Biochem Biophys Res Commun 2015 [DOI] [PubMed]
- 71.Berendzen K, Theriaque DW, Shuster J, Stacpoole PW: Therapeutic potential of dichloroacetate for pyruvate dehydrogenase complex deficiency. Mitochondrion 6: 126–135, 2006 [DOI] [PubMed] [Google Scholar]
- 72.Dunbar EM, Coats BS, Shroads AL, Langaee T, Lew A, Forder JR, Shuster JJ, Wagner DA, Stacpoole PW: Phase 1 trial of dichloroacetate (DCA) in adults with recurrent malignant brain tumors. Invest New Drugs 32: 452–464, 2014 [DOI] [PMC free article] [PubMed] [Google Scholar]
- 73.Stacpoole PW, Gilbert LR, Neiberger RE, Carney PR, Valenstein E, Theriaque DW, Shuster JJ: Evaluation of long-term treatment of children with congenital lactic acidosis with dichloroacetate. Pediatrics 121: e1223–e1228, 2008 [DOI] [PMC free article] [PubMed] [Google Scholar]
- 74.Taivassalo T, Matthews PM, De Stefano N, Sripathi N, Genge A, Karpati G, Arnold DL: Combined aerobic training and dichloroacetate improve exercise capacity and indices of aerobic metabolism in muscle cytochrome oxidase deficiency. Neurology 47: 529–534, 1996 [DOI] [PubMed] [Google Scholar]
- 75.Bolger AM, Lohse M, Usadel B: Trimmomatic: a flexible trimmer for Illumina sequence data. Bioinformatics 30: 2114–2120, 2014 [DOI] [PMC free article] [PubMed] [Google Scholar]
- 76.Trapnell C, Roberts A, Goff L, Pertea G, Kim D, Kelley DR, Pimentel H, Salzberg SL, Rinn JL, Pachter L: Differential gene and transcript expression analysis of RNA-seq experiments with TopHat and Cufflinks. Nat Protoc 7: 562–578, 2012 [DOI] [PMC free article] [PubMed] [Google Scholar]
- 77.Anders S, Pyl PT, Huber W: HTSeq--a Python framework to work with high-throughput sequencing data. Bioinformatics 31: 166–169, 2015 [DOI] [PMC free article] [PubMed] [Google Scholar]
- 78.Robinson MD, McCarthy DJ, Smyth GK: edgeR: a Bioconductor package for differential expression analysis of digital gene expression data. Bioinformatics 26: 139–140, 2010 [DOI] [PMC free article] [PubMed] [Google Scholar]
- 79.Huang DW, Sherman BT, Tan Q, Kir J, Liu D, Bryant D, Guo Y, Stephens R, Baseler MW, Lane HC, Lempicki RA: DAVID Bioinformatics Resources: expanded annotation database and novel algorithms to better extract biology from large gene lists. Nucleic Acids Res 2007 [DOI] [PMC free article] [PubMed]
- 80.Giustarini D, Dalle-Donne I, Milzani A, Fanti P, Rossi R: Analysis of GSH and GSSG after derivatization with N-ethylmaleimide. Nat Protoc 8: 1660–1669, 2013 [DOI] [PubMed] [Google Scholar]
- 81.Kim HJ, Kim KW, Yu BP, Chung HY: The effect of age on cyclooxygenase-2 gene expression: NF-kappaB activation and IkappaBalpha degradation. Free Radic Biol Med 28: 683–692, 2000 [DOI] [PubMed] [Google Scholar]
- 82.Dexter DL, Kowalski HM, Blazar BA, Fligiel Z, Vogel R, Heppner GH: Heterogeneity of tumor cells from a single mouse mammary tumor. Cancer Res 38: 3174–3181, 1978 [PubMed] [Google Scholar]
- 83.Tomayko MM, Reynolds CP: Determination of subcutaneous tumor size in athymic (nude) mice. Cancer Chemother Pharmacol 24: 148–154, 1989 [DOI] [PubMed] [Google Scholar]
Associated Data
This section collects any data citations, data availability statements, or supplementary materials included in this article.


