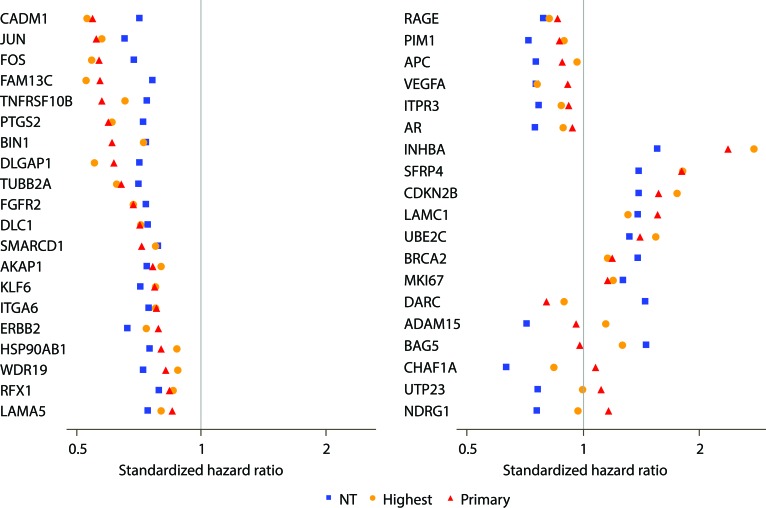
Figure 2. Comparison of strength of genes in predicting clinical recurrence when assessed in adjacent normal-appearing (NT) and tumor tissues (primary or highest Gleason pattern).
Forest plot representing the association of each of the 39 genes found to be predictors of clinical recurrence (FDR < 20%) in both tumor and NT. Standardized hazard ratios are shown as red triangles for the primary Gleason pattern tumor, orange circles for the highest Gleason pattern tumor, and blue squares for the adjacent NT.

