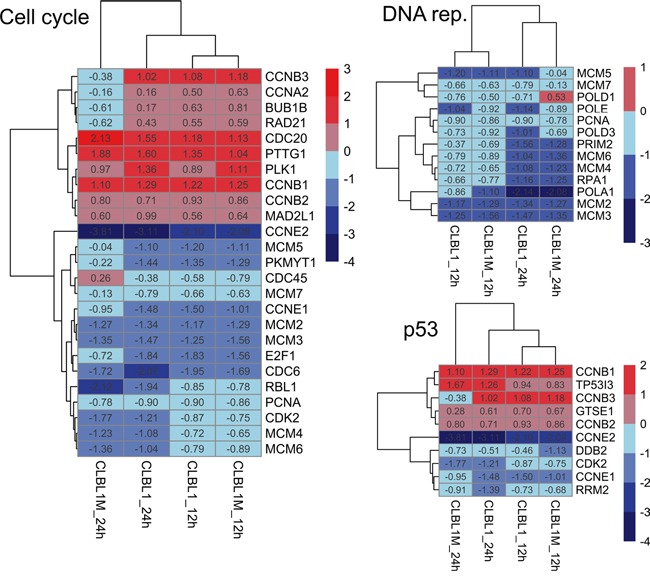
Figure 5. Heatmap of early (12 h) reacting genes in all high-dose treatment groups.

Genes with significantly different expression (FDR<0.001) in any of the high-dose treatments compared to controls were selected and displayed as a heatmap with euclidean distance clustering. Numbers given for each gene are the fold changes expressed as logarithmized ratios (base 2).
