
Figure 2. Comparison of the areas under the curves for survival prediction.
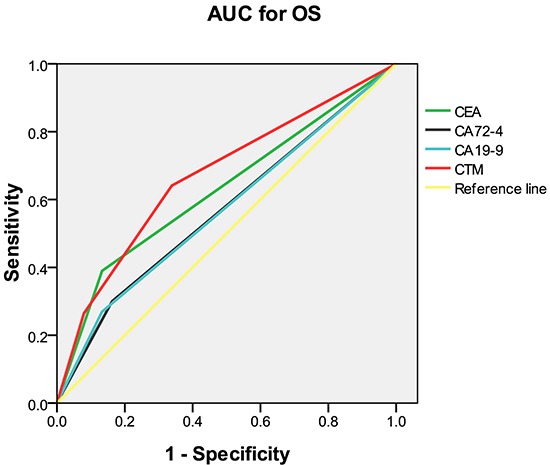
AUC = area under the curve; OS = overall survival; CEA = carcinoembryonic antigen; CA = carbohydrate antigen; CTM = the combination of preoperative tumor markers.
Official websites use .gov
A
.gov website belongs to an official
government organization in the United States.
Secure .gov websites use HTTPS
A lock (
) or https:// means you've safely
connected to the .gov website. Share sensitive
information only on official, secure websites.
AUC = area under the curve; OS = overall survival; CEA = carcinoembryonic antigen; CA = carbohydrate antigen; CTM = the combination of preoperative tumor markers.