

Abstract
Purpose
Quantify differences that exist between dosimetry models used for 90Y selective internal radiation therapy (SIRT).
Methods and Materials
Retrospectively, 37 tumors were delineated on 19 post-therapy quantitative 90Y SPECT/CT. Using matched volumes of interest (VOI), absorbed doses (AD) were reported using three dosimetry models: glass microsphere package insert standard model (SM), partition model (PM), and Monte Carlo (MC). Univariate linear regressions were performed to predict mean MC from SM and PM. Analysis was performed for two subsets: cases with a single tumor delineated (best case for PM); and cases with multiple tumors delineated (typical clinical scenario). Variability in PM from the ad hoc placement of a single spherical VOI to estimate the entire normal liver activity concentration for tumor (T) to non-tumoral liver (NL) ratios (TNR) was investigated. We interpreted the slope of the resulting regression as bias and the 95% prediction interval (95%PI) as uncertainty. represents MC absorbed doses to the NL for the single tumor patient subset; other combinations of calculations follow a similar naming convention.
Results
SM was unable to predict or (p>0.12, 95%PI>±177 Gy). However, SMsingle was able to predict (p<0.012) , albeit with large uncertainties; SMsingle and SMmultiple yielded biases of 0.62 and 0.71, and 95%PI of ±40 and ±32 Gy, respectively. and predicted (p<2E-6) and with biases of 0.52 and 0.54, and 95%PI of ±38 and ±111 Gy, respectively. TNR variability in increased the 95%PI for predicting (bias=0.46 and 95%PI=±103 Gy). TNR variability in modified the bias when predicting (bias=0.32 and 95%PI=±110 Gy).
Conclusions
SM is unable to predict mean MC tumor absorbed dose. PM is statistically correlated with mean MC, but the resulting uncertainties in predicted MC are large. Large differences observed between dosimetry models for 90Y SIRT warrant caution when interpreting published SIRT absorbed doses. To reduce uncertainty, we suggest the entire NL VOI be used for TNR estimates when using PM.
Keywords: SIRT, 90Y, dosimetry, SPECT/CT, brachytherapy
INTRODUCTION
Selective internal radiation therapy (SIRT) with 90Y microspheres has been shown to be an effective treatment option for unresectable hepatocellular carcinoma or metastatic colorectal cancer in the liver1,2. Dose calculations in radiation oncology have been at the voxel-level since the turn of the century3,4. In contrast, clinical dosimetry models for SIRT absorbed dose calculations currently provide only mean absorbed dose to volumes of interest (VOI). An obvious limitation of such models is the lack of spatial dose information (Figure 1). Unlike radiation oncology, clinical absorbed dose calculations for SIRT (undesirably) depend explicitly on delineated VOI masses. To be clear, radiation transport, and hence dose calculation, should not depend upon a user specified VOI superimposed on a patient. The mean absorbed dose calculations using partition model5 (PM) and standard model6 (SM) for glass microspheres require VOI segmentation which leads to additional variability in absorbed dose. Equations 1–3 describe mean absorbed doses [in Gy] using PM5 and SM6 where A is the administered activity to the liver volume [in GBq], MT and MNL represent the masses [in kg] of tumor (T) and non-tumoral liver (NL), respectively, and TNR is the ratio of T to NL activity concentration as defined by equations 4 and 5.
Figure 1.
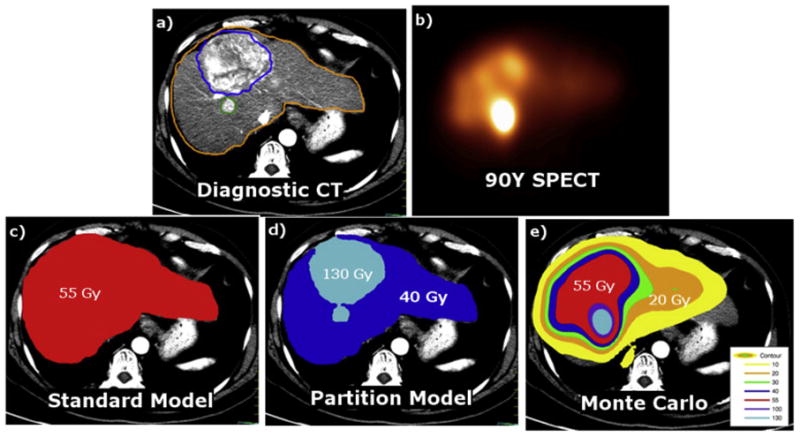
Spatial representation of the dosimetry models. Diagnostic CT (a), 90Y SPECT (b), SM (c), PM (d), MC (e). Gold, blue, red, and cyan color washes represent 20, 40, 55, and 130 Gy, respectively.
As described in the product package inserts6, planar 99mTc-MAA (macro aggregated albumin) scans are used to determine the lung shunt fraction for prevention of radiation pneumonitis. In clinical practice, the estimation of net 90Y activity in liver accounts for the MAA-based lung shunt from the administered activity, though recent studies suggest that planar imaging overestimates lung shunt fraction7,8. In this work, the activity in equations 1–3 is taken solely as the administered activity. Furthermore, 99mTc-MAA SPECT/CT may be acquired to assess perfused liver volumes while 90Y bremsstrahlung SPECT/CT or PET/CT may be used for post-therapy imaging of in vivo activity distribution and voxel dosimetry. 99mTc-MAA SPECT/CT could be used for predictive dosimetry but the concordance between MAA and 90Y microsphere in vivo distributions remains controversial9,10. For the TNR estimates required by PM, counts per unit area (from planar) or unit volume (from SPECT) are typically estimated for both T and NL. Counts are proportional to activity, and the ratio of the count or activity concentrations yields the dimensionless quantity TNR. In equations 1–3, the NL could be replaced with a NL target region, where the NL target region is a subset of the NL.
| (1) |
| (2) |
| (3) |
| (4) |
| (5) |
The best-expected clinical case for SM would be one with little to no NL volume. Figure 2a schematically illustrates the fundamental differences between the ideal scenario for PM with a single tumor and uniform uptake in T and NL (equations 1 and 2), and the more realistic clinical scenarios involving non-uniform activity distributions and multiple tumors. In clinical practice, PM absorbed doses are calculated for the aggregated tumor compartment ( ), and not individual tumors. There is no established consensus on how TNR of multiple tumors is to be estimated for use with the PM model; this further contributes to uncertainty in reported PM estimates.
Figure 2.
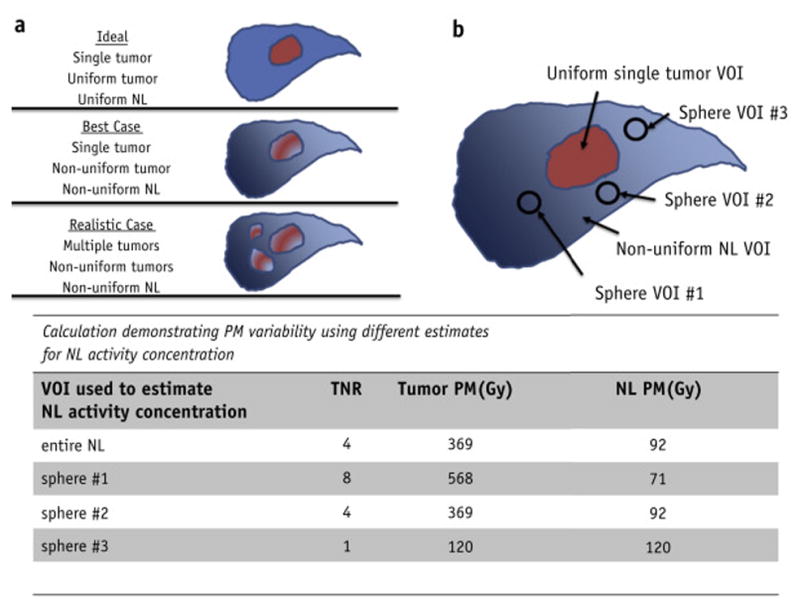
Illustration of the ideal, best-expected, and realistic case for PM calculations (a). TNR variability was introduced into PM absorbed doses by sampling the non-tumoral liver activity concentration with a single sphere multiple times (b). In total, the variability was characterized by 4 TNRs: using the entire non-tumoral liver VOI and 3 spheres. Example calculations in the figure were performed assuming MNT =1.8 kg, MT =0.2 kg, A=4.8 GBq, and a conversion constant of 50 Gy-kg/GBq
In addition to inter- and intra-observer VOI mass variability, the methodology used to determine TNR in PM introduces additional variability. There are at least two methods to estimate TNR found in the literature: use entire VOIs or use a sphere to estimate the TNR11. Use of the entire VOI is the most logical method, however, often due to convenience (image registration and segmentation require additional resources), in routine clinical practice one finds that a single sphere is most often used to estimate TNR12. Unfortunately, such methodology relies on the assumption of uniform activity distribution. Additional variations in methodology include using a population based TNR13 or using the maximum tumor activity concentration as opposed to the mean14. PM TNR variability is illustrated in Figure 2b.
The radiotherapy community appreciates the importance of accurate dose calculation methods and that differences may exist between dosimetry models. The purpose of this work is to demonstrate differences in dosimetry models used for 90Y SIRT, and to assess how well SM and PM predict Monte Carlo (MC) tumor and NL doses. This is accomplished by transforming (linear regression) SM and PM to MC estimated mean absorbed doses. We interpret the slope and 95% prediction interval (95%PI) from the linear regressions as bias and uncertainty, respectively. In addition, we quantify the effect of variability in PM TNR introduced by sampling with a single sphere as a surrogate for the entire NL VOI on prediction of MC mean absorbed doses.
METHODS AND MATERIALS
Patients & Post-therapy 90Y Bremsstrahlung Imaging
This retrospective dosimetric analysis was conducted under XXXXXXXXXXXXXX Institutional Review Board-approved chart review protocol. Nineteen hepatocellular carcinoma cases treated with 90Y-glass microspheres (Therasphere, BTG International) were arbitrarily selected from our patient database. There was no strict patient selection criteria applied in this study because the study objective was a comparison of dosimetry models. For each patient, the input VOIs and administered activity were constant for the different dosimetry models. Administered activity was prescribed based on the package insert SM dosimetry; this included a lung shunt fraction calculated from 99mTc MAA planar images. In our clinic, the target volumes consisted of the entire liver or a single lobe as determined by the clinician. Average administered activity was 3.1 ± 1.3 GBq and ranged from 1.1 to 7.5 GBq. Two patient sub-populations were identified for additional analysis: those with single tumors (n=7) representing the near-ideal clinical scenario for PM, and those with multiple tumors (n=12) representing the more realistic clinical scenario.
Post-therapy 90Y SPECT/CT was performed on a Symbia T6 or T16 (Siemens Medical Solutions) with medium-energy low-penetration collimators. A 90–125 keV primary window and 312–413 keV scatter window for 128 views over 360° with 28 s/view. SPECT reconstruction parameters were the following: ordered-subset expectation maximization (Flash3D, Siemens Medical Solutions); 4 iterations and 8 subsets; 9.6 mm FWHM Gaussian filter; geometric collimator response modelling; CT-based attenuation correction based on effective energy of the window width; energy window-based scatter correction15. For voxel-level dose calculations, the activity in each voxel was calculated using a self-calibration factor (administered activity/total counts in SPECT).
Contouring
All contours were delineated by a single physician, XXX, using MiM Maestro. Total liver, right lobe, and left lobe were contoured directly on the CT from the 90Y SPECT/CT using window width of 160 HU and level of 40HU. Tumors (n=37) were segmented with the aid of a rigidly registered diagnostic scan (contrast enhanced CT or MRI). NL VOI was generated via Boolean subtraction of contoured total liver and tumor VOIs. Due to spatial resolution of SPECT, the delineated tumors included in this study were required to have minimum dimension ≥ 2.5 cm in diameter.
Dose Calculations
SM, PM, and MC were evaluated using the administered activity and post-therapy 90Y SPECT/CT. TNR for PM was derived from the 90Y SPECT. SM and PM were calculated according to equations 1–3. PM calculations were performed using a TNR based on the entire NL VOI. Three additional PM calculations were performed with TNR based on sampling the NL activity concentration using a sphere VOI (d=2.5 cm) as described in Figure 2b. The PM variability due to TNR (PM+TNR) was estimated using the four PM calculations. For PM cases with multiple tumors, the TNR was estimated by weighting TNR with the tumor mass as described by equations 4 and 5, where the superscript i is for individual tumors.
Voxel-level MC absorbed doses were calculated with the EGSnrc user code DOSXYZnrc. Further details regarding its application to 90Y are published elsewhere16. Percent differences in absorbed dose calculations for tumors and NL were computed between MC and those from SM and PM. The percent difference of X versus Y is defined as .
represents MC mean absorbed dose to the tumor for the single tumor patient subset; MCNL represents MC absorbed dose to the NL for all patients. SMmultiple represents both the absorbed dose to tumor and NL for the subset of patients with multiple tumors; it does not have a subscript because SM treats tumors and NL as the same volume. Other combinations of dose measurements follow a similar naming convention.
Statistical analysis
Paired t-tests were performed when comparing the different dosimetry models for both tumors and NL. PM with TNR variability was excluded from the t-tests due to the extra variability included from various TNRs. To predict MC absorbed doses, univariate linear regressions were generated using SM or PM as the independent variable. We report Pearson’s product moment correlation coefficient, its p-value, slope, intercept, and average 95% prediction interval over the SM and PM domains. All analyses were performed with the statistical computing environment R v3.1.217. Results were deemed statistically significant at the level of α = 0.05.
RESULTS
Boxplots summarizing the absolute differences between SM, PM, and MC for both tumor and NL are shown in Figure 3. The median of PMT is approximately a factor of 2 higher than both SM and MCT; while the median of MCNL is nearly half that of SM and PMNL. Summaries of absolute doses and percent differences by tumor subsets are provided as Supplemental Table 1 and Supplemental Table 2. The t-tests showed that absorbed dose differences between various dosimetry models were statistically significant (p<0.05) except for the following cases: versus SMsingle, SMsingle versus , SMmultiple versus , and SM versus MCT.
Figure 3.
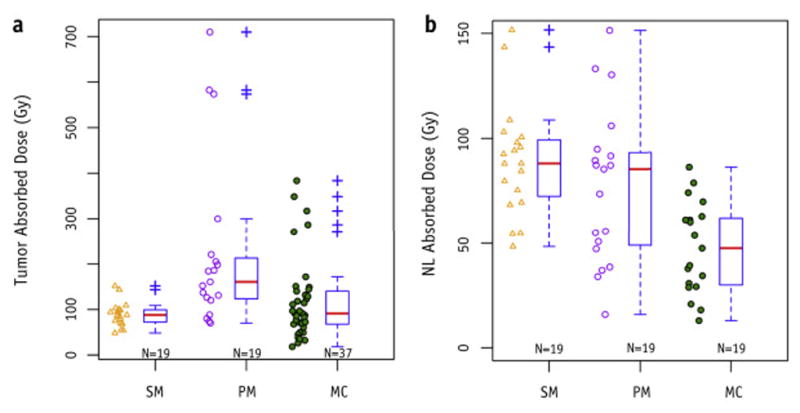
Box plots summarizing the absorbed doses from different dosimetry models over all patients for tumors (a) and non-tumoral liver (b). Default settings in R were used to calculate boxplot parameters. Red bars represent the median value. Top and bottom of boxes represent the 75th and 25th percentiles. Outliers are defined as a point greater (or less) than 1.5 times the interquartile range above (or below) the upper (or lower) quartile.
For tumors, the smallest standard deviation in percent difference was for versus and the largest was for versus SMsingle (σ = 202%). The remaining standard deviations for tumor subsets ranged from 69% to 153%. For NL, the smallest standard deviation varied from 20% to 30% for both PM versus MC and PM versus SM; the largest ranged from 70% to 85% for SM versus MC.
Figure 4 shows the linear regressions for predicting MC from SM, from PM, and from PM+TNR for both single and multiple tumor subsets. Figure 5 summarizes the bias (slope) and uncertainty (95%PI) for PM and PM+TNR. SM was unable to predict tumor absorbed doses for any subset (Figures 4a & 4d, Supplemental Table 2), however, SM appears to be predictive of NL doses, albeit with large 95% confidence and prediction intervals (Figures 4g & 4j, Supplemental Table 2). and , the best case for PM, had the smallest 95% intervals (Figures 4b & 4h). However, adding TNR variability to and increased the corresponding 95%PI substantially (Figures 4c, 4i, 5c, & 5d).
Figure 4.

Predicting mean MC absorbed doses through linear regression of SM (left column), PM (center column), or PM+TNR variability (right column) for tumor (top two rows) and normal liver absorbed doses (bottom two rows). Both the single tumor subset (first and third rows) and multiple tumor subsets (second and fourth rows) are shown. Shaded bands represent 95% confidence intervals. Dashed lines represent 95% prediction intervals.
Figure 5.

Summary of linear regression slopes (bias) and 95% prediction intervals (uncertainty) for SM, PM, and PM+TNR variability. Error bars represent the 95% confidence interval. SM was not displayed for linear regression of tumor absorbed doses because no statistically significant correlations were found between SM and MC for tumors.
DISCUSSION
For tumors, the variation in percent dose differences between models was found to be large. We calculated standard deviations of ~24% in the best case scenario of versus . The standard deviation increased to ~120% for the realistic case of versus , and further increased to 150% to 200% when comparing between PM and SM for tumor absorbed doses (Supplemental Table 2). The 95%PI determined from linear regressions revealed trends similar to the percent dose differences; the single tumor subset had smaller predicted uncertainty for PM tumor absorbed doses compared to the multiple tumor subset: ±38 Gy for versus , and ±111 Gy for versus .
Given that the package insert dosimetry model for glass microspheres employs SM, it is encouraging that SM was able to predict MC absorbed doses to NL (Figures 4g, 4j, 5b, & 5d), although the confidence and prediction intervals were wide (95%PI ~40 Gy). The observed agreement between SM and MC absorbed doses for NL may depend on the fraction of NL to treatment volume; the NL involvement of the treatment volume in our study population ranged from 2% to 86% with a mean value of 21%. Nonetheless, this finding supports SM being a “safe” dosimetry model regarding NL absorbed dose calculations. In addition to safety information, tumor dose is also important for treatment efficacy. Here, however, SM was unable to predict or (p>0.12, 95%PI > ±177 Gy) (Figures 4a & 4d); this was not unexpected because SM does not differentiate between tumor and NL.
As expected, versus regression analysis yielded the smallest 95%PI of ±38 Gy. However, when TNR variability was added the 95%PI for increased by a factor of ≈2.5 to ±103 Gy (Figures 5c). The 95%PI for single tumor PM+TNR was similar in magnitude to the 95%PI of versus without TNR variability (Figure 5c). PM demonstrates good correlation with MC for single tumor cases; it appears reasonable for predicting mean absorbed doses for single tumor cases when the entire NL VOI is used to calculate TNR with a 95% PI of ±38 Gy (Figures 4b & 4h). However, given the clinically realistic scenario of multiple tumors and the common practice of determining TNR based on a single sphere in NL, there is much greater variability in PM tumor absorbed doses (95% PI of ±110 Gy). This added variability decreases the utility of PM in determining tumor doses. Therefore, the results of our work suggest that TNR for PM dosimetry should be based on delineation of the entire NL VOI.
This work did not require an absolute ground truth for absorbed dose, because a common frame of reference (MC) is sufficient for quantifying the differences between dosimetry models. In general, MC is considered the gold standard for dose calculations, but for liver directed 90Y SIRT other voxel dosimetry methods including local deposition or kernel-based methods are nearly as accurate and easily implemented16,18–20.
Biases likely exist between dosimetry models based on calibration that may contribute to the observed biases (Figure 5). We used self-calibration for MC absorbed doses. On the other hand, SM and PM perform an implicit calibration; they assume that all administered activity (excluding lung shunt) will be inside the VOI defined as liver. A scalar compensation factor could potentially be introduced into equations 1–3 to compensate for biases observed with PM and SM. However, the observed biases may not be generalizable because the MC doses are based on SPECT or PET emission images that may be affected by the acquisition and reconstruction parameters. More importantly, the bias compensation factor would not reduce the large variability that arises from multiple tumors or single sphere sampling to determine TNR.
It is generally accepted in the SIRT community that PM is theoretically superior to the empirical body surface area and SM. Inter- and intra-observer variation studies must be performed to demonstrate that TNR used with PM is reproducible. However, as shown in this work, variability in determining TNR for PM increases the uncertainty of absorbed doses and reduces the precision of predicted absorbed doses to individual tumors and NL.
There is mounting evidence that the current state of emission imaging is adequate for post-therapy analysis21,22, and several publications have shown tumor dose response data for SIRT23–25. Further refinements in emission image quality and quantitation will likely aid in reducing biases of voxel-level absorbed doses on both planning and post-therapy scans. Such refinements are not likely to reduce bias and uncertainty in SM and PM because these models have inherent limitations and are less dependent on emission image quality compared to voxel-level absorbed doses such as MC. Given the large absorbed dose gradients in SIRT, segmentation variability may be a limiting factor for all dosimetry models.
SIRT has been for many years primarily a palliative treatment, so larger uncertainties in absorbed dose calculations have been clinically acceptable. However, the potential of SIRT goes well beyond palliation and the recent correlations between dosimetry and tumor response and survival reveal the progress in understanding the therapeutic benefit of SIRT24–31. Accurate and reproducible dose calculations will be needed to optimize the SIRT therapeutic ratio in a consistent manner. Correcting for biases across dosimetry models is paramount in interpreting clinical studies that use different dosimetry models. This will facilitate the safe combination of different radiation modalities, and, most importantly, improve the efficacy of current palliative treatments while expanding the role of SIRT to include local control. In this manuscript we have used matched VOIs to show that current clinical dosimetry models contribute substantial uncertainty to SIRT absorbed doses. To the best of our knowledge, this is the first work to quantitatively demonstrate differences among SIRT dosimetry models using matched VOIs on 90Y SPECT/CT.
There are other sources of variability that were not included in this study; namely, segmentation for both tumor and NL VOIs26, registration, and maximum versus mean tumor activity concentration when calculating TNR. Nonetheless, we expect the general trends of our results will hold when applied to other emission images (planned 99mTc-MAA SPECT/CT or post-therapy 90Y PET/CT) found in SIRT.
To conclude, we have shown in this work that significant differences exist between dosimetry models for 90Y microsphere SIRT. In this controlled study with matched VOIs, we generally found large uncertainty in predicted MC absorbed doses as shown by the 95%PI for both SM and PM. However, for single tumor cases with TNR from the entire NL VOI, the PM has modest uncertainty in predicting MC. We have demonstrated that for an individual patient’s VOI, absorbed doses calculated using Monte Carlo voxel dosimetry are not equivalent to those from the standard model or the partition model. We therefore suggest that reporting of absorbed doses in SIRT be accompanied by the dosimetry model used for its calculation. The large variability in predicted mean MC absorbed doses from both SM and PM suggests that adoption of voxel-level dosimetry models is needed to reduce uncertainty in 90Y SIRT absorbed dose calculations. The availability of multiple voxel dosimetry approaches (local deposition or kernel-based methods) for 90Y SIRT, that are as accurate as MC yet easily implemented and computationally efficient, argues for the replacement of PM and SM with voxel dosimetry in clinical practice.
Supplementary Material
SUMMARY.
Relative to external beam, currently used standard (SM) and partition (PM) dosimetry models for 90Y SIRT are simplistic. We show that large differences exist in calculated mean absorbed doses when voxel-level Monte Carlo (MC) calculations are compared to SM and PM absorbed doses. SM is unable to predict individual mean MC tumor absorbed dose. PM is statistically correlated to mean MC absorbed dose, but with large uncertainties in predicted values.
Acknowledgments
Supported in part by the National Institutes of Health through grant R01CA138986 and MD Anderson’s Cancer Center Support Grant CA016672. The authors thank Adam Neff from MiM Software for providing the Maestro license.
Footnotes
Conflict of Interest Notification: AM receives research support from BTG and Sirtex.
Publisher's Disclaimer: This is a PDF file of an unedited manuscript that has been accepted for publication. As a service to our customers we are providing this early version of the manuscript. The manuscript will undergo copyediting, typesetting, and review of the resulting proof before it is published in its final citable form. Please note that during the production process errors may be discovered which could affect the content, and all legal disclaimers that apply to the journal pertain.
References
- 1.Smits MLJ, Elschot M, Sze DY, et al. Radioembolization Dosimetry: The Road Ahead. CardioVascular and Interventional Radiology. 2015;38(2):261–269. doi: 10.1007/s00270-014-1042-7. [DOI] [PubMed] [Google Scholar]
- 2.Dezarn WA, Cessna JT, DeWerd LA, et al. Recommendations of the American Association of Physicists in Medicine on dosimetry, imaging, and quality assurance procedures for [sup 90]Y microsphere brachytherapy in the treatment of hepatic malignancies. Medical Physics. 2011;38(8):4824–4845. doi: 10.1118/1.3608909. [DOI] [PubMed] [Google Scholar]
- 3.Purdy JA. Photon dose calculations for three-dimensional radiation treatment planning. Seminars in Radiation Oncology. 1992;2(4):235–245. doi: 10.1016/1053-4296(92)90021-C. [DOI] [PubMed] [Google Scholar]
- 4.Kutcher GJ, Mohan R. Introduction: Three-dimensional treatment delivery. Seminars in Radiation Oncology. 1995;5(2):75–76. doi: 10.1016/S1053-4296(95)80001-8. [DOI] [PubMed] [Google Scholar]
- 5.Ho S, Lau WY, Leung TW, et al. Partition model for estimating radiation doses from yttrium-90 microspheres in treating hepatic tumours. Eur J Nucl Med. 1996;23(8):947–952. doi: 10.1007/BF01084369. [DOI] [PubMed] [Google Scholar]
- 6.Therasphere (TM) Biocompatibles UK Ltd; 2014. package insert. [Google Scholar]
- 7.Elschot M, Nijsen JFW, Lam MGEH, et al. 99mTc-MAA overestimates the absorbed dose to the lungs in radioembolization: a quantitative evaluation in patients treated with 166Ho-microspheres. Eur J Nucl Med Mol Imaging. 2014;41(10):1965–1975. doi: 10.1007/s00259-014-2784-9. [DOI] [PubMed] [Google Scholar]
- 8.Mauxion T, Hobbs R, Herman J, et al. Comparison of lung shunt fraction (LSF) from pre-therapy 99mTc MAA and post-therapy quantitative 90Y imaging in microsphere (MS) radioembolization. J Nucl Med. 2015;56(supplement 3):104–104. [Google Scholar]
- 9.Garin E, Lenoir L, Rolland Y, et al. Dosimetry Based on 99mTc-Macroaggregated Albumin SPECT/CT Accurately Predicts Tumor Response and Survival in Hepatocellular Carcinoma Patients Treated with 90Y-Loaded Glass Microspheres: Preliminary Results. J Nucl Med. 2012;53(2):255–263. doi: 10.2967/jnumed.111.094235. [DOI] [PubMed] [Google Scholar]
- 10.Wondergem M, Smits MLJ, Elschot M, et al. 99mTc-Macroaggregated Albumin Poorly Predicts the Intrahepatic Distribution of 90Y Resin Microspheres in Hepatic Radioembolization. J Nucl Med. 2013 Aug; doi: 10.2967/jnumed.112.117614. [DOI] [PubMed] [Google Scholar]
- 11.Kao YH, Tan AEH, Burgmans MC, et al. Image-Guided Personalized Predictive Dosimetry by Artery-Specific SPECT/CT Partition Modeling for Safe and Effective 90Y Radioembolization. J Nucl Med. 2012;53(4):559–566. doi: 10.2967/jnumed.111.097469. [DOI] [PubMed] [Google Scholar]
- 12.Ilhan H, Goritschan A, Paprottka P, et al. Predictive Value of 99mTc-MAA SPECT for 90Y-Labeled Resin Microsphere Distribution in Radioembolization of Primary and Secondary Hepatic Tumors. J Nucl Med. 2015;56(11):1654–1660. doi: 10.2967/jnumed.115.162685. [DOI] [PubMed] [Google Scholar]
- 13.Campbell JM, Wong CO, Muzik O, Marples B, Joiner M, Burmeister J. Early Dose Response to Yttrium-90 Microsphere Treatment of Metastatic Liver Cancer by a Patient-Specific Method Using Single Photon Emission Computed Tomography and Positron Emission Tomography. International Journal of Radiation Oncology*Biology*Physics. 2009;74(1):313–320. doi: 10.1016/j.ijrobp.2008.12.058. [DOI] [PubMed] [Google Scholar]
- 14.Gulec SA, Mesoloras G, Dezarn WA, McNeillie P, Kennedy AS. Safety and efficacy of Y-90 microsphere treatment in patients with primary and metastatic liver cancer: The tumor selectivity of the treatment as a function of tumor to liver flow ratio. J Transl Med. 2007;5:15. doi: 10.1186/1479-5876-5-15. [DOI] [PMC free article] [PubMed] [Google Scholar]
- 15.Siman W, Kappadath SC. Energy window based scatter correction for improved 90Y bremsstrahlung imaging [abstract] Journal of Nuclear Medicine. 2013;54(Supplement 2):527. [Google Scholar]
- 16.Mikell JK, Mahvash A, Siman W, Mourtada F, Kappadath SC. Comparing voxel-based absorbed dosimetry methods in tumors, liver, lung, and at the liver-lung interface for 90 Y microsphere selective internal radiation therapy. EJNMMI Physics. 2015;2(1):16. doi: 10.1186/s40658-015-0119-y. [DOI] [PMC free article] [PubMed] [Google Scholar]
- 17.R Core Team. R: A Language and Environment for Statistical Computing. Vienna, Austria: R Foundation for Statistical Computing; 2015. https:/www.R-project.org. [Google Scholar]
- 18.Dieudonné A, Garin E, Laffont S, et al. Clinical Feasibility of Fast 3-Dimensional Dosimetry of the Liver for Treatment Planning of Hepatocellular Carcinoma with 90Y-Microspheres. Journal of Nuclear Medicine. 2011;52(12):1930–1937. doi: 10.2967/jnumed.111.095232. [DOI] [PubMed] [Google Scholar]
- 19.Pasciak AS, Erwin WD. Effect of Voxel Size and Computation Method on Tc-99m MAA SPECT/CT-Based Dose Estimation for Y-90 Microsphere Therapy. IEEE Trans Med Imaging. 2009;28(11):1754–1758. doi: 10.1109/TMI.2009.2022753. [DOI] [PubMed] [Google Scholar]
- 20.Sanchez-Garcia M, Gardin I, Lebtahi R, Dieudonné A. A new approach for dose calculation in targeted radionuclide therapy (TRT) based on collapsed cone superposition: validation with 90Y. Phys Med Biol. 2014;59(17):4769. doi: 10.1088/0031-9155/59/17/4769. [DOI] [PubMed] [Google Scholar]
- 21.Elschot M, Lam MGEH, van den Bosch MAAJ, Viergever MA, de Jong HWAM. Quantitative Monte Carlo–Based 90Y SPECT Reconstruction. J Nucl Med. 2013 Sep; doi: 10.2967/jnumed.112.119131. [DOI] [PubMed] [Google Scholar]
- 22.Rong X, Du Y, Ljungberg M, Rault E, Vandenberghe S, Frey EC. Development and evaluation of an improved quantitative [sup 90]Y bremsstrahlung SPECT method. Medical Physics. 2012;39(5):2346–2358. doi: 10.1118/1.3700174. [DOI] [PMC free article] [PubMed] [Google Scholar]
- 23.Garin E, Lenoir L, Edeline J, et al. Boosted selective internal radiation therapy with 90Y-loaded glass microspheres (B-SIRT) for hepatocellular carcinoma patients: a new personalized promising concept. Eur J Nucl Med Mol Imaging. 2013;40(7):1057–1068. doi: 10.1007/s00259-013-2395-x. [DOI] [PMC free article] [PubMed] [Google Scholar]
- 24.Chiesa C, Mira M, Maccauro M, et al. Radioembolization of hepatocarcinoma with 90Y glass microspheres: development of an individualized treatment planning strategy based on dosimetry and radiobiology. Eur J Nucl Med Mol Imaging. 2015;42(11):1718–38. doi: 10.1007/s00259-015-3068-8. [DOI] [PubMed] [Google Scholar]
- 25.Cremonesi M, Chiesa C, Strigari L, et al. Radioembolization of Hepatic Lesions from a Radiobiology and Dosimetric Perspective. Front Oncol. 2014:4. doi: 10.3389/fonc.2014.00210. [DOI] [PMC free article] [PubMed] [Google Scholar]
- 26.Chiesa C, Mira M, Maccauro M, et al. A dosimetric treatment planning strategy in radioembolization of hepatocarcinoma with 90Y glass microspheres. Q J Nucl Med Mol Imaging. 2012;56(6):503–508. [PubMed] [Google Scholar]
- 27.Garin E, Rolland Y, Laffont S, et al. Clinical impact of 99mTc-MAA SPECT/CT-based dosimetry in the radioembolization of liver malignancies with 90Y-loaded microspheres. Eur J Nucl Med Mol Imaging. 2016;43(3):559–75. doi: 10.1007/s00259-015-3157-8. [DOI] [PMC free article] [PubMed] [Google Scholar]
- 28.Garin E. Radioembolization with 90Y-loaded microspheres: high clinical impact of treatment simulation with MAA-based dosimetry. Eur J Nucl Med Mol Imaging. 2015;42(8):1189–91. doi: 10.1007/s00259-015-3073-y. [DOI] [PubMed] [Google Scholar]
- 29.Garin E, Rolland Y, Edeline J, et al. Personalized dosimetry with intensification using 90Y-loaded glass microsphere radioembolization induces prolonged overall survival in hepatocellular carcinoma patients with portal vein thrombosis. J Nucl Med. 2015;56(3):339–46. doi: 10.2967/jnumed.114.145177. [DOI] [PubMed] [Google Scholar]
- 30.Edeline J, Du FL, Rayar M, et al. Glass Microspheres 90Y Selective Internal Radiation Therapy and Chemotherapy as First-Line Treatment of Intrahepatic Cholangiocarcinoma. Clin Nucl Med. 2015 Nov;40(11):851–5. doi: 10.1097/RLU.0000000000000904. [DOI] [PubMed] [Google Scholar]
- 31.Strigari L, Sciuto R, Rea S, et al. Efficacy and toxicity related to treatment of hepatocellular carcinoma with 90Y-SIR spheres: radiobiologic considerations. J Nucl Med. 2010;51(9):1377–85. doi: 10.2967/jnumed.110.075861. [DOI] [PubMed] [Google Scholar]
Associated Data
This section collects any data citations, data availability statements, or supplementary materials included in this article.