

Abstract
Peroxisome proliferator activated receptor (PPARγ) is a nuclear receptor transcription factor that regulates adipogenesis and energy homeostasis. Recent studies suggest PPARγ may mediate some of its metabolic effects through actions in the brain. We used a Cre-recombinase-dependent (using NestinCre) conditionally activatable transgene expressing either wild-type (WT) or dominant-negative (P467L) PPARγ to examine mechanisms by which PPARγ in the nervous system controls energy balance. Inducible expression of PPARγ was evident throughout the brain. Expression of 2 PPARγ target genes, aP2 and CD36, was induced by WT but not P467L PPARγ in the brain. Surprisingly, NesCre/PPARγ-WT mice exhibited severe microcephaly and brain malformation, suggesting that PPARγ can modulate brain development. On the contrary, NesCre/PPARγ-P467L mice exhibited blunted weight gain to high-fat diet, which correlated with a decrease in lean mass and tissue masses, accompanied by elevated plasma GH, and depressed plasma IGF-1, indicative of GH resistance. There was no expression of the transgene in the pancreas but both fasting plasma glucose, and fed and fasted plasma insulin levels were markedly decreased. NesCre/PPARγ-P467L mice fed either control diet or high-fat diet displayed impaired glucose tolerance yet exhibited increased sensitivity to exogenous insulin and increased insulin receptor signaling in white adipose tissue, liver, and skeletal muscle. These observations support the concept that alterations in PPARγ-driven mechanisms in the nervous system play a role in the regulation of growth and glucose metabolic homeostasis.
Peroxisome proliferator activated receptor (PPARγ) is a nuclear receptor transcription factor best recognized for its role in adipogenesis and lipid metabolism. Agonists of PPARγ, thiazolidinediones (TZDs), offer protection against type 2 diabetes and have been shown to reduce cardiovascular events such as stroke and to reduce cardiovascular risk in renal failure (1–5). Unfortunately, TZDs are no longer routinely prescribed because of adverse effects, including weight gain, fluid retention, bone fracture, and possibly neoplasms (6).
PPARγ is expressed in the central nervous system (CNS) (7). Recent studies suggest that PPARγ in the brain regulates feeding behavior; and based on this, PPARγ activation in the brain is thought to mediate at least some of the adverse effects of TZDs (8, 9). Administration of TZD into the brain or expression of a constitutively active PPARγ in the hypothalamus promotes weight gain whereas inhibiting PPARγ prevents weight gain (9). Similarly, ablating PPARγ in neurons caused a reduction in food intake and increased energy expenditure (EE) in mice fed a high-fat diet (HFD) (8). Consistent with the antioxidant properties of PPARγ, TZD administration reduced oxidative stress in the arcuate nucleus, which was associated with increased activity of orexigenic agouti-related protein/neuropeptide Y neurons and decreased activity of anorexigenic proopiomelanocortin (POMC) neurons (10). Cell-specific ablation of PPARγ in POMC neurons protected mice from diet-induced obesity (11). We recently reported that inducible expression of dominant-negative (DN) PPARγ specifically in POMC neurons can affect metabolic homeostasis under certain dietary conditions, although the effects of PPARγ interference were more subtle that complete ablation of PPARγ in POMC neurons (12).
Because of these subtle effects caused by DN PPARγ interference in POMC neurons, we considered the possibility that interfering with PPARγ throughout the CNS may have more profound effects on energy homeostasis. Thus, we generated 2 transgenic mouse models in which either wild-type (WT) human PPARγ (PPARγ-WT) or the DN mutant (P467L) form of human PPARγ is conditionally expressed in the nervous system via the neuronal Nestin promoter. Neuron-specific expression of PPARγ-WT caused widespread abnormalities in brain development and premature death. On the contrary, global interference with PPARγ function in the CNS leads to impaired growth, resistance to diet-induced obesity associated with decreased lean mass, and a redistribution of adipose tissue, GH resistance, and abnormalities in glucose and insulin. Interestingly, the mice are exquisitely sensitive to exogenous insulin.
Materials and Methods
Generation of conditional human PPARγ transgenic mice
Transgenic mice conditionally expressing a human DN mutant (P467L) form of PPARγ were generated at the University of Iowa Gene Editing Facility. CAG-PPARγ-P467L mice carry a transgene designed to express both PPARγ (P467L) and the tdTomato reporter gene after its selective activation by Cre-recombinase (12, 13). Neural overexpression of the mutant (P467L) form of PPARγ was achieved by crossing CAG-PPARγ-P467L-T mice with Nestin-Cre mice (B6.Cg-Tg(Nes-cre)1Kln/J; stock 003771), purchased from The Jackson Laboratory) (14). NestinCre/PPARγ-P467L and NestinCre/PPARγ-WT along with their littermate controls were used for the experiments described here. All procedures have been approved by the University of Iowa Institutional Animal Care and Use Committee. Mice were kept under standard laboratory conditions, with free access to food and water.
Western blotting for transgenic PPARγ protein
About 100 mg of each tissue (brain, liver, spleen, pancreas, adipose, or muscle) were homogenized in a lysis buffer containing 50 mmol/L Tris-HCl buffer, 0.1 mmol/L EDTA, 0.1 mmol/L EGTA (pH 7.5), and 0.1% vol/vol sodium dodecyl sulfate, with protease inhibitors (Thermo Scientific). Protein concentration was determined using the BCA assay (Pierce Protein Research Products). Protein lysates were separated by SDS-PAGE gel and transferred to polyvinylidene difluoride membranes (Immobilon-P; Millipore). Membranes were blocked for 30 minutes at room temperature with 5% BSA in Tris-buffered saline with 0.1% Tween 20 (TBS-T). PPARγ expression was determined using a monoclonal anti-PPARγ antibody (C26H12; Cell Signaling Technology) at a dilution of 1:1000 (in 5% BSA/TBS-T). Secondary antibodies for PPARγ was a donkey antirabbit IgG (NA934; GE Healthcare Life Sciences) used at 1:10 000 dilution. Specificity was assess by comigration with recombinant PPARγ expressed in HEK293 cells and by the absence of signal in tissues from nontransgenic mice. AKT and phospho-AKT (Ser473) expression was detected using anti-AKT (9272; Cell Signaling Technology) and anti-phospho-AKT (9271; Cell Signaling Technology) antibodies at a dilution of 1:2000 for anti-phospho-AKT (in 5% BSA/TBS-T) and 1:2000 (in 5% skim milk) for total AKT. The secondary antibody for AKT was a goat antirabbit IgG horseradish peroxidase-linked antibody (7074; Cell Signaling) diluted 1:10 000 in 5% milk/TBS. Rabbit anti-β-actin was used as a loading control at a dilution of 1:10 000 (ab8229; AbCam). Primary antibodies were diluted and incubated overnight at 4°C. Secondary antibodies were applied for 1 hour at room temperature. Blots were treated with Pierce SuperSignal Western Pico chemiluminescence reagent for visualization.
Quantitative real-time PCR analysis
Brain tissue (100 μg) was suspended in ice-cold TRIzol (Invitrogen). Total RNA was isolated using RNeasy spin columns (RNeasy Mini Plus kit; QIAGEN) following the manufacturer's instructions. The RNA concentration was determined using a NanoDrop ND-1000. cDNA was generated using SuperScript (Invitrogen). Quantitative real-time PCR was performed using the TaqMan (applied Biosystems) gene expression assay from 10.0-ng cDNA in a total volume of 10.0 μL following the manufacturer's recommendations. The assay numbers for TaqMan (Applied Biosystems) probes were: Mm99999915_g1 (mouse glyceraldehyde 3 phosphate dehydrogenase [GAPDH]) and human PPARγ (Hs01115513_m1). The expression of tdTomato (forward, 5′-CAC CAT CGT GGA ACA GTA CG-3′ and reverse, 5′-GCG CAT GAA CTC TTT GAT GA-3′) was determined using SYBR green (Bio-Rad) according to the manufacturer's protocol. Mouse GAPDH was used as an internal control.
Diets
All mice were fed either 60% HFD (D12492; Research Diets) or isocaloric-match control diet (D12450J; Research Diets) starting at 5 weeks of age for 15 weeks. Body weights from group-housed mice were measured weekly at 8–9 am until 20 weeks of age. All experiments were performed at 20 weeks of HFD, unless otherwise reported. Daily food intake was assessed in individually housed mice.
Measurement of body composition
Body composition was measured at the end of diet treatment period (25 wk) in vivo by Nuclear Magnetic Resonance (Bruker Minispec LF-90). Both male and female NestinCre/PPARγ-P467L and control mice (on either HFD or control diet) were evaluated.
Measurement of EE
Male NestinCre/PPARγ-P467L and control mice, 20 weeks of age, on HFD were individually housed for 1 week before measurements. Mice were placed into temperature-controlled (30°C), insulated chambers for estimation of heat production by respirometry (15). First, the CO2 (model CD-3A; AEI) and O2 analyzers (model S-3A/II; AEI) were calibrated to standardized air containing 5000 ppm CO2 and 20.50% O2 (Praxair), respectively. Mice were then placed into water-jacketed, temperature-controlled, and air-sealed chambers, and the change in effluent O2 and CO2 concentrations were recorded using PowerLab and Chart software (AD Instruments). Flow was determined by mass flow meters (EM1; Sensiron) to standard temperature and pressure-corrected flow values. Heat production was estimated using the equation based on Lusk (1928): heat = O2 consumed (VO2) [1.232 respiratory exchange ratio (RER) + 3.815], where VO2 = [ΔO2%] · [STP-corrected flow] and RER = ΔCO2%/ΔO2%.
Male NestinCre/PPARγ-P467L mice also underwent metabolic parameters measurements over a 3-day period using the Oxymax Comprehensive Lab Animal Monitoring System (Columbus Instruments). Briefly, mice were acclimatized to the cages for 12 hours before measurements began. The volumes of VO2 and CO2 produced by each mouse were measured through indirect calorimetry. RER was calculated as the ratio of VO2 into CO2 produced. EE was calculated using the Lusk equation: 3.815 + 1.232 × RER. Activity levels were counted as infrared beam breaks along the x-axis of the cage.
Fasting glucose and glucose tolerance test (GTT) and insulin tolerance test (ITT)
Mice were individually housed and fasted overnight (16–18 h). Fasting blood glucose levels were measured via Accu-Chek Aviva Blood Glucose Meter (Roche) using tail blood. GTT and ITT were performed as described (16). Four- to five-month-old mice were fasted overnight (GTT) or for 5 hours (ITT) in a clean cage. Body weight and basal glucose levels were obtained before ip glucose (2.0 g/kg) or insulin (1 U/kg) administration. Blood glucose levels were determined at the following time points: 15, 30, 60, and 120 minutes using a glucometer (Accu-Chek Aviva Glucose Meter; Roche) from tail-blood.
Insulin receptor signaling
Male mice were fasted overnight in a clean cage. On the test morning, the mice were anesthetized with ketamine-xylazine, and the jugular vein was cannulated for either vehicle (PBS) or insulin (5 U/kg) injections. Fifteen minutes after injection, the mice were killed, and the liver, perigenital white adipose tissue (WAT), and soleus muscle were collected. The tissues were then processed for immunoblotting, and the levels of phospho-AKT and total AKT were determined as described above.
Plasma measurements
Blood was extracted from the left ventricle of NestinCre/PPARγ-P467L and control mice at the time of killing (typically at 8 am). Plasma from each blood sample was isolated using 0.5M EDTA and by centrifugation at 7000 rpm for 5 minutes at 4°C. Plasma levels of leptin, insulin, thyroid hormone (free T3), and GH were measured by commercially available ELISA kits (Bio-Rad for leptin, Crystal Chem for insulin, Cusabio for free T3, and Cloudclone for GH).
Statistics
All data are expressed as mean ± SEM. The mean between 2 groups were analyzed by 2-tailed Student's t test. The means of 2 or more groups and 2 genotypes were analyzed by a two-way ANOVA with Bonferroni post hoc tests unless otherwise stated. Analysis of covariance (ANCOVA) was used to analyze the effect of both genotype and body weight on EE and RER. Significance was recorded at P < .05.
Results
We generated a transgene designed to inducibly express either WT or DN PPARγ in a Cre-recombinase-dependent manner (12). To evaluate the role of PPARγ in the nervous system, CAG-PPARγ-WT transgenic mice, designed to inducibly express WT PPARγ (PPARγ-WT) and the tdTomato reporter gene, and CAG-PPARγ-P467L transgenic mice, designed to inducibly express PPARγ-P467L and tdTomato were crossed with mice transgenic for Cre-recombinase under the control of the pan-neuronal Nestin promoter (14). Abundant expression of PPARγ-P467L and PPARγ-WT mRNA was detected in the brain of NestinCre/PPARγ-P467L and NestinCre/PPARγ-WT mice, respectively (Figure 1A). Similarly, there was abundant expression of tdTomato mRNA, the reporter gene integrated into both transgene constructs in the brain of transgenic mice (Figure 1B). NestinCre/PPARγ-P467L mice exhibited increased expression of human PPARγ protein in the hypothalamus, cortex, hippocampus, and brain stem, whereas no human PPARγ was detected in littermates that expressed only Cre-recombinase (Figure 1C). There was no evidence of human PPARγ protein expression in the liver, pancreas, or sc adipose tissue (Figure 1D). Similarly, there was no detectable PPARγ-P467L mRNA expression in perigenital adipose tissue (cycle threshold value, 33.2 ± 0.2 in NestinCre/PPARγ-P467L vs 33.1 ± 0.2 in control) and brown adipose tissue (BAT) (cycle threshold value, 30.3 ± 0.3 in NestinCre/PPARγ-P467L vs 32.3 ± 0.2 in control). Expression of 2 canonical PPARγ target genes, aP2 and CD36, was significantly increased in the brain of NestinCre/PPARγ-WT mice (Figure 1, E and F). Consistent with the transcriptional impairment of PPARγ-P467L, there was no induction of aP2 or CD36 expression in brain from NestinCre/PPARγ-P467L mice. These data confirm the nervous system activation of the transgene.
Figure 1.

Transgene expression in NestinCre/PPARγ-P467L mice. A and B, Expression of PPARγ (A) and tdTomato (B) mRNA in brain of NestinCre/PPARγ-P467L and NestinCre/PPARγ-WT mice expressed as fold induction vs nontransgenic littermate controls as detected by quantitative real-time RT-PCR (Q-PCR). NestinCre/PPARγ-P467L (n = 3), NestinCre/PPARγ-P467L control (n = 3), NestinCre/PPARγ-WT (n = 5), NestinCre/PPARγ-WT control (n = 4); *, P < .01 by ANOVA. C, Western blotting of PPARγ protein expression in brain regions of NestinCre/PPARγ-P467L and Control mice (30-μg protein per lane). Note that only 1.5 μg of protein was loaded in the control lane (labeled C) which is from HEK293 cells overexpressing PPARγ. HY, hypothalamus; CX, cortex; HP, hippocampus; BS, brainstem. D. Western blotting of PPARγ protein expression in peripheral tissues of NestinCre/PPARγ-P467L and Control mice (30-μg protein per lane). L, liver; P, pancreas; A, sc adipose tissue. E and F, Expression of aP2 (E) and CD36 (F) mRNA in brain of NestinCre/PPARγ-P467L and NestinCre/PPARγ-WT mice expressed as fold induction vs nontransgenic littermate controls as detected by Q-PCR. NestinCre/PPARγ-P467L (n = 3), NestinCre/PPARγ-P467L control (n = 3), NestinCre/PPARγ-WT (n = 5), and NestinCre/PPARγ-WT control (n = 4); *, P < .02, **, P < .01 by ANOVA. Q-PCR was TaqMan assays normalized to GAPDH. Data are mean ± SEM.
At birth, NestinCre/PPARγ-WT mice are indistinguishable from the rest of the litter. However, between P7 and P10, they weigh 1.0–1.5 g less than their littermate control mice. By P21, the NestinCre/PPARγ-WT mice are severely growth restricted (body weight, 4.5 ± 0.12 vs 8.4 ± 0.2 g in controls; P < .0001) and generally struggle to survive. This accounts for the lower numbers of NestinCre/PPARγ-WT mice genotyped after weaning (15 of 108 weanlings, 13%). NestinCre/PPARγ-WT mice exhibit severe microcephaly and abnormal brain structural development. Histological analysis of their brains reveals significant distortion of the brain architecture (Figure 2). The striatum and the hippocampi are severely hypoplastic and are replaced by prominent ventricular spaces with accentuated posterior horns. Thinning of the cortical layers accentuates the ventricular enlargement. Agenesis of corpus callosum is present uniformly in all samples examined by histology with cingulate cortex also absent (n = 10). The presence of white matter was confirmed with OsO4 staining suggest the absence of a myelination defect (data not shown). The striatal and hippocampal hypoplasia seem to vary in severity, such that 2 distinct phenotypes can be distinguished. Of the sections examined from 10 mice, 6 had a severe phenotype with significant hippocampal and striatal hypoplasia and prominent colpocephaly. Four samples had the milder phenotype characterized with development of the striatum and absence of ventricular enlargement. These brain defects are likely to account for the early demise, which precluded us from studying the metabolic phenotype of these mice.
Figure 2.

Brain histology in NestinCre/PPARγ-WT mice. Representative sections from a control brain (A, C, and E) and comparable sections from a NestinCre/PPARγ-WT brain (B, D, and F) showing severe hypoplasia of major brain structures. B, Hypoplasia of the caudate-putamen (cp) and consequent ex vacuo enlargement of the lateral ventricles (lv) can be clearly seen. Note in B and D, agenesis of the corpus callosum (cc). Also in B and D, the abnormal position and hypoplasia of the hippocampus (hc) can be clearly seen. F, Abnormal development of cerebellar white matter can be seen on the left side of the section. On the right side, severe hypoplasia and dysplasia of the cerebellar cortex is clearly evident. Scale bar, 5 mm.
Ablation of neuronal PPARγ leads to resistance to HFD-induced weight gain (8). We therefore hypothesized that overexpression of the DN PPARγ-P467L will recapitulate the phenotype. At 5 weeks of age, male NestinCre/PPARγ-P467L mice weighed less than littermate controls (15.1 ± 0.8 vs 17.6 ± 0.6 g, P = .024). The reduction in body weight of male NestinCre/PPARγ-P467L mice was sustained over time and more evident in mice fed 60% HFD (Figure 3, A and B). At 20 weeks of age (after 15 wk on HFD), male NestinCre/PPARγ-P467L mice exhibited significantly lower body weight compared with their littermate controls (Figure 4A). Interestingly, the reduced body weight in NestinCre/PPARγ-P467L mice was not due to a decrease in fat mass (Figure 4B) or fluid mass (Figure 4C) but to a reduction in lean mass (Figure 4D). Consistent with this, there was a significant decrease in the weight of the liver, heart, kidney, and spleen (Figure 4, E–H). Although there was no difference in total fat mass, there were redistribution of adipose tissue to regional depots, including a decrease in BAT (Figure 4I), and an increase in perigenital fat pad (Figure 4J). There was no change in inguinal sc adipose tissue (Figure 4K). The redistribution of adipose tissue did not result in any change in the circulating levels of leptin (Figure 4L).
Figure 3.

Body weight and weight gain in NestinCre/PPARγ-P467L mice. Body weight (A and C) and change in body weight (B and D) are plotted in male (A and B) and female (C and D) NestinCre/PPARγ-P467L mice in response to 10% isocaloric control diet or 60% HFD for 15 weeks starting at 5 weeks of age. The number of mice per group is indicated. Data in the graphs are expressed as the mean ± SEM; *, P = .0005, interaction of weeks × genotype, two-way ANOVA.
Figure 4.

Body composition in NestinCre/PPARγ-P467L mice. Body weight (A), body composition (B–D), organ weights (E–K), and plasma leptin (L) are shown for male NestinCre/PPARγ-P467L mice fed 60% HFD for 15 weeks starting at 5 weeks of age. The number of mice per group are as indicated in Figure 3. Data in the graphs are expressed as the mean ± SEM; *, P < .0001; **, P = .003; ***, P = .01 by t test.
In contrast to male mice, there was no difference in body weight in female NestinCre/PPARγ-P467L mice compared with controls in response to 60% HFD (Figure 3, C and D). Similarly, there was no difference in body composition in female NestinCre/PPARγ-P467L mice (fat mass: 23.2 ± 2.3 vs 20.0 ± 2.4 g in controls, P = .37; lean mass, 14.8 ± 0.8 vs 15.8 ± 0.6 g in controls, P = .31; fluid mass, 6.1 ± 0.4 vs 5.5 ± 0.4 g in controls, P = .26, n ≥ 7/group).
The decreased lean mass of the male NestinCre/PPARγ-P467L mice was not due to muscle atrophy. Accordingly, there was no change in the level of mRNA expression of molecular markers of muscle atrophy such as Gadd45, Fbxo32, Cdkn1a, and Smox (data not shown). Moreover, histological examination of tibialis anterior muscle revealed no difference between genotypes in muscle fiber morphology (data not shown).
Analysis of 24-hour food intake, averaged over 5 days, showed no difference between male NestinCre/PPARγ-P467L and littermate control mice (Figure 5A). Heat production trended to be lower in the NestinCre/PPARγ-P467L males, but there was no statistical difference in EE when analyzed with ANCOVA (Figure 5B). There was also no difference in EE when heat production was normalized by lean body mass (Figure 5C). Neuronal ablation of PPARγ has been shown to increase EE through up-regulation of thermogenic genes such as uncoupling protein 1 (UCP1) in BAT (8). NestinCre/PPARγ-P467L male mice exhibited similar levels of expression of UCP1 mRNA in BAT as control mice (Figure 5D). This is consistent with similar levels of EE between the genotypes. Interestingly, there was a trend toward decreased activity in male NestinCre/PPARγ-P467L compared with controls but this did not reach significance (beam breaks: light phase, 68 ± 18 in NestinCre/PPARγ-P467L; n = 5 vs 100 ± 24 in controls; n = 6, P = .33; and dark phase, 130 ± 14 vs 257 ± 57 in controls; P = .13).
Figure 5.

Energy intake and output in NestinCre/PPARγ-P467L mice. Food intake (n = 8 for control, n = 6 for NestinCre/PPARγ-P467L) (A), heat production analyzed by ANCOVA (n = 17 for control, n = 10 for NestinCre/PPARγ-P467L) (B), heat production normalized by lean body mass (n = 17 for control, n = 10 for NestinCre/PPARγ-P467L) (C), and UCP1 mRNA measured by quantitative real-time RT-PCR (Q-PCR) (n = 6 per group) (D) is shown. Data in the graphs are expressed as the mean ± SEM.
We next measured several metabolic hormones. There was no difference in the level of free thyroid hormone (T3) in NestinCre/PPARγ-P467L mice compared with control littermates (Figure 6A). Interestingly, plasma GH level trended to be elevated in NestinCre/PPARγ-P467L mice, but this failed to reach significance (Figure 6B). Nevertheless, the trend toward an elevation suggests the mice may have GH resistance. Consistent with this, there was a significant decrease in plasma levels of IGF-1 (Figure 6C).
Figure 6.
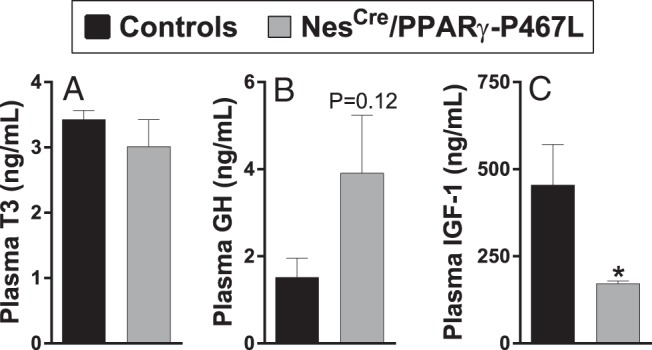
Endocrine measures in NestinCre/PPARγ-P467L mice. Plasma T3 (n = 6) (A), GH (n = 5) (B), and IGF-1 (n = 7) (C). Data in the graphs are expressed as the mean ± SEM; *, P = .03.
Brain PPARγ has been shown to play a critical role in hepatic insulin sensitivity, and reduced IGF-1 may have implications for glucose homeostasis (8, 17). We therefore measured the levels of fasting glucose in NestinCre/PPARγ-P467L mice after 15 weeks of HFD. NestinCre/PPARγ-P467L mice exhibited significantly lower fasting glucose levels compared with controls (Figure 7A). NestinCre/PPARγ-P467L mice were markedly hypoinsulinemic compared with controls in both the fed and fasting states (Figure 7B). This is unlikely due to expression of the transgene in insulin producing β-cells, because there was no evidence for human PPARγ or tdTomato expression in pancreas at the mRNA (Figure 7C) or protein levels (Figure 2D). We next performed GTT and ITT to better understand whether there was altered insulin sensitivity in these mice. We first measured glucose tolerance and insulin sensitivity in 10% fat control diet-fed male NestinCre/PPARγ-P467L mice. Control diet-fed male NestinCre/PPARγ-P467L mice were glucose intolerant (Figure 7D). Interestingly, the experiment assessing insulin sensitivity of control diet-fed NestinCre/PPARγ-P467L mice had to be terminated as the mice became distressed from hypoglycemia. 60% HFD-fed NestinCre/PPARγ-P467L male mice were glucose intolerant compared with their littermate controls at 60 minutes after infusion but ultimately cleared glucose by 120 minutes (Figure 7E). HFD-fed NestinCre/PPARγ-P467L male mice demonstrated significantly enhanced response to exogenous insulin compared with controls (Figure 7F). Consistent with this, insulin receptor signaling was augmented in the WAT, liver, and muscle of NestinCre/PPARγ-P467L mice fed HFD (Figure 8).
Figure 7.

Glucose homeostasis in NestinCre/PPARγ-P467L mice. Fasting plasma glucose (*, P < .002; n = 11 control; n = 8 NestinCre/PPARγ-P467L) (A), fasting and fed plasma insulin (*, P < .0001; **, P < .05, n = 6–7 per group) (B), and pancreatic expression of human PPARγ and tdTomato mRNA (n = 3 per group) (C) in NestinCre/PPARγ-P467L and control mice. Intraperitoneal GTT in mice fed 10% fat control (D) and 60% HFD (E) is shown; *, P < .05 vs control mice; n = 5 per group. Intraperitoneal ITT in mice fed HFD (F) is shown; **, P = .0001; n = 6 per group. Data in the graphs are expressed as the mean ± SEM.
Figure 8.

Insulin signaling in NestinCre/PPARγ-P467L mice. A, Representative Western blotting measuring phosphorylated AKT and total AKT in perigenital WAT, liver, and muscle is shown in response to a single injection of insulin (5 U/kg iv) or saline as vehicle. Tissues were collected 15 minutes after injection. B, Quantification of Western blottings (n = 4 samples per group). *, P < .05 insulin vs vehicle; **, P < .05 insulin-treated NestinCre/PPARγ-P467L vs insulin-treated and control mice.
Discussion
A role for neuronal PPARγ in the regulation of energy homeostasis has recently been suggested. Whole-brain ablation of PPARγ results in protection against diet-induced obesity through mechanisms involving increased EE and decreased energy intake (8). POMC neuron-specific deletion of PPARγ recapitulates the whole-brain phenotype in inducing resistance to HFD and elucidates additional mechanisms underlying these protective effects, ie, increase in the levels of reactive oxygen species, which are required for the proper functioning of the anorexigenic POMC neurons (11). Expression of DN mutation of PPARγ specifically in POMC neurons has subtle effects under some dietary conditions (12).
Null mutations in PPARγ lead to embryonic lethality due to impaired placental development (18). In contrast, even though rare, DN mutations in PPARγ have been reported to cause severe metabolic disturbances and early onset hypertension in humans (17, 19). One such mutation (P467L) occurs in the ligand-binding domain of PPARγ and has been shown to interfere with the WT form of the receptor by competing for target gene promoter binding sites and to be transcriptionally defective (17, 20). We previously demonstrated the utility of using the PPARγ-P467L mutant as a potent repressor of experimentally validated PPARγ target genes, which otherwise show increased expression levels in response to PPARγ agonists (21, 22). We show here that just as in the blood vessel, the DN PPARγ-P467L mutation is defective in mediating transactivation of PPARγ target genes in the brain. These same PPARγ targets are induced when PPARγ-WT is expressed in neurons. Administration of rosiglitazone induces weight gain when PPARγ-WT is expressed selectively in POMC neurons (12).
Deletion of PPARγ in brain has been reported to result in significantly lower body weight compared with control mice at a young age and when fed regular chow diet (8). We observed the same in the NestinCre/PPARγ-P467L at baseline, before treatment with HFD, and also during feeding with low-fat isocaloric control diet. The differences in body mass reported in the brain PPARγ knockouts disappear by 13 weeks (8), whereas in our model, it persisted through adulthood. The divergence in body weight was most pronounced under conditions of HFD feeding but was evident even with low-fat diet, suggesting growth impairment. Consistent with this, the weight of several organs was decreased in NestinCre/PPARγ-P467L mice. Moreover, there was no difference in EE or energy intake. It is unlikely that the reduced growth in these mice is due to pituitary impairment, which was reported in some Nestin-CRE driver mice (23), because our model did not have reduced GH but rather a trend for increased GH. Instead of a state of GH deficiency, the marked decrease in IGF-1 is an indicator of GH resistance (24). Another contributor to poor growth in these mice may be related to low insulin levels. Abnormalities in the growth of children with insulin deficiency due to type1 diabetes has been recognized for many decades (25). Moreover, the role of insulin as a growth factor has been well established (26), because impaired growth is a significant complication of uncontrolled diabetes (27, 28). Infusion of insulin in the streptozotocin model of type 1 diabetes in rats, particularly when administered in the hepatic circulation, can stimulate (or reverse) growth restriction (29). Alternatively, the poor growth in these mice may be related to GH resistance. For example, Laron syndrome in humans is an abnormality of growth caused by resistance to GH (30). Hypoglycemia, low IGF-1 and elevated GH levels are hallmarks of the syndrome. The NestinCre/PPARγ-P467L mice phenocopy at least some aspects of Laron syndrome and phenocopy models of Laron syndrome in mice and pigs (31, 32).
Neuronal ablation of PPARγ leads to impaired glucose tolerance and reduced insulin sensitivity (8). Like those mice, NestinCre/PPARγ-P467L mice exhibited impaired glucose tolerance under control and HFD-fed states. However, unexpectedly, fasting glucose was significantly lower in the NestinCre/PPARγ-P467L after 15 weeks of HFD than in controls. Furthermore, NestinCre/PPARγ-P467L mice exhibited a marked sensitivity to exogenous insulin in an ITT, and a marked increase in insulin receptor signaling in adipose, liver, and muscle. This enhanced insulin sensitivity may explain the low circulating glucose and hypoinsulinemia. It should be noted, however, that our model stands in contrast with the insulin resistance phenotype of humans carrying DN PPARγ mutations. These patients are characterized by severe fasting hyperinsulinemia and hyperglycemia consistent with severe insulin resistance (17, 19). Of course, the mutations in humans affect every tissue in the body, whereas in our model, the interference with PPARγ is neuron specific.
The hypothalamus regulates energy and glucose balance by maintaining reciprocal neural communications with the preganglionic motor neurons of the autonomic nervous system (33). It has been recently shown that abnormal insulin signaling in POMC neurons, in response to HFD exposure, leads to altered POMC projections to the preautonomic paraventricular nucleus of the hypothalamus and thus impaired pancreatic parasympathetic innervation, demonstrated by decreased glucose-stimulated insulin secretion (34). Activation of PPARγ in POMC neurons has been shown to lead to decreased activity pattern of these neurons, which is abolished by treatment with PPARγ antagonist (10). Thus, we cannot formally rule out that the hypoinsulinemia observed in our model is due to impaired parasympathetic output to the pancreas as a result of altered input to parasympathetic preganglionic neurons.
Acknowledgments
We thank Bill Paradee, Norma Sinclair, JoAnne Schwarting, and Patricia Yarolem for genotyping mice, Jamie Soto and Erin Lane in the Metabolic Phenotyping Core Laboratory for CLAMS data, and Dr Chantal Allamargot in the University of Iowa Central Microscopy Research Facility. We also thank Dr Justin Grobe and Nicole Pearson for providing equipment and assistance in measuring EE.
This work was supported by National Institutes of Health Research Grants HL084207, HL062984, and HL125603 (to C.D.S.), HL084207 (to K.R.), and DK096518 and DK097820 (to A.W.N.); American Heart Association Grants 15SFRN23480000 (to C.D.S.) and 14EIA18860041 (to K.R.); and the University of Iowa Fraternal Order of Eagles Diabetes Research Center (K.R. and A.W.N). This work was also received the generous research support of the Roy J. Carver Trust. Transgenic mice were generated at the University of Iowa Gene Editing Facility supported by grants from the National Institutes of Health and from the Carver College of Medicine.
Disclosure Summary: The authors have nothing to disclose.
Appendix
See Table 1.
Table 1.
Antibody Table
| Peptide/ Protein Target | Antigen Sequence (if Known) | Name of Antibody | Manufacturer, Catalog Number, and/or Name of Individual Providing the Antibody | Species Raised in; Monoclonal or Polyclonal | Dilution Used | RRID |
|---|---|---|---|---|---|---|
| PPARG | Synthetic peptide corresponding to residues surrounding Asp69 of human PPARγ | PPARG | Cell Signaling, C26H12 | Rabbit; monoclonal, 2435 | 1:1000 | AB_2166051 |
| Actin | Actin | AbCam, ab8229 | Goat; polyclonal | 1:10 000 | AB_306374 | |
| Phospho-AKT | Synthetic phosphopeptide corresponding to residues surrounding Ser473 of mouse akt | P-AKT | Cell Signaling, 9271 | Rabbit; polyclonal | 1:2000 | AB_329825 |
| Total-AKT | Synthetic peptide corresponding to the C-terminal sequence of mouse Akt | AKT | Cell Signaling, 9272 | Rabbit; polyclonal | 1:2000 | AB_329827 |
| Antirabbit IgG | Antirabbit IgG | Cell Signaling, 7074V | Goat, antirabbit, IgG | 1:10 000 | AB_11178390 | |
| Antirabbit IgG | Antirabbit IgG | GE Healthcare Life Sciences, NA934 | Donkey; antirabbit, IgG | 1:10 000 | AB_772206 |
Footnotes
- ANCOVA
- analysis of covariance
- BAT
- brown adipose tissue
- CNS
- central nervous system
- DN
- dominant negative
- EE
- energy expenditure
- GAPDH
- glyceraldehyde 3 phosphate dehydrogenase
- GTT
- glucose tolerance test
- HFD
- high-fat diet
- ITT
- insulin tolerance test
- P
- days of age
- PPAR
- peroxisome proliferator activated receptor
- POMC
- proopiomelanocortin
- RER
- respiratory exchange ratio
- TBS-T
- Tris-buffered saline with 0.1% Tween 20
- TZD
- thiazolidinedione
- UCP1
- uncoupling protein 1
- VO2
- O2 consumed
- WAT
- white adipose tissue
- WT
- wild type.
References
- 1. Dormandy JA, Charbonnel B, Eckland DJ, et al. Secondary prevention of macrovascular events in patients with type 2 diabetes in the PROactive Study (PROspective pioglitAzone Clinical Trial In macroVascular Events): a randomised controlled trial. Lancet. 2005;366:1279–1289. [DOI] [PubMed] [Google Scholar]
- 2. Schneider CA, Ferrannini E, Defronzo R, Schernthaner G, Yates J, Erdmann E. Effect of pioglitazone on cardiovascular outcome in diabetes and chronic kidney disease. J Am Soc Nephrol. 2008;19:182–187. [DOI] [PMC free article] [PubMed] [Google Scholar]
- 3. DeFronzo RA, Tripathy D, Schwenke DC, et al. Pioglitazone for diabetes prevention in impaired glucose tolerance. N Engl J Med. 2011;364:1104–1115. [DOI] [PubMed] [Google Scholar]
- 4. DREAM Trial Investigators, Dagenais GR, Gerstein HC, et al. Effects of ramipril and rosiglitazone on cardiovascular and renal outcomes in people with impaired glucose tolerance or impaired fasting glucose: results of the Diabetes REduction Assessment with ramipril and rosiglitazone Medication (DREAM) trial. Diabetes Care. 2008;31:1007–1014. [DOI] [PubMed] [Google Scholar]
- 5. Schöndorf T, Forst T, Hohberg C, et al. The IRIS III study: pioglitazone improves metabolic control and blood pressure in patients with type 2 diabetes without increasing body weight. Diabetes Obes Metab. 2007;9:132–133. [DOI] [PubMed] [Google Scholar]
- 6. Home PD, Pocock SJ, Beck-Nielsen H, et al. Rosiglitazone evaluated for cardiovascular outcomes in oral agent combination therapy for type 2 diabetes (RECORD): a multicentre, randomised, open-label trial. Lancet. 2009;373:2125–2135. [DOI] [PubMed] [Google Scholar]
- 7. Sarruf DA, Yu F, Nguyen HT, et al. Expression of peroxisome proliferator-activated receptor-γ in key neuronal subsets regulating glucose metabolism and energy homeostasis. Endocrinology. 2009;150:707–712. [DOI] [PMC free article] [PubMed] [Google Scholar]
- 8. Lu M, Sarruf DA, Talukdar S, et al. Brain PPAR-γ promotes obesity and is required for the insulin-sensitizing effect of thiazolidinediones. Nat Med. 2011;17:618–622. [DOI] [PMC free article] [PubMed] [Google Scholar]
- 9. Ryan KK, Li B, Grayson BE, Matter EK, Woods SC, Seeley RJ. A role for central nervous system PPAR-γ in the regulation of energy balance. Nat Med. 2011;17:623–626. [DOI] [PMC free article] [PubMed] [Google Scholar]
- 10. Diano S, Liu ZW, Jeong JK, et al. Peroxisome proliferation-associated control of reactive oxygen species sets melanocortin tone and feeding in diet-induced obesity. Nat Med. 2011;17:1121–1127. [DOI] [PMC free article] [PubMed] [Google Scholar]
- 11. Long L, Toda C, Jeong JK, Horvath TL, Diano S. PPARγ ablation sensitizes proopiomelanocortin neurons to leptin during high-fat feeding. J Clin Invest. 2014;124:4017–4027. [DOI] [PMC free article] [PubMed] [Google Scholar]
- 12. Stump M, Guo DF, Lu KT, et al. Effect of selective expression of dominant negative PPARγ in proopiomelanocortin neurons on the control of energy balance. Physiol Genomics. 2016;48:491–501. [DOI] [PMC free article] [PubMed] [Google Scholar]
- 13. Ketsawatsomkron P, Keen HL, Davis DR, et al. Protective role for tissue inhibitor of metalloproteinase-4, a novel peroxisome proliferator-activated receptor-γ target gene, in smooth muscle in deoxycorticosterone acetate-salt hypertension. Hypertension. 2016;67:214–222. [DOI] [PMC free article] [PubMed] [Google Scholar]
- 14. Tronche F, Kellendonk C, Kretz O, et al. Disruption of the glucocorticoid receptor gene in the nervous system results in reduced anxiety. Nat Genet. 1999;23:99–103. [DOI] [PubMed] [Google Scholar]
- 15. Burnett CM, Grobe JL. Direct calorimetry identifies deficiencies in respirometry for the determination of resting metabolic rate in C57Bl/6 and FVB mice. Am J Physiol Endocrinol Metab. 2013;305:E916–E924. [DOI] [PMC free article] [PubMed] [Google Scholar]
- 16. Morgan DA, Rahmouni K. Differential effects of insulin on sympathetic nerve activity in agouti obese mice. J Hypertens. 2010;28:1913–1919. [DOI] [PMC free article] [PubMed] [Google Scholar]
- 17. Barroso I, Gurnell M, Crowley VE, et al. Dominant negative mutations in human PPARγ associated with severe insulin resistance, diabetes mellitus and hypertension. Nature. 1999;402:880–883. [DOI] [PubMed] [Google Scholar]
- 18. Barak Y, Nelson MC, Ong ES, et al. PPAR γ is required for placental, cardiac, and adipose tissue development. Mol Cell. 1999;4:585–595. [DOI] [PubMed] [Google Scholar]
- 19. Savage DB, Tan GD, Acerini CL, et al. Human metabolic syndrome resulting from dominant-negative mutations in the nuclear receptor peroxisome proliferator-activated receptor-γ. Diabetes. 2003;52:910–917. [DOI] [PubMed] [Google Scholar]
- 20. Li G, Leff T. Altered promoter recycling rates contribute to dominant-negative activity of human peroxisome proliferator-activated receptor-γ mutations associated with diabetes. Mol Endocrinol. 2007;21:857–864. [DOI] [PubMed] [Google Scholar]
- 21. Keen HL, Halabi CM, Beyer AM, et al. Bioinformatic analysis of gene sets regulated by ligand-activated and dominant-negative peroxisome proliferator-activated receptor γ in mouse aorta. Arterioscler Thromb Vasc Biol. 2010;30:518–525. [DOI] [PMC free article] [PubMed] [Google Scholar]
- 22. Keen HL, Ryan MJ, Beyer A, et al. Gene expression profiling of potential PPARγ target genes in mouse aorta. Physiol Genomics. 2004;18:33–42. [DOI] [PubMed] [Google Scholar]
- 23. Galichet C, Lovell-Badge R, Rizzoti K. Nestin-Cre mice are affected by hypopituitarism, which is not due to significant activity of the transgene in the pituitary gland. PLoS One. 2010;5:e11443. [DOI] [PMC free article] [PubMed] [Google Scholar]
- 24. Buckway CK, Guevara-Aguirre J, Pratt KL, Burren CP, Rosenfeld RG. The IGF-I generation test revisited: a marker of GH sensitivity. J Clin Endocrinol Metab. 2001;86:5176–5183. [DOI] [PubMed] [Google Scholar]
- 25. Jackson RL, Kelly HG. Growth of children with diabetes mellitus in relationship to level of control of the disease. J Pediatr. 1946;29:316–328. [DOI] [PubMed] [Google Scholar]
- 26. Hill DJ, Milner RD. Insulin as a growth factor. Pediatr Res. 1985;19:879–886. [DOI] [PubMed] [Google Scholar]
- 27. Hoskins PJ, Leslie RD, Pyke DA. Height at diagnosis of diabetes in children: a study in identical twins. Br Med J (Clin Res Ed). 1985;290:278–280. [DOI] [PMC free article] [PubMed] [Google Scholar]
- 28. Rudolf MC, Sherwin RS, Markowitz R, et al. Effect of intensive insulin treatment on linear growth in the young diabetic patient. J Pediatr. 1982;101:333–339. [DOI] [PubMed] [Google Scholar]
- 29. Winter RJ, Phillips LS, Green OC, Traisman HS. Somatomedin activity in the Mauriac syndrome. J Pediatr. 1980;97:598–600. [DOI] [PubMed] [Google Scholar]
- 30. Guevara-Aguirre J, Rosenbloom AL, Vaccarello MA, et al. Growth hormone receptor deficiency (Laron syndrome): clinical and genetic characteristics. Acta Paediatr Scand Suppl. 1991;377:96–103. [DOI] [PubMed] [Google Scholar]
- 31. Cui D, Li F, Li Q, et al. Generation of a miniature pig disease model for human Laron syndrome. Sci Rep. 2015;5:15603. [DOI] [PMC free article] [PubMed] [Google Scholar]
- 32. Zhou Y, Xu BC, Maheshwari HG, et al. A mammalian model for Laron syndrome produced by targeted disruption of the mouse growth hormone receptor/binding protein gene (the Laron mouse). Proc Natl Acad Sci USA. 1997;94:13215–13220. [DOI] [PMC free article] [PubMed] [Google Scholar]
- 33. Marino JS, Xu Y, Hill JW. Central insulin and leptin-mediated autonomic control of glucose homeostasis. Trends Endocrinol Metab. 2011;22:275–285. [DOI] [PMC free article] [PubMed] [Google Scholar]
- 34. Vogt MC, Paeger L, Hess S, et al. Neonatal insulin action impairs hypothalamic neurocircuit formation in response to maternal high-fat feeding. Cell. 2014;156:495–509. [DOI] [PMC free article] [PubMed] [Google Scholar]