ABSTRACT
Spores of an acrystalliferous derivative of Bacillus thuringiensis subsp. kurstaki, termed Btcry−, are morphologically, aerodynamically, and structurally indistinguishable from Bacillus anthracis spores. Btcry− spores were dispersed in a large, open-ended barn together with spores of Bacillus atrophaeus subsp. globigii, a historically used surrogate for Bacillus anthracis. Spore suspensions (2 × 10¹² CFU each of B. atrophaeus subsp. globigii and Btcry−) were aerosolized in each of five spray events using a backpack misting device incorporating an air blower; a wind of 4.9 to 7.6 m s−1 was also flowing through the barn in the same direction. Filter air samplers were situated throughout the barn to assess the aerosol density of the spores during each release. Trays filled with a surfactant in aqueous buffer were placed on the floor near the filter samplers to assess spore deposition. Spores were also recovered from arrays of solid surfaces (concrete, aluminum, and plywood) that had been laid on the floor and set up as a wall at the end of the barn. B. atrophaeus subsp. globigii spores were found to remain airborne for significantly longer periods, and to be deposited on horizontal surfaces at lower densities, than Btcry− spores, particularly near the spray source. There was a 6-fold-higher deposition of Btcry− spores than of B. atrophaeus subsp. globigii spores on vertical surfaces relative to the surrounding airborne density. This work is relevant for selecting the best B. anthracis surrogate for the prediction of human exposure, hazard assessment, and hazard management following a malicious release of B. anthracis.
IMPORTANCE There is concern that pathogenic bacteria could be maliciously disseminated in the air to cause human infection and disruption of normal life. The threat from spore-forming organisms, such as the causative agent of anthrax, is particularly serious. In order to assess the extent of this risk, it is important to have a surrogate organism that can be used to replicate the dispersal characteristics of the threat agent accurately. This work compares the aerosol dispersal and deposition behaviors of the surrogates Btcry− and B. atrophaeus subsp. globigii. Btcry− spores remained in the air for a shorter time, and were markedly more likely to adhere to vertical surfaces, than B. atrophaeus subsp. globigii spores.
INTRODUCTION
Bacillus anthracis is an important bacterial agent of concern (1). It is pathogenic to humans, particularly by inhalational exposure (2). The organism's endospores manifest greater environmental persistence and higher resistance to chemical decontaminants than those of other bacteria. Understanding of the threat posed by malicious use of B. anthracis and the development of effective countermeasures require a comparable, nonpathogenic surrogate. Bacillus atrophaeus subsp. globigii has, for many decades, been a B. anthracis surrogate (3). B. atrophaeus subsp. globigii and other surrogates related to Bacillus subtilis have generated useful information regarding spore dispersal (4, 5). However, an increasingly large body of data indicates that B. atrophaeus subsp. globigii is not a very accurate surrogate for B. anthracis (6–8), particularly in terms of spore morphology. B. atrophaeus subsp. globigii spores are considerably smaller and lack an exosporium (9). Furthermore, genetic similarities among B. anthracis, Bacillus thuringiensis, and Bacillus cereus strongly favor B. thuringiensis as a replacement for B. atrophaeus subsp. globigii (6–8).
Certain strains of B. thuringiensis have been used for decades as biological pesticides (10), due to the production of characteristic proteinaceous crystals, encoded by the cry genes (11). B. anthracis lacks the parasporal crystals, which, when present during decontamination studies, may have a chemical quenching effect, decreasing sporicidal activity. These crystals would also conceivably affect the aerosol behavior of the spores in a way that is not characteristic of B. anthracis. A plasmid-cured derivative of B. thuringiensis subsp. kurstaki strain HD-1, lacking cry genes and termed Btcry−, was developed (12) in order to eliminate these potential drawbacks. This derivative does not produce any parasporal crystals.
A significant advantage of developing a spore surrogate from B. thuringiensis HD-1 (13) is the unequalled wealth of safety data that have been generated from its use. Thousands of tonnes of B. thuringiensis have been dispersed annually as aerosols from aircraft, backpack sprayers, and other devices (14) in >40 years of use as a biopesticide. B. thuringiensis HD-1 has never been associated with detrimental human (15, 16) or environmental (17) effects from such use despite being the most widely applied biotechnological microorganism ever. Indeed, in order to be registered as a commercial product, B. thuringiensis HD-1 has had to pass scrutiny from numerous regulatory bodies (14). With particular reference to its use as an aerosolized spore surrogate, the human toxicity of the wild-type HD-1 strain has been carefully monitored following aerosol dispersals over populated areas to control forest pests (18). Even with medical monitoring and warning of the population at risk, no adverse effects have been reported (16).
In spite of the immense exploitation of B. thuringiensis as a biopesticide, few evaluations of its dispersal and persistence following aerosol application have been reported (19–22). More recently, evaluations of this organism specifically as a spore surrogate (23–25) and also as released in dry (26) and wet (27) aerosols have been reported. Btcry−, the acrystalliferous derivative of B. thuringiensis HD-1 (12), was developed to be a safe, accurate, and publicly acceptable surrogate for B. anthracis spores. The evaluation of its behavior in the aerosol phase and its deposition onto concrete, aluminum, and wood test surfaces is reported here. B. atrophaeus subsp. globigii spores were released at the same time as Btcry− spores in order to compare the two surrogates under identical conditions.
MATERIALS AND METHODS
Spore production.
B. thuringiensis subsp. kurstaki HD-1 lacking cry genes (Btcry−) (12) and B. atrophaeus subsp. globigii NCTC 10073 were grown on NBYS (28) agar plates at 28°C. The plates were left for 1 week in order to maximize the degradation of the spore mother cells. The spores were scraped off the plates and were washed six times (at 6,000 × g for 30 min) in sterile distilled water. The resulting preparations of both species contained at least 99% spores as judged by microscopic examination and heat shock enumeration (25). The spores were maintained at 4°C and were used within 3 weeks of their production.
Estimation of spore recovery.
A correction factor was calculated to anticipate differences in the efficiencies of recovery of spores from the different hard surfaces on which they landed. This correction factor was then applied to the recovered-spore counts from the releases in the barn. By accounting for the different recovery efficiencies, a more accurate estimation of the differences between the spores and the surface types for just the deposition and attachment events was possible. An aqueous suspension (5 ml) of Btcry− and B. atrophaeus subsp. globigii, each at a concentration of 4.5 × 10⁸ CFU ml−1, was applied through a nebulizer kit (part no. NE-C28-E; Omron, United Kingdom) at a flow rate of about 0.27 ml min−1 over 15 min. The resultant spore aerosol was fed into a deposition canopy (29), consisting of a chamber into which an aerosol of spores from a nebulizer was pumped and was allowed to dry before being allowed to deposit under gravity. Eighteen replicates of plywood, plywood wrapped in heavy-duty aluminum foil (Lockhart, United Kingdom), and concrete coupons cut from paving blocks (Wickes Building Supplies, United Kingdom) were used to represent wood, metal, and concrete surfaces, respectively. Each of the coupons had a surface area of about 18 cm2. They were placed randomly under the funnel canopy where the aerosol of spores was deposited. Six small (diameter, 3 cm) dishes containing phosphate-buffered saline (PBS) plus 0.05% Tween 20 (PBST) were randomly distributed among the coupons; the spore count from the recovered liquid was regarded as a true reflection of the deposited spore density per unit area. Previous work had demonstrated that an even distribution of spores occurred within the deposition canopy (at a 95% level of confidence by analysis of variance [ANOVA]) (data not shown). After the coupons had been left in the canopy overnight to allow complete deposition, the spores were extracted as described below. This experiment was carried out twice.
Deposition surfaces.
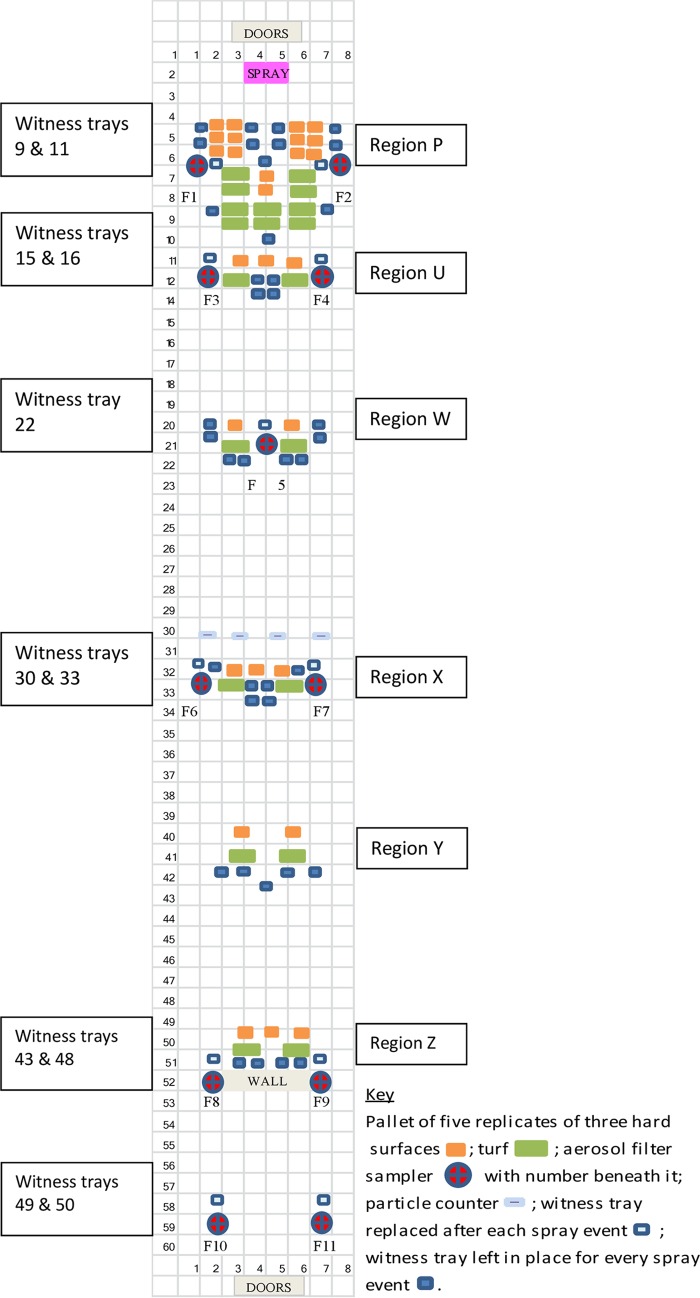
The rigid base for all three of the hard surfaces used in the barn was concrete paving blocks (length, 200 mm; width, 100 mm; depth, 50 mm) (Wickes Building Supplies, United Kingdom). These blocks were wrapped in heavy-duty aluminum foil (Lockhart, United Kingdom) to produce a metal surface. Thin (5-mm-thick) plywood pieces were cut to cover the upper faces of the blocks so as to provide a wooden surface and were glued to the concrete bricks. The bare bricks provided the concrete surface. Five replicates of the three surface types were laid according to a random-number formula on wooden pallets (600 mm by 600 mm). Plastic-backed paper was wrapped around each set of solid coupons before spraying. Its purpose was to prevent the deposition of spores on the outside edges of each set, particularly at the front, which would have skewed the results. Horticultural turf was purchased from a garden center (Acres Supply Garden Centre, Corsley, United Kingdom) and was laid on plastic sheeting on the floor of the barn. “Witness” trays (aluminum catering trays [228 mm by 228 mm; 50 mm deep]) (Star Catering Supplies, United Kingdom) were positioned as shown in Fig. 1. The bottom of each tray was covered with PBST (250 ml). The PBST in the trays adjacent to the filter samplers was replaced after each of the five spray events; other trays situated throughout the barn were kept in place to give a cumulative estimation of spore deposition.
FIG 1.
Diagram of the barn layout. The numbers along the left and bottom of the diagram refer to distance in meters. The relative proportions of the barn structure are drawn to scale.
Surface layout and experimental design.
The dimensions of the barn were as follows: length, 60 m; width, 8 m; height, 10 m at the apex of the roof. The barn lies on a southwest-to-northeast axis on the Defence Science and Technology Laboratory (DSTL) test range (Porton Down, Salisbury, United Kingdom). The pallets of horizontal surfaces were arrayed as shown in Fig. 1. Spores were extracted from a minimum of 10 replicates of each surface type to produce the deposition level in each region (Fig. 1). A wall of solid coupons, consisting of 108 vertically orientated coupons identical to those laid horizontally, was constructed between filters F8 and F9 (Fig. 1). The coupons in the wall were placed in six sets of 18, using a random-number allocation, facing the spray source, which was 50 m away. The wall of coupons was raised 1 m above the ground on light concrete blocks in order to decrease the eddying effects that would be experienced at ground level as the horizontal airflow encountered the vertical surface. Similarly, a “guard row” of concrete bricks, which were subsequently discarded, was placed at each end of the wall and along the top. It was anticipated that as the airflow swept around the sides and the top of the wall, the spore deposition might be abnormal. In addition, deposition on the edges of the bricks would occur, which would not be so for the internal bricks.
Spore dissemination.
A mist-blowing backpack sprayer (model AU8000; Cifarelli, Italy) was used, producing droplet sizes (volume median diameter) of 50 to 100 μm. This backpack sprayer produces an air volume output of 20 m3 per min with a velocity of 125 m s−1 at the outlet. The spores were applied in five events, each releasing 2 × 10¹² spores of each species. Equal concentrations of the two species were used at a density of 1 × 10⁹ CFU ml−1 (i.e., 4 liters of the spore suspension were used per spray event) at a flow rate of 0.4 liter min−1. Each droplet should have contained <4 spores.
The nozzle of the sprayer was moved in a slow ellipse to encompass the solid coupons at the front of the array at an angle of about 5° above and below the horizontal, at a height of 1.2 m. The spore suspension was agitated throughout the spraying process. The temperature during the spray events ranged from 21.5°C to 23°C, and the relative humidity was 38%. The wind speed was 4.9 to 7.6 m s−1, from a southwesterly direction. The barn doors distal to the spray source were left wide open, while the doors behind the sprayer were about 1 m ajar. This created a flow of wind to move the spore aerosols through the barn.
Four particle counters (model 212; Met One Instruments, Grants Pass, OR) were used to ascertain when the previous release of spores had passed through the barn before the next application; there were approximately 20 min between each application. After each spray event, the filters in all 11 aerosol samplers (F1 to F11 [Fig. 1]) were removed and fresh filters inserted. The used filters were stored at room temperature, and the spores were extracted within 2 days. Similarly, the 11 witness trays adjacent to the filter samplers were sampled and were replaced with fresh trays. All the other witness trays and solid surfaces remained in place for all five spray disseminations.
Filter collectors.
The filter collectors were custom made. They have an intake rate of about 900 liters min−1. The filter (diameter, 76 mm) was made of polypropylene (400 g m−2) (part no. YO400ZZB; Andrew Webron Ltd., Bury, United Kingdom).
Spore recovery and enumeration.
The liquid in the witness trays was first mixed with a fresh, sterile pipette to resuspend the spores, and a sample was then transferred to a 50-ml polypropylene tube (Falcon, United Kingdom), which was stored on ice until further processing. Individual filter disks were placed in 50-ml polypropylene tubes, to which 10 ml of eluant (PBST) was added. Spores were eluted by vigorous shaking at maximum speed on a mechanical shaker (Steward, United Kingdom) for 5 min. The resulting suspension of spores was serially diluted in sterile PBS and was plated onto the appropriate growth medium. The solid coupons from the deposition chamber and the barn were placed, face down, in aluminum trays (228 mm by 228 mm) containing PBST (150 ml) and were rubbed backward and forward over the base of the tray for 30 s. A fresh tray was used for each coupon. Samples of the resulting suspensions were stored on ice, and plate counts were performed within 2 days. To estimate the proportion of spores residing on the grass sward relative to those in the whole turf, 16 samples of sod in each region of the barn were cut using a cork borer (diameter, 3 cm). Half of the turf cores from each section were inverted, and the grass was cut off at root level into a 50-ml polypropylene tube with sterile scissors. Each intact turf core was cut roughly into four pieces, which were placed in identical tubes. Spores were removed from the collected grass leaves and the whole turf pieces by shaking for 30 min in an extraction buffer (25). Samples were taken from all of the test materials prior to spraying, but no Btcry− or B. atrophaeus subsp. globigii spores were found on any of them.
The growth media used were ½ TSA (12) for Btcry− and tryptone soy agar (Oxoid, Basingstoke, United Kingdom) for B. atrophaeus subsp. globigii. The samples were not heat shocked before being plated out. The agar plates were incubated overnight at 25°C, and colonies were then enumerated.
Statistical analysis and graphical representation of data.
All data analysis was performed using R software, version 3.1.1 (https://www.r-project.org/). The bacterial count had to be converted to log values to satisfy the normality assumptions; then generalized linear models were run on the data to determine which of the variables had a significant effect on the log bacterial count. Least-squares means were then used to establish where these significant differences were (if there were more than two levels in a variable). Box plots and dot plots were then drawn to highlight these differences. Descriptive statistics were calculated along with 95% and 99% confidence intervals.
A coarse 3-dimensional reconstruction of the barn layout was generated using the open-source rendering and animation package Blender, version 2.63.0 (https://www.blender.org/download), where the spore release was located nearest to the camera. At each witness tray and filter sampler location, two adjacent bars were generated using the Python scripting interface within Blender. The heights of the bars from the floor of the barn represent the measured B. atrophaeus subsp. globigii (red) and Btcry− (green) counts at a particular location (see Fig. 3 and 6), normalized to a value just above the maximum of the data shown, 5 × 10⁹ CFU m−2. The lower limit of the columns was set to a value just below the minimum of the data shown, 5 × 10⁶ CFU m−2. A logarithmic scale was used in order to visualize the full range of data better. The width of the witness tray columns in the representations was set to 0.15 m, although the count from the witness trays was calculated per square meter. The width of the filter sampler columns was set to 0.3 m to represent half the width of the actual equipment. Once all locations had been generated correctly, the image was rendered through a camera with a focal length of 35 mm using environmental lighting, rather than individual lamps, since realistic lighting was not necessary.
FIG 3.
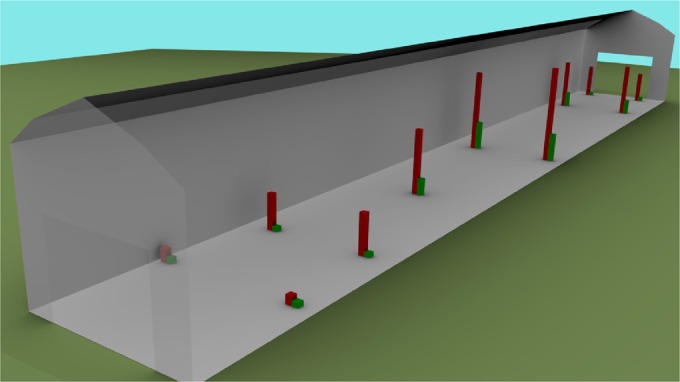
Graphical representation of the recovery of spores of B. atrophaeus subsp. globigii (red bars) and B. thuringiensis lacking cry genes (green bars) from the individual filter samplers. The filters were replaced after each spray event, but the figure represents the mean of the releases overall. There was no significant difference between the spray events. The aerosol source was located at the left end of the barn, as represented here. The relative dimensions of the barn are drawn to scale.
FIG 6.
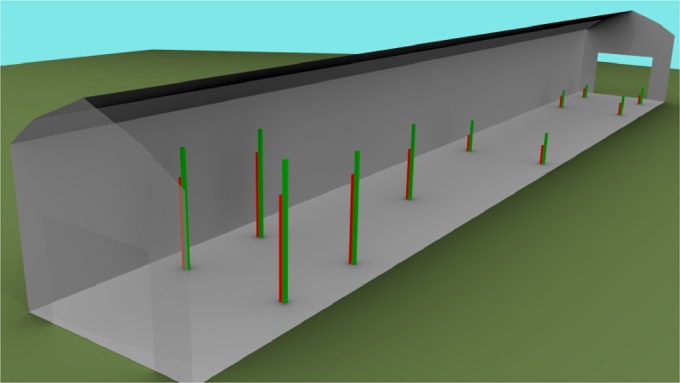
Graphical representation of the recovery of spores of B. atrophaeus subsp. globigii (red bars) and Btcry− (green bars) from the individual witness trays placed adjacent to the filter samplers. These were replaced after each spray, but the figure represents the overall mean of the releases. The height of each bar from the floor of the barn represents the count measured for that species at that location. The widths of the witness tray columns in the diagram are equivalent to 0.15 m, although the bacterial counts were calculated per square meter. The dimensions of the barn are drawn to scale. The spray source was located at the left end of the barn, as represented here.
RESULTS
Evaluation of recovery of spores from surfaces.
The rates of recovery of spores of the two species from the three different types of surfaces used are shown in Table 1. The spore counts from the PBST in the small dishes placed under the deposition canopy with the coupons were regarded as providing a complete count of the spores deposited per unit area (i.e., complete spore recovery). The percentages of recovery in Table 1 were calculated from this standard. There was no significant difference at the 95% confidence level in recovery between the two bacterial species. These recovery rates were used to normalize the spore counts obtained in the barn from these surfaces; they allowed the two different phenomena contributing to the recovered-spore count (deposition efficiency and recovery efficiency) to be separated.
TABLE 1.
Mean percentages of recovery of Btcry− and B. atrophaeus subsp. globigii spores from wood, concrete, and aluminum couponsa
| Surface type | % spore recovery (SD) |
|
|---|---|---|
| Btcry− | B. atrophaeus subsp. globigii | |
| Wood | 8.25 (0.341) | 9.3 (0.501) |
| Concrete | 4.23 (0.309) | 3.75 (0.406) |
| Aluminum | 23.7 (2.85) | 23.9 (1.42) |
The spores were recovered after aerosol deposition in a nebulization chamber. The counts refer to the percentage of recovery per unit area compared to recovery from PBST.
The mean recovery of Btcry− spores from turf over all of the regions represented 123.7% (±20.9%) of the viable count (in CFU per square meter) recovered from the witness trays in the same regions. No attempt was made to calculate the recovery efficiency from turf as was done for the solid surfaces using the deposition chamber. This was because the spores were falling under the effect of gravity in the deposition chamber rather than being blown over the grass, as occurred in the barn; given the 3-dimensional structure of turf, it was considered that there might be too large a discrepancy between these methods of deposition to extrapolate from purely vertical deposition to a somewhat perpendicular deposition at velocity. Turf samples were taken from each of the regions (Fig. 1). The recovery of Btcry− spores from the grass sward that had been cut from the turf represented 43.7% (±31.2%) of the total turf count. No attempt was made to account for the relative ease of recovering spores from grass leaves as opposed to the leaves plus the soil matrix. No comparable measurements were made for B. atrophaeus subsp. globigii spores.
Recovery of spores from filter samplers.
Previous experiments had shown that spores of B. atrophaeus subsp. globigii and Btcry− were collected by and extracted from the filter material with equal efficiency (data not shown). There was no significant difference between the five spray events in the number of spores of either species recovered at any of the 11 filter sites. For all releases and all filters, Btcry− gave a significantly lower spore count (mean, 4.03 × 10⁷ CFU; standard deviation [SD], 3.50 × 10⁷ CFU) than B. atrophaeus subsp. globigii (mean, 1.54 × 10⁸ CFU; SD, 9.21 × 10⁷ CFU) at the 99% confidence level. This phenomenon held true for each filter (Fig. 2). In addition, the numbers of airborne B. atrophaeus subsp. globigii spores diminished to a much lower extent than those of Btcry− spores as they exited the barn (Fig. 2, filter samplers F10 and F11). The cumulative results over the five spray events are represented graphically in Fig. 3. This diagram represents the mean log filter counts for B. atrophaeus subsp. globigii (red bars) and Btcry− (green bars). The much higher level of airborne density for the established surrogate than for the new one is clearly evident.
FIG 2.
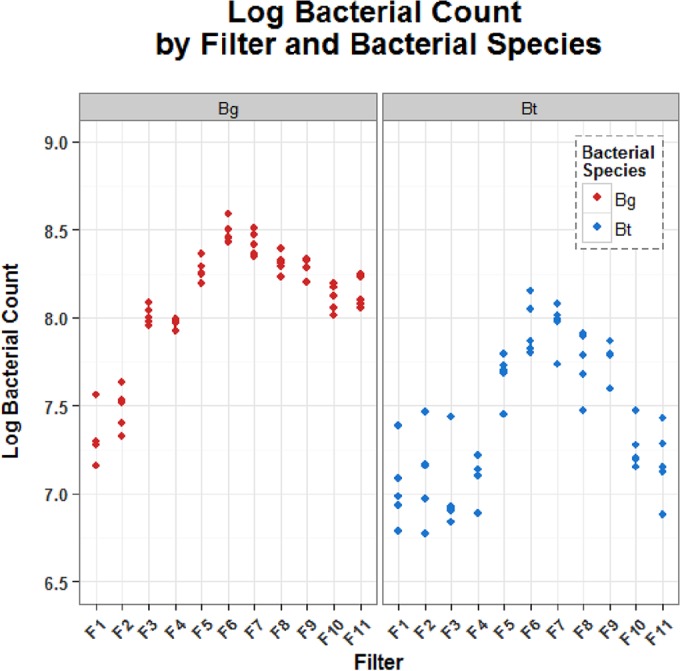
Mean bacterial counts for B. atrophaeus subsp. globigii (red symbols) and B. thuringiensis lacking cry genes (blue symbols) for each of the five spore aerosol releases at each of the 11 filter positions (F1 to F11). The bacterial count represents the total viable count recovered for each sampling period. Where fewer than five symbols are visible at any sampling site, it is because two or more of the counts are superimposed.
The two aerosol filters nearest the spray source (F1 and F2) gave the lowest spore counts (Fig. 2 and 3). These values were significantly different from the counts from all the other filters, except for F3 and F4, at the 99% confidence limit (Fig. 1). The confidence limit for the difference between the F1 and F2 filters and the F3 and F4 filters was 95%. The proposed explanation for this is that these filters were placed at either side of the first region of coupons (region P), and the plume of the spore aerosols had not yet spread to the edges of the barn. By the time the spray releases had reached filters F6 and F7, also near the barn walls, the aerosol had spread out, and high bacterial loads were recorded. Indeed, the counts at F6 and F7 (at the edges of the barn) were significantly higher (>95% significance level) than those at the central filter, F5. The aerosol concentrations for both species peaked in the middle of the length of the barn (Fig. 3): the readings at filters F5, F6, F7, F8, and F9 (Fig. 1) were higher than those on either side (F3 and F4, and F10 and F11) at the 99% confidence level.
Recovery of spores from witness trays replaced for each spray event.
As with the filters, there was no significant difference between sprays for the spore counts of either organism in the witness trays that had been placed adjacent to the filter collectors. Taken overall, there were significantly fewer B. atrophaeus subsp. globigii spores (mean, 7.33 × 10⁹ CFU m−2; SD, 1.9 × 10⁸ CFU m−2) than Btcry− spores (mean, 1.03 × 10¹⁰ CFU m−2; SD, 2.04 × 10⁸ CFU m−2) recovered at the 90% confidence level (Fig. 4). As might be expected, higher bacterial counts were obtained for both species near the spray position (Fig. 5). Also, for both species, the deposition of spores decreased sharply at WT30 and WT33 (Fig. 5); this equates to about 30 m from the spray point. Preliminary experiments (data not shown) indicated that spores would be in the dry state within 6 m of the spray device. The data from the witness trays placed adjacent to the aerosol samplers are represented in graphically in Fig. 6.
FIG 4.
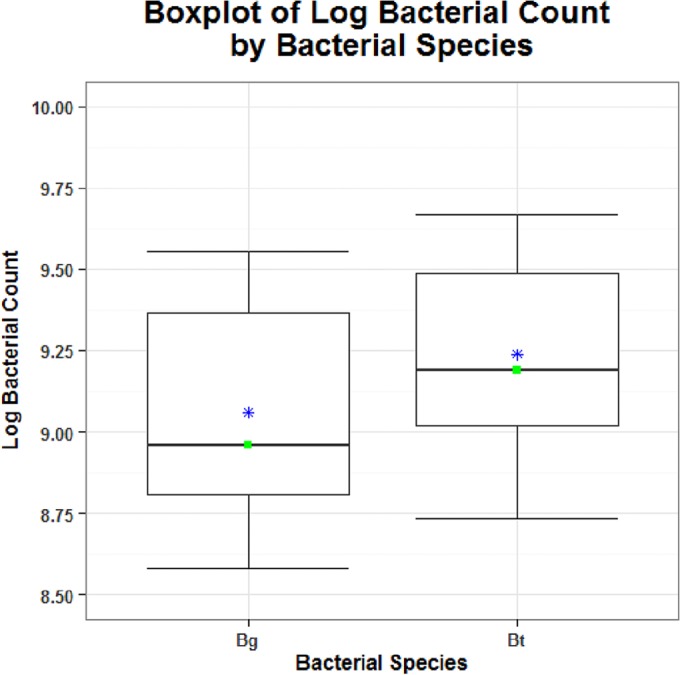
Box plots of mean levels of bacterial counts for spores of B. atrophaeus subsp. globigii (left) and B. thuringiensis lacking cry genes (right) for all of the witness trays that were replaced at each spray event. Green squares, medians; blue asterisks, average values. The counts are expressed as log CFU per square meter.
FIG 5.
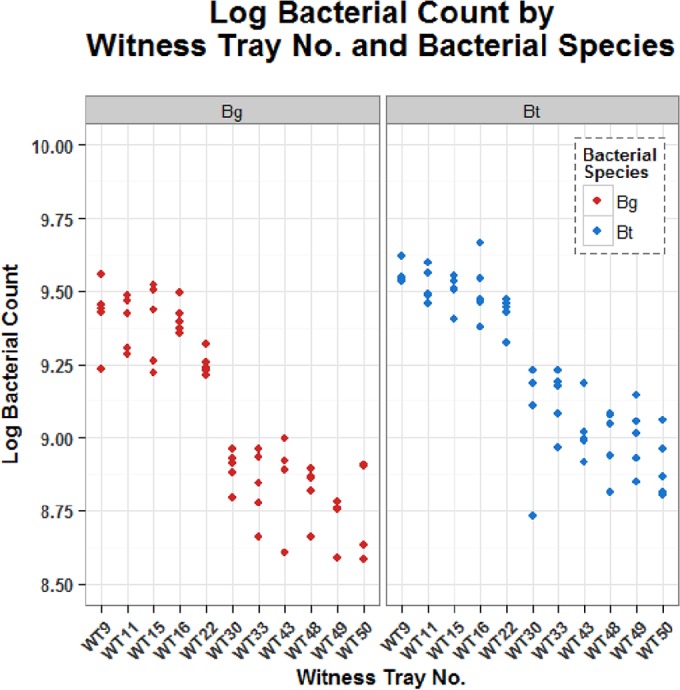
Mean bacterial counts (expressed as log CFU per square meter) for the spores of B. atrophaeus subsp. globigii (red symbols) and B. thuringiensis lacking cry genes (blue symbols) from each of the witness trays (WT9 to WT50) for each of the five spray events. Each colored symbol represents the count from one of the five spray events (which have not been individually identified). Where fewer than five shapes are visible at any sampling site, it is because two or more of the data points are superimposed.
Recovery of spores from solid surfaces.
There was a significantly higher level of deposition (99% confidence level) of Btcry− spores (mean, 5.36 × 10⁸ CFU m−2; SD, 5.90 × 10⁷ CFU m−2) than of B. atrophaeus subsp. globigii spores (mean, 2.81 × 10⁸ CFU m−2; SD, 4.63 × 10⁷ CFU m−2) when all of the surfaces in all of the regions were considered. This held true also within each region and for each surface. Considering the total array of horizontal surface coupons, there was no significant difference between deposition onto concrete or aluminum for either species. The level of deposition onto wood, though, was lower for both organisms (99% significance level) than that onto either of the other two surface types (Fig. 7). This phenomenon is clearly demonstrated when the counts from both bacterial species are combined and plotted against the region (Fig. 8). The level of deposition on wood relative to that on the other two surfaces is most noticeably lower in region P, nearest the spray source. The trend does continue with distance down the building, however (Fig. 8).
FIG 7.
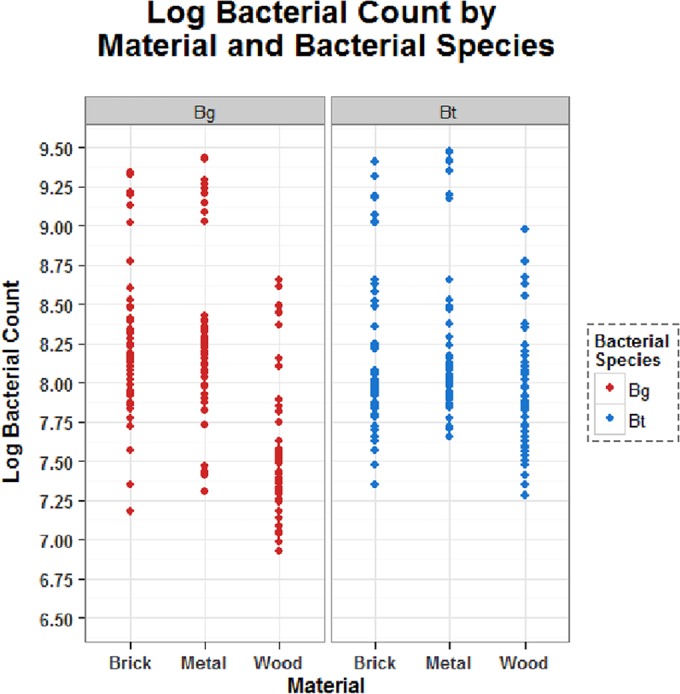
Comparison of log bacterial counts (expressed as log CFU per square meter) recovered from the three different horizontal surfaces (concrete brick, aluminum metal, and plywood) throughout the barn for spores of B. atrophaeus subsp. globigii (red symbols) and B. thuringiensis lacking cry genes (blue symbols). Each colored symbol represents a data point, although some may be superimposed on others.
FIG 8.
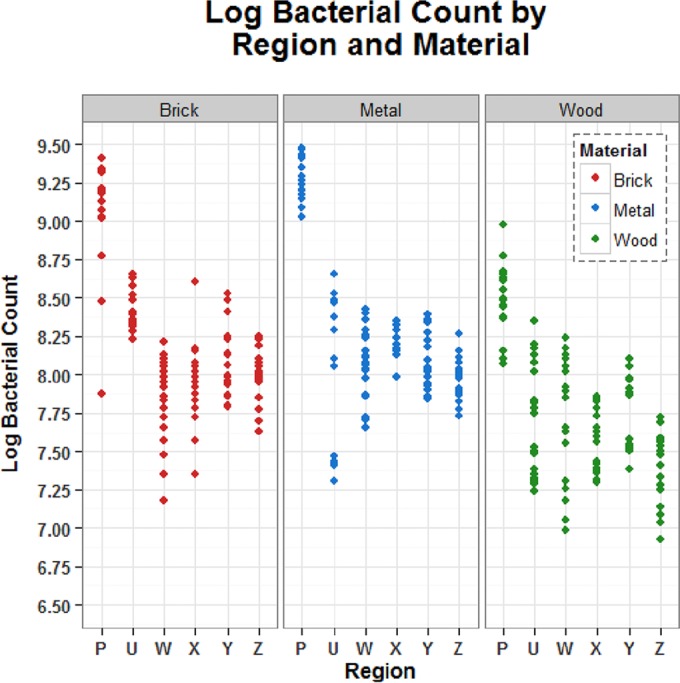
Comparison of deposition of combined B. atrophaeus subsp. globigii and Btcry− spores on the three different surfaces (concrete brick, aluminum metal, and plywood) in the different zones of the barn after the five spray events. (Log bacterial counts are expressed as log CFU per square meter). Each colored symbol represents the count from one data point; these have not been individually identified.
Deposition of spores on vertical compared to horizontal solid surfaces.
Btcry− spores were recovered at a higher level (2.3-fold) than B. atrophaeus subsp. globigii spores on average for all surfaces and at all positions on the wall (99% significance). This was true even though the mean aerosol counts in the adjacent filters (F8 and F9) showed a >3-fold-higher density of B. atrophaeus subsp. globigii spores (2.00 × 10⁹ CFU) than of Btcry− spores (6.11 × 10⁸ CFU) over the five sprays. To express the findings in another way, 11.0% of the total B. atrophaeus subsp. globigii count from filters F8 and F9 was recovered on the wall, in contrast to 69.2% for Btcry−; i.e., the deposition of Btcry− spores was >6-fold higher than that of B. atrophaeus subsp. globigii spores on the vertical surfaces relative to aerosol density. This was not a function of more Btcry− spores falling out of the aerosol phase at this position in the barn: by this stage, in region Z (Fig. 1), the mean levels of deposition on the solid surfaces were very similar (7.54 × 10⁷ CFU m−2 for B. atrophaeus subsp. globigii and 7.68 × 10⁷ CFU m−2 for Btcry−). In fact, compared to the mean percentage of deposition on all of the adjacent horizontal surfaces (expressed as CFU per square meter for all surfaces), the deposition on the wall was 2.9-fold greater for B. atrophaeus subsp. globigii and 5.5-fold greater for Btcry−.
DISCUSSION
B. atrophaeus subsp. globigii spores remained airborne to a greater extent and for a greater distance than Btcry− spores (Fig. 2 and 3). Furthermore, significantly lower aerosol concentrations of Btcry− than of B. atrophaeus subsp. globigii were found at each filter position throughout the barn, while both species were subjected to exactly the same conditions. Btcry− spores are almost twice the length of B. atrophaeus subsp. globigii spores (9) and are surrounded by an exosporium (30). This perhaps explains why they did not stay airborne as well as B. atrophaeus subsp. globigii spores: when expelled from the mist blower at the same velocity, the spores with a larger aerodynamic diameter might be expected to travel less far than those of B. atrophaeus subsp. globigii. The striking separation of the airborne bacterial count by species (Fig. 2) supports the preliminary finding that the spores were dry within 6 m of the source; given that mixed suspensions were used, it would be expected that if water droplets were still present, they would likely contain both species. This has implications for assessments of health hazard (31).
A corollary of the persistence of B. atrophaeus subsp. globigii spores in the air is that the level of recovery of Btcry− spores from the witness trays was significantly higher in all regions (Fig. 4). This was reflected on the solid surfaces. It was, perhaps, surprising that the level of deposition on wood was apparently lower than those on the other two surfaces (Fig. 7 and 8). The initial method development showed that the efficiency of spore recovery was highest for metal, intermediate for wood, and lowest for concrete (Table 1). This factor was included in the spore count data used in the barn trial. The validation work, of necessity, used spores deposited solely by gravity, whereas there would have been an element of angled impact at velocity in the barn. Such spores may have adhered to the porous surface of wood more effectively than to the smooth surface of aluminum. There are no additional data from this trial to throw light on this possibility.
Another important finding from this trial was the much greater propensity of airborne spores of Btcry− to adhere to the wall. The inference from these data is that spores of Btcry− and, by extension, due to morphological and compositional similarity, those of B. anthracis, are better able to adhere to vertical surfaces than B. atrophaeus subsp. globigii spores. The latter differ from those of Btcry− and B. anthracis in that they lack an exosporium. Several authors have demonstrated that this structure is important for attachment to surfaces (32–35). This must be inferred as an explanation, at least in part, for the significant difference in adhesion to vertical surfaces between the two surrogates. It may also have been a factor in the higher level of deposition of Btcry− spores than of B. atrophaeus subsp. globigii spores on horizontal surfaces. This could not be the whole explanation, because the level of deposition in witness trays containing PBS and the surfactant Tween 20 was always significantly higher for the new surrogate than for B. atrophaeus subsp. globigii (Fig. 4 and 5). Although the assumption was not tested, it was assumed that the two types of spores were captured on PBST with equal efficiency. Other factors, such as electrostatic force, are also likely to have played a role in attachment (36).
In addition to the comparison of vertical deposition between species, it is worth noting for both organisms that, under the conditions used, much higher counts were recovered from the wall than on the adjacent horizontal surfaces. This finding has relevance to human exposure, sampling regimes, and the decontamination of buildings and equipment following a malicious release of B. anthracis spores. This area merits greater investigation and should also be addressed in computer models. Very little has been published regarding the comparative adherence of spores to vertical and horizontal surfaces under wind flow. A study using a variety of fabric surfaces mounted on metal plates reported (37) that there was generally a ca. 2-fold increase in the deposition of aerosolized spores of B. atrophaeus subsp. globigii on vertical surfaces over that on horizontal surfaces. The horizontal velocity of aerosolized spores would be expected to be a factor in adherence to vertical surfaces. When this consideration was removed and spores were allowed to fall under gravity in a small chamber, other researchers (38) found 10-fold-higher deposition on horizontal surfaces than on vertical glass and steel surfaces. The spores of the two species used in this work have noticeably different sizes; differences in momentum upon impact may also have been a factor in adherence to horizontal and vertical surfaces.
We report here a comparison between the large-scale dispersion, deposition, and surface attachment of an established spore surrogate, B. atrophaeus subsp. globigii, and those of an acrystalliferous B. thuringiensis strain. Btcry− was also recently aerosolized within a C-130 aircraft (27), where a lower density of spores in 0.1% Tween 80 was dispersed as a wet aerosol. Relatively uniform deposition on vertical and horizontal surfaces was obtained under those conditions. It would be of interest to ascertain whether the presence of a surfactant or the wet state of the spores (rather than the dry state used in this report) resulted in the difference in attachment characteristics seen between these two trials. An outdoor release of a genetically tagged (23) crystalliferous strain of B. thuringiensis HD-1 has been undertaken (26). The high wind at the time of release resulted in a sparse plume of spores, making them difficult to detect. The advantages of using an open-ended barn during this work were that it protected the aerosol plumes from crosswinds, so that the spores could be reliably recovered within the sampling area, and that no decrease in the spore count occurred as a result of rainfall or UV irradiation. Obviously, the walls and roof will have channeled the spores, and there will have been edge effects, but because of the simultaneous release, both species will have experienced the same conditions. Given the greater propensity of Btcry− spores to adhere to vertical surfaces, it might be expected that more Btcry− spores than B. atrophaeus subsp. globigii spores were lost from detection by adherence to the walls. This would not explain the much higher airborne level of B. atrophaeus subsp. globigii spores, which was apparent even in the filters placed toward the front of the building (Fig. 2 and 3). No spore counts were taken from the walls to investigate this further.
In summary, the two spore surrogates behaved noticeably differently under the conditions used. B. atrophaeus subsp. globigii has been used (39, 40) to model the dispersal and deposition behavior of B. anthracis spores, but the work presented here, supported by morphological comparisons (8, 9), suggests that it might not be the best surrogate, at least under some conditions. Further testing and characterization of Btcry− aerosols under different conditions are required; there is a need for a safe, accurate surrogate for B. anthracis spores to produce experimental data to augment the modeling methods currently available (41–43). In addition, Btcry− could be used as a test and validation tool for a wide variety of applications in the biomedical, environmental, and food industries and as a material of choice for the testing and evaluation of protection equipment (e.g., commercial biosensors).
ACKNOWLEDGMENTS
We acknowledge joint funding by government departments through the CONTEST Programme to support this work.
We thank the members of the CBR Test and Evaluation and Range teams for helping with the trial. Jennifer Latham and Bethany Howells worked tirelessly in the barn and during the subsequent processing of samples. Silsoe Spray Applications Unit provided invaluable advice and assistance. Vicky Cox carried out the statistical analysis. James Nally contributed the computer representations of the dispersal of spores. We are particularly grateful for the support and collaboration of Sara Casey.
REFERENCES
- 1.Schwartz M. 2009. Dr. Jekyll and Mr. Hyde: a short history of anthrax. Mol Aspects Med 30:347–355. doi: 10.1016/j.mam.2009.06.004. [DOI] [PubMed] [Google Scholar]
- 2.Goel AK. 2015. Anthrax: a disease of biowarfare and public health importance. World J Clin Cases 3:20–33. doi: 10.12998/wjcc.v3.i1.20. [DOI] [PMC free article] [PubMed] [Google Scholar]
- 3.Gibbons HS, Broomall SM, McNew LA, Daligault H, Chapman C, Bruce D, Karavis M, Krepps M, McGregor PA, Hong C, Park KH, Akmal A, Feldman A, Lin JS, Chang WE, Higgs BW, Demirev P, Lindquist J, Liem A, Fochler E, Read TD, Tapia R, Johnson S, Bishop-Lilly KA, Detter C, Han C, Sozhamannan S, Rosenzweig CN, Skowronski EW. 2011. Genomic signatures of strain selection and enhancement in Bacillus atrophaeus var. globigii, a historical biowarfare simulant. PLoS One 6(3):e17836. doi: 10.1371/journal.pone.0017836. [DOI] [PMC free article] [PubMed] [Google Scholar]
- 4.Handler FA, Edmonds JM. 2015. Quantitative analysis of effects of UV exposure and spore cluster size on deposition and inhalation hazards of Bacillus spores. Aerosol Sci Technol 49:1121–1130. doi: 10.1080/02786826.2015.1102857. [DOI] [Google Scholar]
- 5.Garza AG, Van Cuyk SM, Brown MJ, Omberg KM. 2014. Detection of the urban release of a Bacillus anthracis simulant by air sampling. Biosecur Bioterror 12:66–75. doi: 10.1089/bsp.2013.0086. [DOI] [PMC free article] [PubMed] [Google Scholar]
- 6.Greenberg DL, Busch JD, Keim P, Wagner DW. 2010. Identifying experimental surrogates for Bacillus anthracis spores: a review. Investig Genet 1:4. doi: 10.1186/2041-2223-1-4. [DOI] [PMC free article] [PubMed] [Google Scholar]
- 7.Sinclair RG, Rose JB, Hashsham SA, Gerba CP, Haas CN. 2012. Criteria for selection of surrogates used to study the fate and control of pathogens in the environment. Appl Environ Microbiol 78:1969–1997. doi: 10.1128/AEM.06582-11. [DOI] [PMC free article] [PubMed] [Google Scholar]
- 8.Tufts JA, Calfee MW, Lee SD, Ryan SP. 2014. Bacillus thuringiensis as a surrogate for Bacillus anthracis in aerosol research. World J Microbiol Biotechnol 30:1453–1461. doi: 10.1007/s11274-013-1576-x. [DOI] [PubMed] [Google Scholar]
- 9.Carrera M, Zandomeni RO, Fitzgibbon J, Sagripanti J-L. 2006. Difference between the spore sizes of Bacillus anthracis and other Bacillus species. J Appl Microbiol 120:303–312. doi: 10.1111/j.1365-2672.2006.03111.x. [DOI] [PubMed] [Google Scholar]
- 10.Bishop AH. 2002. Bacillus thuringiensis insecticides, p 160–175. Berkeley R, Heyndrickx M, Logan NA, De Vos. P (ed), Applications and systematics of Bacillus and relatives. Blackwell, Oxford, United Kingdom. [Google Scholar]
- 11.van Frankenhuyzen K. 2009. Insecticidal activity of Bacillus thuringiensis crystal proteins. J Invertebr Pathol 101:1–16. doi: 10.1016/j.jip.2009.02.009. [DOI] [PubMed] [Google Scholar]
- 12.Bishop AH, Robinson CV. 2014. Bacillus thuringiensis HD-1 Cry−: development of a safe, non-insecticidal simulant for Bacillus anthracis. J Appl Microbiol 117:654–662. doi: 10.1111/jam.12560. [DOI] [PubMed] [Google Scholar]
- 13.Dulmage HT. 1970. Insecticidal activity of HD-1, a new isolated of Bacillus thuringiensis var. alesti. J Invertebr Pathol 15:232–239. [Google Scholar]
- 14.Menn JJ, Hall FR. 1999. Biopesticides: present status and future prospects, p 1–10. In Hall FR, Menn JJ (ed), Biopesticides: use and delivery. Humana Press, Totowa, NJ. [Google Scholar]
- 15.Siegel JP, Shadduck JA. 1990. Safety of microbial insecticides to vertebrates: humans, p 101–114. In Laird M, Lacey LA, Davidson EW (ed), Safety of microbial insecticides. CRC Press, Boca Raton, FL. [Google Scholar]
- 16.Pearce M, Habbick B, Williams J, Eastman M, Newman M. 2002. The effects of aerial spraying with Bacillus thuringiensis Kurstaki on children with asthma. Can J Public Health 93:21–25. [DOI] [PMC free article] [PubMed] [Google Scholar]
- 17.Roh JY, Choi JY, Li MS, Jin BR, Je YH. 2007. Bacillus thuringiensis as a specific, safe, and effective tool for insect pest control. J Microbiol Biotechnol 17:547–559. [PubMed] [Google Scholar]
- 18.Valadares De Amorim G, Whittome B, Shore B, Levin DB. 2001. Identification of Bacillus thuringiensis subsp. kurstaki strain HD1-like bacteria from environmental and human samples after aerial spraying of Victoria, British Columbia, Canada, with Foray 48B. Appl Environ Microbiol 67:1035–1043. doi: 10.1128/AEM.67.3.1035-1043.2001. [DOI] [PMC free article] [PubMed] [Google Scholar]
- 19.Van Cuyk S, Deshpande A, Hollander A, Duval N, Ticknor L, Layshock J, Gallegos-Graves L, Omberg KM. 2011. Persistence of Bacillus thuringiensis subsp kurstaki in urban environments following spraying. Appl Environ Microbiol 77:7954–7961. doi: 10.1128/AEM.05207-11. [DOI] [PMC free article] [PubMed] [Google Scholar]
- 20.Smith RA, Barry JW. 1998. Environmental persistence of Bacillus thuringiensis spores following aerial application. J Invertebr Pathol 71:263–267. doi: 10.1006/jipa.1997.4738. [DOI] [PubMed] [Google Scholar]
- 21.Donnison A, Ross C, Noonan M, Fisher G, Waller J. 2004. Bacterial survival and dispersal in spray irrigation aerosols. N Z J Agric Res 47:575–585. doi: 10.1080/00288233.2004.9513622. [DOI] [Google Scholar]
- 22.Levin DB, Valadares de Amorim G. 2003. Potential for aerosol dissemination of biological weapons: lessons from the biological control of insects. Biosecur Bioterror 1:37–42. doi: 10.1089/15387130360514814. [DOI] [PubMed] [Google Scholar]
- 23.Buckley PA, Rivers B, Katoski S, Kim MH, Kragl FJ, Broomall S, Krepps M, Skowronski EW, Rosenzweig CN, Paikoff S, Emanuel PA, Gibbons HS. 2012. Genetic barcodes for improved environmental tracking of an anthrax simulant. Appl Environ Microbiol 78:8272–8280. doi: 10.1128/AEM.01827-12. [DOI] [PMC free article] [PubMed] [Google Scholar]
- 24.Buhr T, Young AA, Wells CM, Minter ZA, McPherson DC, Hooban C, Johnson C, Prokop EJ, Crigler JR. 2012. Test method development to evaluate hot, humid air decontamination of materials contaminated with Bacillus anthracis ΔSterne and B. thuringiensis Al Hakam spores. J Appl Microbiol 113:1037–1051. doi: 10.1111/j.1365-2672.2012.05423.x. [DOI] [PubMed] [Google Scholar]
- 25.Bishop AH. 2014. Germination and persistence of Bacillus anthracis and Bacillus thuringiensis in soil microcosms. J Appl Microbiol 117:1274–1282. doi: 10.1111/jam.12620. [DOI] [PubMed] [Google Scholar]
- 26.Emanuel PA, Buckley PE, Sutton TA, Edmonds JM, Bailey AM, Rivers BA, Kim MH, Ginley WJ, Keiser CC, Doherty RW, Kragl FJ, Narayanan FE, Katoski SE, Paikoff S, Leppert SP, Strawbridge JB, VanReenen DR, Biberos SS, Moore D, Phillips DW, Mingioni LR, Melles O, Ondercin DG, Hirsh B, Bieschke KM, Harris CL, Omberg KM, Rastogi VK, Van Cuyk S, Gibbons HS. 2012. Detection and tracking of a novel genetically tagged biological simulant in the environment. Appl Environ Microbiol 78:8281–8288. doi: 10.1128/AEM.02006-12. [DOI] [PMC free article] [PubMed] [Google Scholar]
- 27.Buhr TL, Young AA, Bensman M, Minter ZA, Kennihan NL, Johnson CA, Bohmke MD, Borgers-Klonkowski E, Osborn EB, Avila SD, Theys AMG, Jackson PJ. 2016. Hot, humid air decontamination of a C-130 aircraft contaminated with spores of two acrystalliferous Bacillus thuringiensis strains, surrogates for Bacillus anthracis. J Appl Microbiol 120:1074–1084. doi: 10.1111/jam.13055. [DOI] [PubMed] [Google Scholar]
- 28.Lecadet M-M, Blondel MO, Ribier J. 1980. Generalized transduction in Bacillus thuringiensis var. berliner 1715 using bacteriophage CP-54Ber. J Gen Microbiol 121:203–212. [DOI] [PubMed] [Google Scholar]
- 29.Edmonds JM, Collett PJ, Valdes ER, Skowronski EW, Pellar GJ, Emanuel PA. 2009. Surface sampling of spores in dry-deposition aerosols. Appl Environ Microbiol 75:39–44. doi: 10.1128/AEM.01563-08. [DOI] [PMC free article] [PubMed] [Google Scholar]
- 30.Stewart GC. 2015. The exosporium layer of bacterial spores: a connection to the environment and the infected host. Microbiol Mol Biol Rev 79:437–457. doi: 10.1128/MMBR.00050-15. [DOI] [PMC free article] [PubMed] [Google Scholar]
- 31.Thomas RJ, Webber D, Sellors W, Collinge A, Frost A, Stagg AJ, Bailey SC, Jayasekera PN, Taylor RR, Eley S, Titball RW. 2008. Characterization and deposition of respirable large- and small-particle bioaerosols. Appl Environ Microbiol 74:6437–6443. doi: 10.1128/AEM.01194-08. [DOI] [PMC free article] [PubMed] [Google Scholar]
- 32.Kailas L, Terry C, Abbott N, Taylor R, Mullin N, Tzokov SB, Todd SJ, Wallace BA, Hobbs JK, Moir A, Bullough PA. 2011. Surface architecture of endospores of the Bacillus cereus/anthracis/thuringiensis family at the subnanometer scale. Proc Natl Acad Sci U S A 108:16014–16019. doi: 10.1073/pnas.1109419108. [DOI] [PMC free article] [PubMed] [Google Scholar]
- 33.Williams G, Linley E, Nicholas R, Baillie L. 2013. The role of the exosporium in the environmental distribution of anthrax. J Appl Microbiol 114:396–403. doi: 10.1111/jam.12034. [DOI] [PubMed] [Google Scholar]
- 34.Faille C, Tauveron G, Le Gentil-Lelièvre C, Slomianny C. 2007. Occurrence of Bacillus cereus spores with a damaged exosporium: consequences on the spore adhesion on surfaces of food processing lines. J Food Prot 70:2346–2353. [DOI] [PubMed] [Google Scholar]
- 35.Joshi LT, Phillips DS, Williams CF, Alyousef A, Baillie L. 2012. Contribution of spores to the ability of Clostridium difficile to adhere to surfaces. Appl Environ Microbiol 78:7671–7679. doi: 10.1128/AEM.01862-12. [DOI] [PMC free article] [PubMed] [Google Scholar]
- 36.Chen G, Driks A, Tawfiq K, Mallozzi M, Patil S. 2010. Bacillus anthracis and Bacillus subtilis spore surface properties and transport. Colloids Surf B 76:512–518. doi: 10.1016/j.colsurfb.2009.12.012. [DOI] [PubMed] [Google Scholar]
- 37.Sajo E, Wallace W, Lumley A, Heimbuch B, Donahue K, Nielsen B, Owens J, Wander J. 2015. Capture of aerosolized spores from air streams impinging onto fabrics. J Aerosol Sci 80:75–85. doi: 10.1016/j.jaerosci.2014.10.010. [DOI] [Google Scholar]
- 38.Lewandowski R, Kozłowska K, Szpakowska M, Stępińska M, Trafny EA. 2010. Use of a foam spatula for sampling surfaces after bioaerosol deposition. Appl Environ Microbiol 76:688–694. doi: 10.1128/AEM.01849-09. [DOI] [PMC free article] [PubMed] [Google Scholar]
- 39.Chung E, Yiacoumi S, Lee I, Tsouris C. 2010. The role of the electrostatic force in spore adhesion. Environ Sci Technol 44:6209–6214. doi: 10.1021/es101730y. [DOI] [PubMed] [Google Scholar]
- 40.Krauter P, Biermann A. 2007. Reaerosolization of fluidized spores in ventilation systems. Appl Environ Microbiol 73:2165–2172. doi: 10.1128/AEM.02289-06. [DOI] [PMC free article] [PubMed] [Google Scholar]
- 41.Ho J, Duncan S. 2005. Estimating aerosol hazards from an anthrax letter. J Aerosol Sci 36:701–719. doi: 10.1016/j.jaerosci.2004.11.019. [DOI] [Google Scholar]
- 42.Legrand J, Egan JR, Hall IM, Cauchemez S, Leach S, Ferguson NM. 2009. Estimating the location and spatial extent of a covert anthrax release. PLoS Comput Biol 5(1):e1000356. doi: 10.1371/journal.pcbi.1000356. [DOI] [PMC free article] [PubMed] [Google Scholar]
- 43.Hogan WR, Cooper GF, Wallstrom GL, Wagner MM, Depinay JM. 2007. The Bayesian aerosol release detector: an algorithm for detecting and characterizing outbreaks caused by an atmospheric release of Bacillus anthracis. Stat Med 26:5225–5252. doi: 10.1002/sim.3093. [DOI] [PubMed] [Google Scholar]


