Abstract
Activation of cellular stress response pathways to maintain metabolic homeostasis is emerging as a critical growth and survival mechanism in many cancers1. The pathogenesis of pancreatic ductal adenocarcinoma (PDA) requires high levels of autophagy2–4, a conserved self-degradative process5. However, the regulatory circuits that activate autophagy and reprogram PDA cell metabolism are unknown. We now show that autophagy induction in PDA occurs as part of a broader transcriptional program that coordinates activation of lysosome biogenesis and function, and nutrient scavenging, mediated by the MiT/TFE family transcription factors. In PDA cells, the MiT/TFE proteins6 – MITF, TFE3 and TFEB – are decoupled from regulatory mechanisms that control their cytoplasmic retention. Increased nuclear import in turn drives the expression of a coherent network of genes that induce high levels of lysosomal catabolic function essential for PDA growth. Unbiased global metabolite profiling reveals that MiT/TFE-dependent autophagy-lysosomal activation is specifically required to maintain intracellular amino acid (AA) pools. These results identify the MiT/TFE transcription factors as master regulators of metabolic reprogramming in pancreatic cancer and demonstrate activation of clearance pathways converging on the lysosome as a novel hallmark of aggressive malignancy.
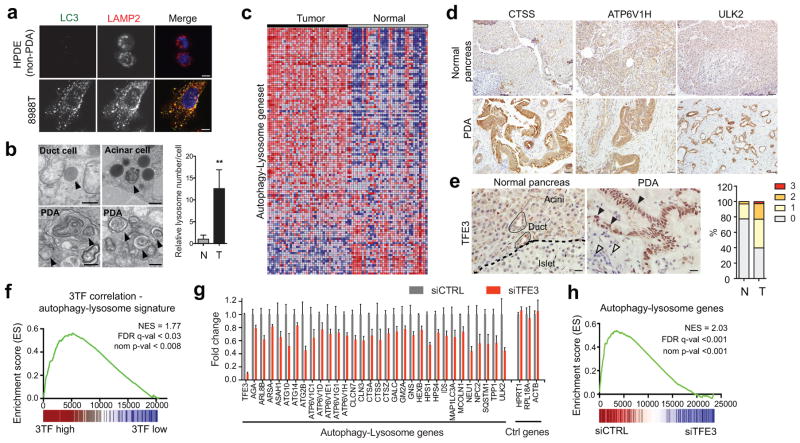
Autophagy delivers cargo to lysosomes for degradation, suggesting the possibility that these systems may be coordinately regulated in PDA. Immunostaining for LC3 and LAMP2 revealed significant expansion of both organelles in PDA cell lines compared to non-transformed human pancreatic ductal epithelial cells (HPDE) (Fig. 1A, Extended Data Figure 1A). Notably, transmission electron microscopy demonstrated an increase in lysosome number/cell in treatment-naïve PDA specimens relative to normal pancreatic tissue (15.0 ± 1.9 vs 1.0 ± 0.9; Fig. 1B). Thus, increased lysosomal biogenesis accompanies the expanded autophagosome compartment in PDA and may facilitate high levels of autophagic flux. Consistent with transcription control of these organellar changes, gene set enrichment analysis (GSEA) of multiple independent datasets revealed that human PDA specimens have elevated expression of autophagy-lysosome genes compared to normal pancreatic tissue (Fig. 1C, Extended Data Figure 1B; Table S1, S2). Accordingly, immunohistochemistry confirmed upregulation of autophagy/lysosome proteins in the tumor epithelium (Fig. 1D).
Figure 1. Coordinate induction of an autophagy-lysosome gene program in PDA by MiT/TFE proteins.
a) Immunofluorescence staining showing extensive overlap of autophagosomes (LC3) and lysosomes (LAMP2) in 8988T cells compared to HPDE cells.
b) Representative transmission electron micrographs showing increased abundance of lysosomes in PDA compared to normal pancreas. Relative lysosome numbers/cell are quantified (see Methods). N = 473 cells from 4 normal specimens and 406 cells from 3 PDA specimens..** p < 0.001
c) Upregulation of autophagy/lysosomal genes in PDA relative to matched normal tissue (see Table S2).
d, e) Immunohistochemistry showing upregulation of autophagy and lysosomal proteins (d) and nuclear localized TFE3 (e) in the PDA epithelium (closed arrowheads) compared to normal pancreas (left) or stromal cells (open arrowheads). Graph (e) shows quantification of TFE3 staining intensity (0 = no staining to 3 = high staining) in normal (N = 31) and PDA samples (N = 354).
f) GSEA showing correlation between MiT/TFE (3TF) expression and the autophagy-lysosome gene signature in primary human PDA.
g, h) TFE3 knockdown in 8988T cells causes coordinate downregulation of autophagy-lysosome genes. (g) RNA-seq values from N = 3 independent experiments; p < 0.05 for each gene; (h) GSEA.
Scale bars: 11 μm (a), 500 nm (b), 50 μm (d) and 20 μm (e).
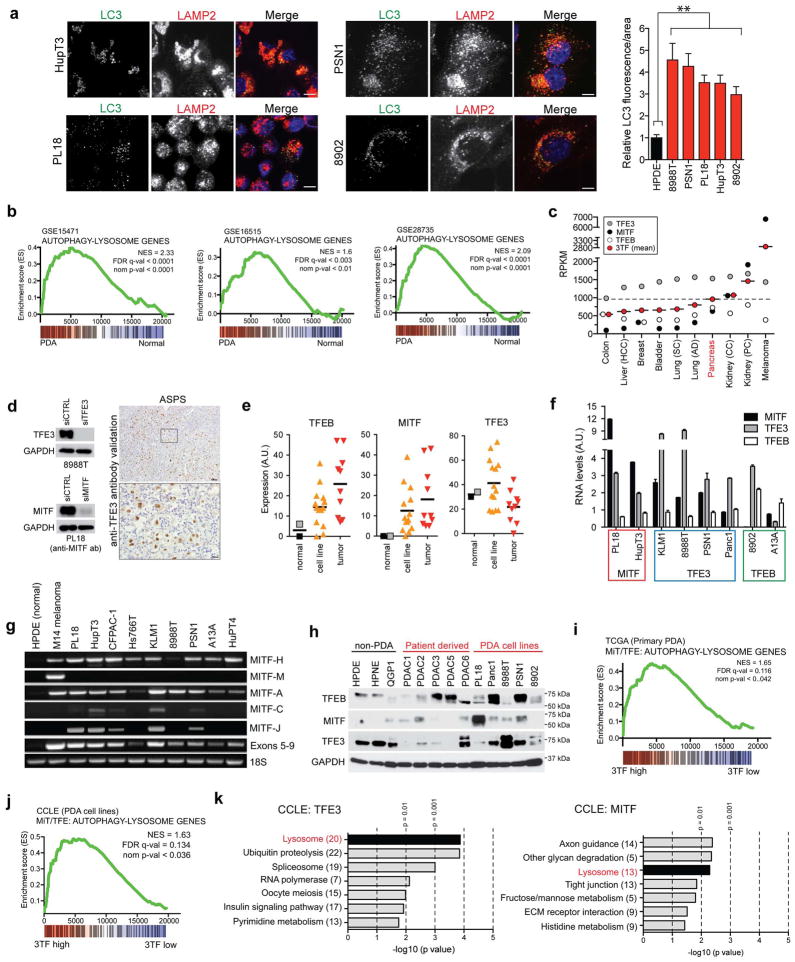
In normal cells exposed to nutrient stress, the biogenesis of both organelles is under transcriptional regulation by the MiT/TFE subclass of basic helix-loop-helix transcription factors6–11. RNA-sequencing data across 10 common solid tumor types revealed high relative expression of these factors in PDA, with levels only exceeded in melanoma and kidney cancers, where MiT/TFE are established oncogenes (Extended Data Figure 1C). Immunohistochemistry demonstrated overexpression of nuclear-localized TFE3 in the neoplastic epithelium in a subset of PDA (staining scores ≥2 in 23% of PDA versus 3% of normal pancreas specimens; p<0.001; Fig. 1E, Extended Data Figure 1D; see Methods). Similarly, microdissected specimens and xenografts exhibited frequent upregulation of TFEB and MITF mRNA in PDA cells relative to normal ductal epithelium, and subsets of PDA cell lines showed MiT/TFE overexpression compared with HPDE cells (Extended Data Figure 1E–H). Generally, a single MiT/TFE family member predominated in individual specimens.
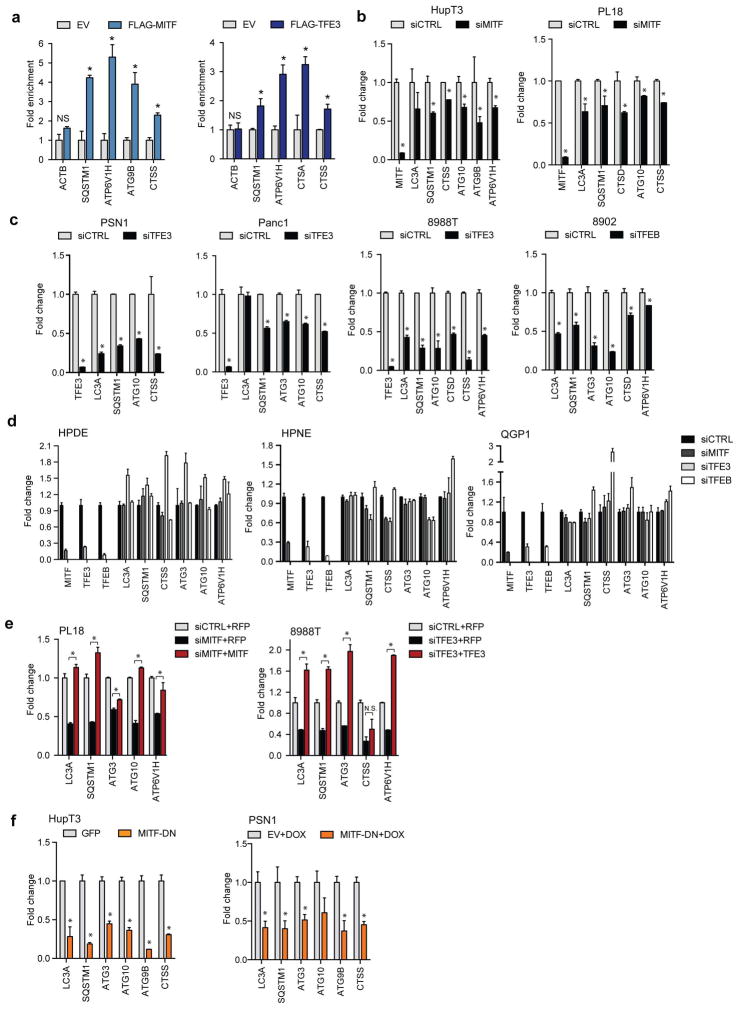
GSEA of multiple human primary PDA datasets and cultured PDA cell lines showed strong correlation between expression of MiT/TFE factors and the autophagy-lysosome signature (Fig. 1F, Extended Data Figure 1I–K). Accordingly, knockdown of TFE3 in the 8988T PDA cell line (TFE3-high, TFEB/MITF-low) resulted in prominent repression of this signature (global RNA-seq; Fig. 1G, H). Chromatin immunoprecipitation (ChIP) confirmed that MITF and TFE3 bound to multiple autophagy and lysosome genes bearing a consensus CLEAR (Coordinated Lysosomal Expression and Regulation) element7,8 in PDA cells (Extended Data Figure 2A). Moreover, knockdown of MITF, TFE3, or TFEB caused down-regulation of numerous CLEAR-bearing genes in a series of PDA cell lines with high relative expression of that MiT/TFE family member, whereas no significant changes were seen non-transformed pancreatic lines (HPDE and HPNE) and a pancreatic neuroendocrine tumor cell lines (QGP1) (Extended Data Figure 2B–D). Expression of RNAi-resistant MITF or TFE3 cDNA restored target gene expression whereas dominant-negative MITF recapitulated the effects seen with RNAi (Extended Data Figure 2E–G). Thus, MiT/TFE proteins act selectively in PDA cells to regulate a broad autophagy-lysosomal program under basal conditions.
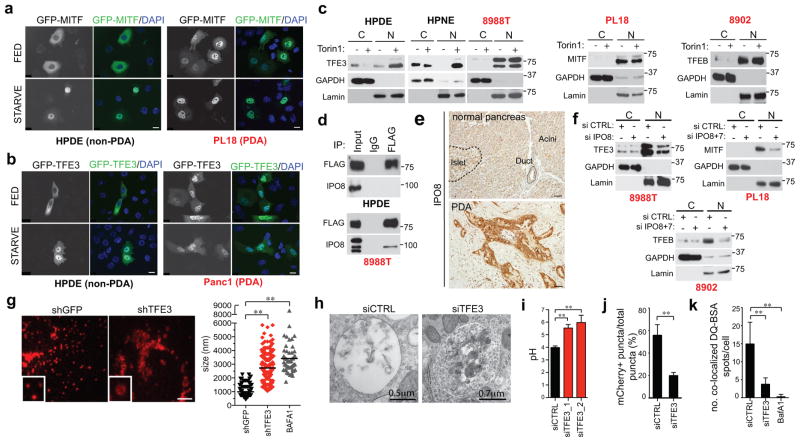
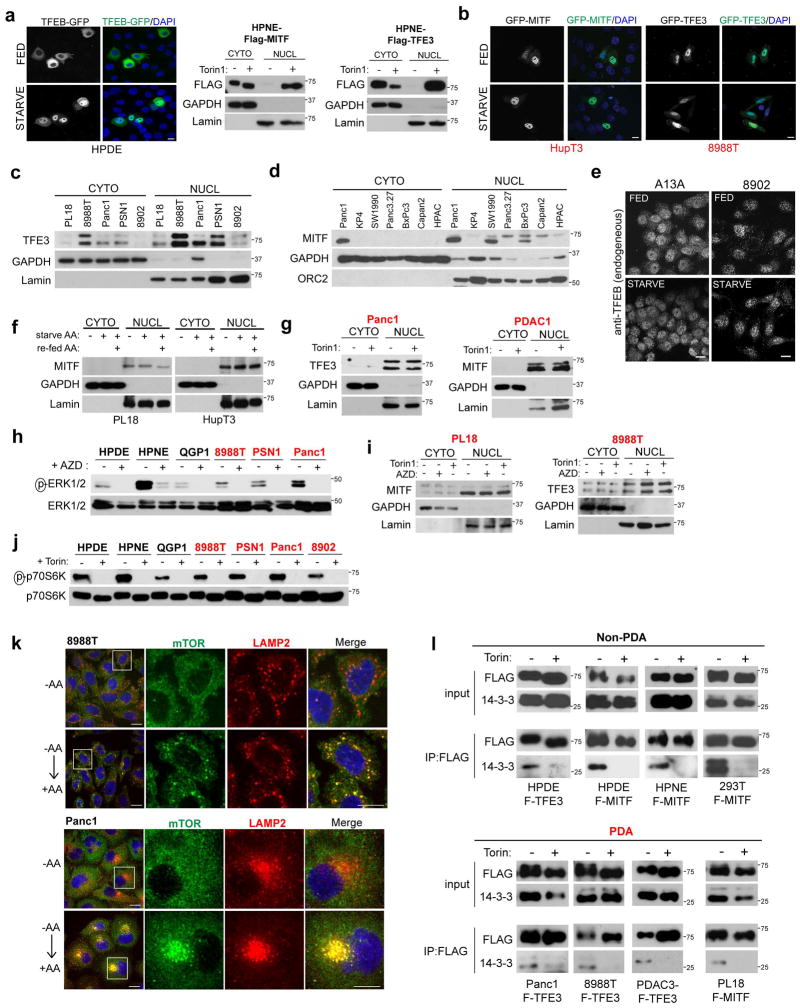
In non-transformed cells grown in nutrient replete conditions, the MiT/TFE proteins are phosphorylated by mTORC1 at the lysosome membrane leading to their interaction with 14-3-3 proteins and cytoplasmic retention, whereas mTORC1 inactivation upon starvation enables their nuclear translocation9–11. Correspondingly, HPDE and HPNE cells exhibited predominantly cytoplasmic residence of endogenous and ectopically-expressed TFE3, MITF, and TFEB under full nutrients, and showed nuclear translocation following nutrient starvation or treatment with the mTOR inhibitor, Torin1 (Fig. 2A–C, Extended Data Figure 3A). In stark contrast, a series of PDA cell lines showed constitutive nuclear localization of each MiT/TFE protein, regardless of nutrient status or treatment with Torin1 or with inhibitors of MEK, another pathway implicated in their regulation8 (Fig. 2A–C, Extended Data Figure 3B–I). Immunoblot for phospho-p70S6K, a readout of mTORC1 activity, and immunostaining for mTOR and LAMP2 indicated that mTORC1 was active and demonstrated amino acid-regulated lysosomal association in PDA cells (Extended Data Figure 3J, K). In addition, all cells exhibited co-immunoprecipitation of TFE3 and MITF with 14-3-3 and loss of binding upon Torin1 treatment, although the fractional binding in PDA cells was lower, consistent with the predominantly nuclear residence of the MiT/TFE proteins (Extended Data Figure 3L). Thus, PDA cells show constitutive nuclear residence of MiT/TFE despite displaying intact mTORC1 signaling.
Figure 2. Constitutive nuclear import of MiT/TFE factors controls autophagy-lysosome function in PDA.
a, b) Fluorescence microscopy showing localization of (a) GFP-MITF and (b) GFP-TFE3 in the indicated cells under fed and starved (3 hrs HBSS) conditions.
c) Immunoblots for TFE3 (left three panels), MITF (middle panel) and TFEB (right panel) in cytoplasmic (C) and nuclear (N) fractions of cells treated with vehicle or Torin1 (250 nM) for 1hr.
d) FLAG-TFE3 was stably expressed in cells and lysates were immunoprecipitated with anti-FLAG antibody or control IgG and immunoblotted for FLAG (TFE3) or IPO8.
e) Representative IPO8 immunostaining in human specimens. f) PDA cell lines were transfected with the indicated siRNAs, fractionated and immunoblotted for TFE3, (8988T cells, left panel), MITF (PL18 cells, middle panel) or TFEB (8902 cells, right panel).
g) TFE3 knockdown causes aberrant lysosomal morphology and increased size as shown by LAMP2 staining. Inset: magnified view. Graph (right): quantification of lysosome diameter in cells expressing shGFP (N = 151), shTFE3 (N = 193), or treated with BafA1 (N = 52). ** p <0.0001.
h) Electron micrographs showing accumulation of undigested cargo in lysosomes upon TFE3 knockdown.
i) Measurement of lysosomal pH in 8988T cells transfected with the indicated siRNAs. N = 3 independent experiments; ** p < 0.001 (see Methods).
j) Quantification of total number of autolysosomes (mCherry+/GFP− spots) from N = 10 cells/condition using a tandem mCherry-GFP-LC3 reporter. Error bars represent mean ± s.e.m. ** p < 0.0001.
k) Proteolysis of macropinocytosed protein is impaired by TFE3 knockdown or BafA1 treatment as determined by pulse-chase with DQ-BSA. Degradation of DQ-BSA in lysosomes is quantified (number of fluorescent spots/cell co-localizing with LAMP2+ lysosomes for N = 3 independent experiments with at least 50 cells scored per experiment). ** p < 0.0001.
Scale bars = 18 μm (a, b), 50 μm (e), 7.5 μm (g).
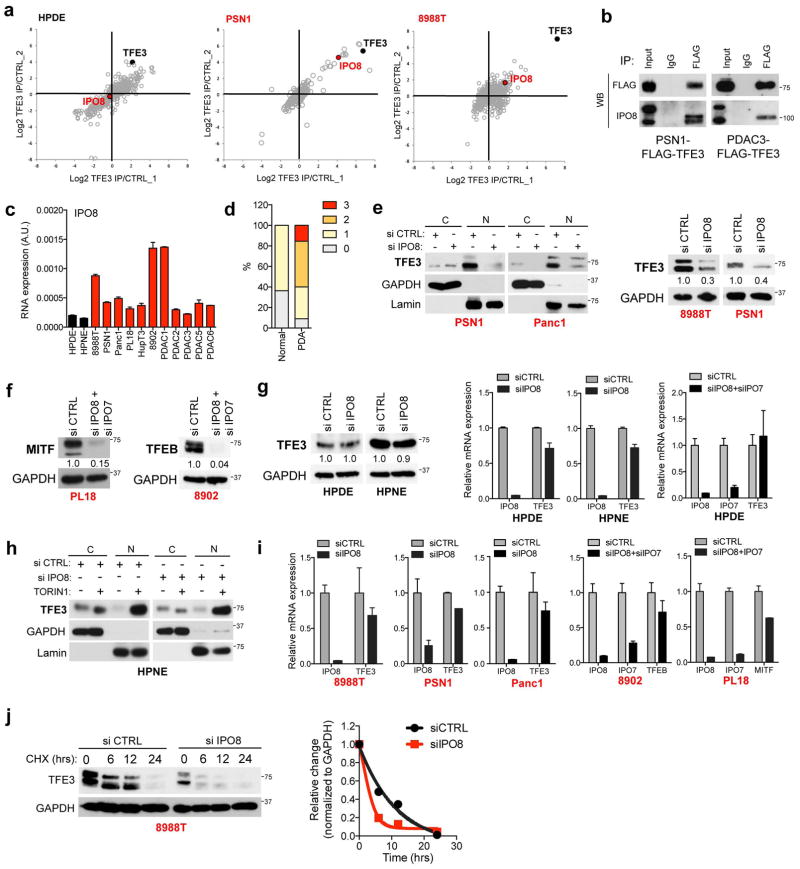
In order to uncover machinery that overrides cytoplasmic retention mechanisms, we employed affinity purification and quantitative proteomics12 to identify PDA-specific TFE3-interacting proteins. Notably, Importin 8 (IPO8), a member of the Importin-β family of nucleocytoplasmic transporters13,14, was significantly enriched in TFE3 immunoprecipitates in PDA cells but not in HPDE cells (Extended Data Figure 4A). We confirmed that FLAG-tagged TFE3 bound endogenous IPO8 specifically in PDA cells (Fig. 2D, Extended Data Figure 4B). In addition, IPO8 was expressed at elevated levels in human PDA specimens and cell lines compared to controls (Fig. 2E, Extended Data Figure 4C, D).
IPO8 and its most closely related homolog, IPO7 direct nuclear import of specific cargo, including growth regulatory proteins14–19. Accordingly, IPO8 knockdown caused a marked decrease in nuclear TFE3 and reduced overall TFE3 protein levels in multiple PDA cell lines (Fig. 2F left, Extended Data Figure 4E). Similar effects were observed for both MITF and TFEB upon combined IPO8 and IPO7 knockdown (Fig. 2F middle, right, Extended Data Figure 4F). Importantly, in non-transformed HPDE and HPNE cells, IPO8 knockdown did not affect basal (cytoplasmic) TFE3 levels nor Torin1-induced nuclear translocation of TFE3 (Extended Data Figure 4G, H). Moreover, MiT/TFE mRNA levels were not significantly altered by IPO7/IPO8 inactivation (Extended Data Figure 4I). These findings suggest that Importins may regulate the stability of MiT/TFE proteins in addition to facilitating their nuclear transport. Indeed, cycloheximide (CHX) treatment studies revealed that IPO8 knockdown accelerated TFE3 turnover in 8988T cells (Extended Data Figure 4J). Thus, IPO8-dependent nuclear accumulation of MiT/TFE factors results in their stabilization and upregulation of their transcriptional programs in PDA cells.
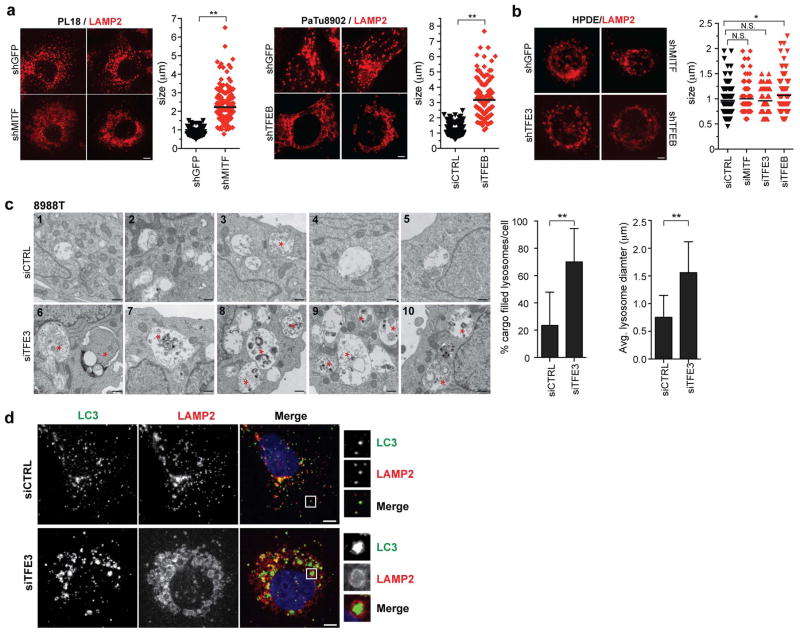
We found that constitutive activation of MiT/TFE proteins was critical for autophagy-lysosome function in PDA cells. Depletion of MiT/TFE proteins across a series of PDA cells lines resulted in striking defects in lysosome morphology and increased lysosome diameter, effects commonly associated with lysosomal stress and defective proteolysis20,21 (986.4 ± 30.7nm vs 2722 ± 72.6 nm for siCTRL and siTFE3 respectively Fig. 2G, Extended Data Figure 5A), whereas HPDE cells were minimally affected (Extended Data Figure 5B). These effects were phenocopied by treatment of PDA cells with the vacuolar-type H(+)-ATPase inhibitor, Bafilomycin A1 (BafA1) (Fig. 2G). Correspondingly, transmission electron microscopy and immunofluorescence microscopy of TFE3 knockdown cells revealed accumulation of autolysosomes containing undigested cargo (Fig. 2H, Extended Data Figure 5C, D). Moreover, there was a pronounced increase in lysosomal pH as demonstrated using the pH-sensitive dye Oregon Green 514 coupled to dextran (Fig. 2I). Moreover, mCherry-GFP-LC3 autophagy reporter assays revealed that TFE3 inactivation decreased autophagic flux in 8988T cells (55.7% ± 9.6% mCherry+/GFP− spots in siCTRL vs 19.8% ± 2.9% in siTFE3, Fig. 2J). Finally, to assay proteolytic activity, 8988T cells were fed BODIPY-dye-conjugated BSA (DQ-BSA) that is taken up by macropinocytosis and fluoresces following proteolysis in lysosomes. TFE3 knockdown or BafA1 treatment resulted in dramatic decreases in fluorescent puncta co-localized with LAMP2 (14.8 ± 6.1 spots/cell in siCTRL vs 3.7 ± 1.8 and 0.2 ± 0.7 spots/cell in siTFE3 and BafA1 respectively, Fig. 2K). TMR-dextran uptake was not affected, indicating specific impairment in lysosomal proteolysis rather than in internalization of extracellular cargo (not shown). Notably, lysosomal breakdown of extracellular albumin scavenged through macropinocytosis is an important nutrient source in PDA22. Thus, by governing both autophagic flux and lysosomal catabolism, the MiT/TFE proteins support an integrated cellular clearance program that enables efficient processing of cargo from autophagy as well as macropinocytosis, providing PDA cells access to critical sources of both intracellular and extracellular nutrients.
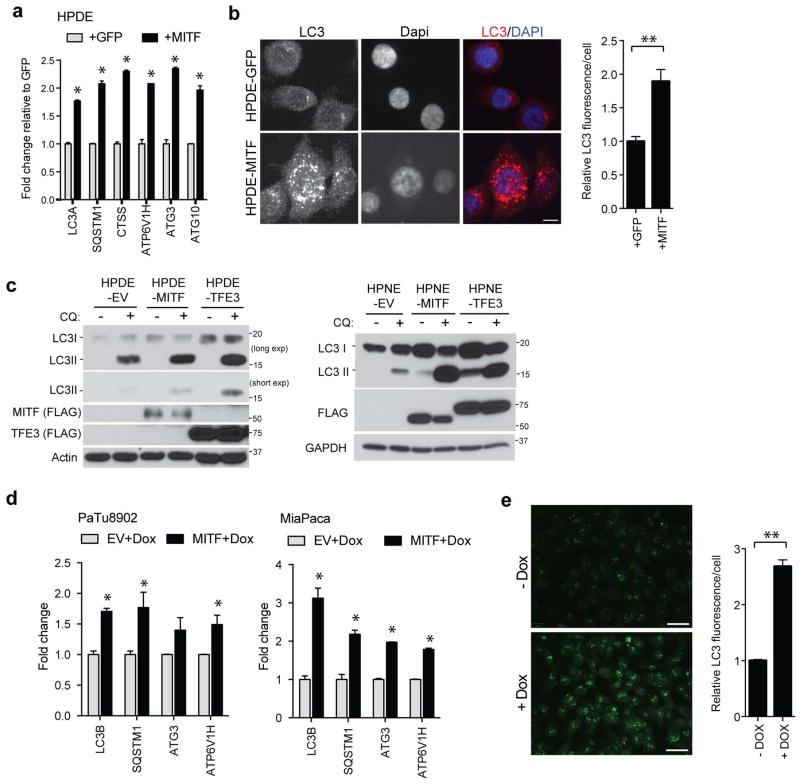
MITF or TFE3 overexpression in pancreatic cells reinforced these findings, demonstrating induction of autophagy-lysosomal genes, LC3B foci, and lipidated LC3-II that was further enhanced following treatment with chloroquine (CQ), an inhibitor of lysosome acidification, indicating marked augmentation of autophagic flux (Extended Data Figure 6A–E).
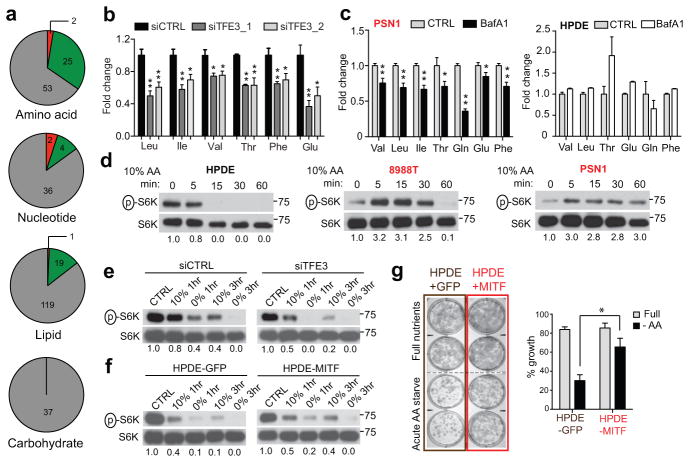
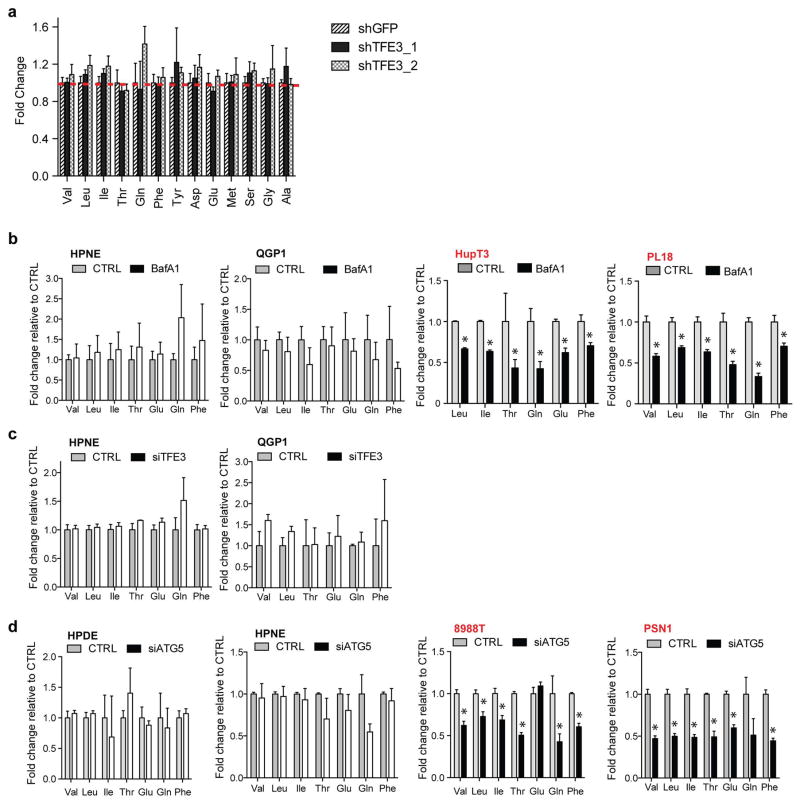
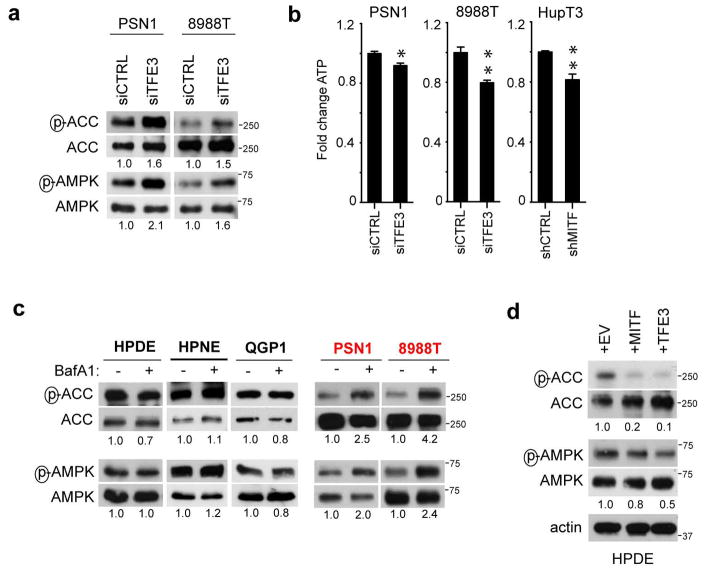
Cargo degraded in the lysosome generates metabolic intermediates that may feed into multiple pathways23,24. To obtain insight into the metabolic outputs of MiT/TFE-controlled autophagy-lysosome function, we conducted global metabolite profiling of 8988T and PSN1 cells transfected with TFE3-targeted siRNAs. These studies revealed statistically significant changes common to both cell lines in 15.2% (53/347) of detected metabolites. Most prominently altered were amino acids (AA) and their breakdown products, with 31% (25/80) showing decreased abundance, whereas only restricted changes were observed in other general metabolite groupings (Fig. 3A; Table S3). TFE3 silencing did not affect AA uptake (Extended Data Figure 7A), suggesting that the autophagy-lysosome system may supply a significant fraction of intracellular AA irrespective of external availability in PDA. In support of this model, TFE3 knockdown, BafA1 treatment, and inactivation of autophagy by ATG5 knockdown significantly decreased intracellular AA levels in PDA cell lines but not in control cells (Fig. 3B, C; Extended Data Figure 7B–D), and led to activation of AMP-activated protein kinase (AMPK) and decreased cellular ATP levels suggesting induction of energy stress (Extended Data Figure 8A–C). Reciprocally, overexpression of MITF or TFE3 in HDPE cells caused downregulation of AMPK signaling (Extended Data Figure 8D).
Figure 3. MiT/TFE factors maintain autolysosome derived pools of amino acids.
a) Global metabolite profiling of 8988T and PSN1 cells following TFE3 knockdown reveals preferential decrease in AA compared to other general metabolite groups (see Methods). (grey: no change, red: increase, green: decrease).
b) Quantification of fold change in AA levels in 8988T cells transfected with siCTRL or siTFE3. * p < 0.03, ** p < 0.003.
c) BafA1 causes a decrease in AA levels in PDA cells (left panel), while AA are unchanged or increased in HPDE cells (right panel); * p < 0.05, ** p < 0.005.
d) Immunoblot for p-p70S6K levels in the indicated cells at sequential times following 10% AA starvation.
e) p-p70S6K immunoblots in 8988T cells transfected with siCTRL or siTFE3 and grown under control conditions or in 0% or 10% AA for the indicated times.
f, g) HPDE-MITF cells show (f) sustained p-p70S6K levels under AA starvation and (g) enhanced colony formation under transient starvation with 10% AA (quantified in the graph).* p < 0.001. For all graphs, error bars indicate mean ± s.d. for N = 3 independent experiments.
These findings suggested that PDA cells should have increased capacity to buffer AA levels under conditions of nutrient deprivation. To test this, we switched cells to low AA concentration (10% of normal) and monitored phosphorylation of p70S6K, a readout of mTORC1 activity that is sensitive to intracellular AA levels25. HPDE cells showed extinction of p-p70S6K within 5–15 min in 10% AA while PDA cells (8988T and PSN1) maintained robust levels for >30 min (Fig. 3D). Correspondingly, TFE3 inactivation in 8988T cells greatly accelerated the decline in p-p70S6K (Fig. 3E). Reciprocally, MITF overexpression in HPDE cells caused p-p70S6K levels to be sustained upon 10% AA starvation, and markedly increased clonogenic growth in this setting while not affecting clonogenicity in full nutrients (Fig. 3F, G, Extended Data Figure. 6A–C). Taken together, these data indicate that PDA cells rely on autophagy-lysosome function for maintenance of intracellular AA pools, which facilitates survival in response to nutrient stress.
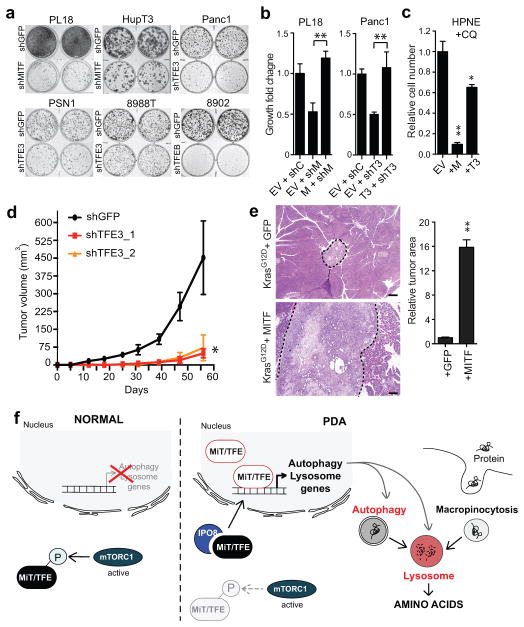
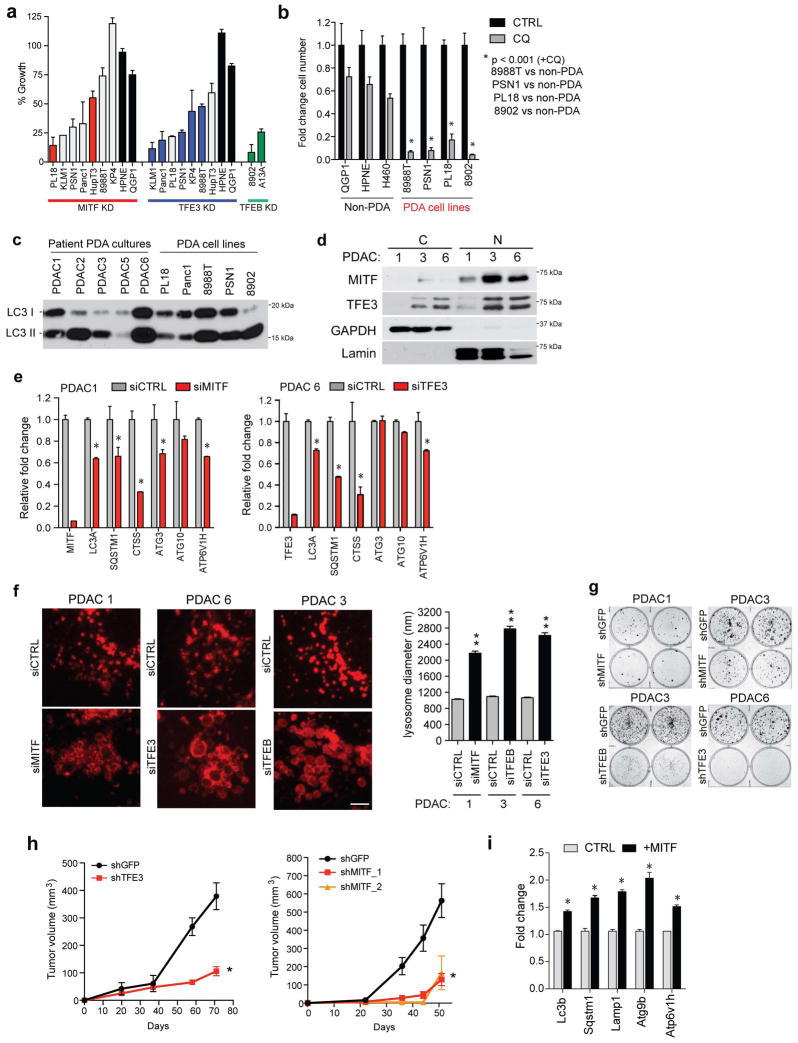
Consistent with key roles of MiT/TFE in organelle function and metabolic regulation, the growth of PDA cell lines expressing high endogenous levels of MITF, TFE3, or TFEB was significantly impaired by knockdown of that factor, an effect rescued by co-expression of shRNA-resistant cDNAs (Fig. 4A, B, Extended Data Figure 9A). By contrast, the growth of HPNE and QGP1 cells was unaffected (Extended Data Figure 9A). As previously reported, PDA cells were broadly sensitive to CQ treatment compared to control cells2 (Extended Data Figure 9B). Moreover, ectopic expression of MITF or TFE3 rendered HPNE cells hypersensitive to CQ, linking MiT/TFE-regulated clearance pathways to these growth phenotypes (Fig. 4C).
Figure 4. MiT/TFE factors are required for PDA growth.
a) Knockdown of the indicated MiT/TFE factors impairs in vitro colony-forming ability in a panel of PDA cell lines.
b) Expression of shRNA-resistant MITF in PL18 cells (left) or TFE3 in Panc1 cells (right) rescues growth following shRNA-mediated knockdown of MITF or TFE3. Error bars indicate mean ± s.d. for N = 3 independent experimets; ** p < 0.001.
c) Forced expression of MITF or TFE3 sensitizes HPNE cells to growth inhibition by CQ. Error bars indicate mean ± s.d. for N = 3 independent experiments; * p < 0.005, ** p < 0.0001.
d) TFE3 knockdown with two independent shRNAs significantly impairs subcutaneous xenograft growth of Panc1 cells. Error bars indicate mean ± s.e.m. for N = 6 tumors/group; * p < 0.03.
e) MITF overexpression in KrasG12D mouse PanIN cells promotes tumorigenesis upon orthotopic injection. N = 5 mice per group; ** p < 0.001. Scale bar = 200 μm.
f) In PDA, the MiT/TFE factors are upregulated and exhibit increased nuclear residence due to IPO8/IPO7-mediated trafficking, leading to transcriptional induction of autophagy-lysosome genes and increased biogenesis and function of these organelles. Autophagy-lysosome expansion integrates two major pathways for nutrient scavenging and metabolic adaption in PDA, autophagy and digestion of serum proteins obtained by macropinocytosis.
To extend our findings in primary patient-derived samples, we examined a series of early passage PDA cultures. Importantly, these cells also showed high basal autophagy, nuclear-localized MiT/TFE proteins, and MiT/TFE-dependent autophagy-lysosome gene expression, organelle function, and colony forming ability (Extended Data Figure 9C–G).
Significantly, knockdown of TFE3 and MITF virtually abolished xenograft tumor growth of Panc1 and 8988T cells, and PL18 cells, respectively (Fig. 4D, Extended Figure 9H). Conversely, MITF overexpression enhanced the tumorigenicity of primary KrasG12D-expressing mouse pancreatic epithelial cells. Whereas KrasG12D control cells formed only focal low-grade PanIN-like lesions by six weeks following orthotopic injection, co-expression of MITF resulted in large invasive tumors in 3/5 mice (Fig. 4E, Extended Data Figure 9I). Thus, in keeping with their requirement for augmenting autophagy-lysosome function, MiT/TFE factors are potent drivers of PDA pathogenesis in vivo.
In summary, our work places a new focus on lysosome regulation by MiT/TFE proteins as a nexus for metabolic reprogramming in PDA cells. Increased lysosome activity integrates major routes for nutrient scavenging—autophagy and macropinocytosis, thereby maintaining intracellular AA availability (Fig. 4I). Escape of MiT/TFE factors from inhibition by mTORC1 enables cancer cells to maintain robust activation of anabolic pathways while simultaneously benefiting from the metabolic fine-tuning and adaptation to stress afforded by activation of autophagy and lysosomal catabolism. Thus, we propose that lysosome activation under the control of the MiT/TFE transcriptional program is a novel hallmark of PDA. These findings, together with recent work26–28, suggest that targeting aberrant lysosomal function has potential therapeutic benefit in cancer.
Supplementary Materials and Methods
Materials
Reagents were obtained from the following sources: antibodies against MITF (sc-71587) from Santa Cruz Biotechnology; GAPDH (MAB374) from Millipore; TFE3 from Cell Marque (MRQ-37; 354R-14)); LAMP2 (ab-25631) from Abcam; TFEB (4240), LC3B (3868), phospho-T389 S6K1 (9234), S6K1 (2708), phospho-AMPK (Thr 172) (2535), AMPK (2603), phospho-ACC (Ser 79) (3661), ACC (3676), Lamin (2032), mTOR (2893) and the FLAG epitope (2368) from Cell Signaling Technology; IPO8 (NBP2-24751) and LC3II (NB600-1384) from Novus Biologicals; CTSS (HPA002988), ATP6V1H (HPA023421) and ULK2 (HPA009027) from Sigma Aldrich; FLAG M2 affinity gel, amino acids from Sigma Aldrich; RPMI, DMEM, fetal bovine serum (FBS) and dialyzed FBS (dFBS), Alexa 488 and 568-conjugated secondary antibodies; 70KDa Dextran-Oregon Green 514, DQ-Green-BSA from Invitrogen; amino acid free RMPI from US Biologicals; Bafilomycin A1 from Tocris.
Cell Culture
Cell lines were obtained from the American Type Culture Collection. Patient-derived PDA cultures were generated at Massachusetts General Hospital (MGH). Informed consent was obtained from all subjects. STR profiling was performed for all cell lines by the MGH Center for Molecular Therapeutics). Primary human samples and PDA cell lines were generated from ascites fluid under IRB approved protocols 02–240 and 2007P001918 (see also Supplemental Table S4). All lines used had verified activating KRAS mutations. Cells were cultured in the following media: 8988T, Panc1, PL18, PSN1, 8902, in DMEM supplemented with 10% FBS; HupT3, KLM1 in RPMI with 10% FBS; HPDE cells were cultured as described previously30. Negative mycoplasma contamination status of all cell lines and primary cells used in the study was established using LookOut Mycoplasma PCR Kit (Sigma, MP0035).
Constructs
N-terminal FLAG tagged human MITF-H isoform expression constructs were generated by subcloning the cDNA of MITF-H (Origene) into the NheI and EcoRI sites of the pLJM1 (Addgene) lentiviral vector, the NotI and EcoRI sites of the pRetroX-Tight-Pur (Clonetech) Doxycycline inducible vector or the EcoRI and SalI sites of the pBabe-puro retroviral vector. Dominant negative MITF-H isoform lacking the 5′ transactivation domain was generated as previously described for the MITF-M isoform 31. Briefly, the first 280 aa corresponding to 840 bp was deleted followed by deletion of R301 (corresponding to R218 of MITF-M). This cDNA was cloned into the NheI and EcoR1 sites of pLJM1. N-terminal FLAG tagged full length human TFE3 expression constructs were generated by subcloning the cDNA of TFE3 from pcDNA3.1-(HA)2-TFE3 (obtained from Dr. David Fisher, MGH) into the BamHI and EcoRI sites of the pBabe-puro retroviral vector. GFP tagged MITF and TFE3 were generated by subcloning the cDNA of MITF-H into BglII and SalI sites and TFE3 into HindIII and BamHI sites of the pEGFP-C1 (Clonetech) vector. siRNA resistant expression constructs of MITF and TFE3 were generated via Quick-change site directed mutagenesis (Agilent Technologies). mCherry-GFP-LC3 was a kind gift from Alec Kimmelman (Dana Farber Cancer Institute).
siRNA and lentiviral-mediated shRNA targets
siRNA against MITF, TFE3, TFEB, ATG5 and IPO8 were purchased from Ambion and Thermo Scientific. The RNAi Consortium clone IDs for the shRNAs used in this study are as follows: shMITF: TRCN0000329793 (CGGGAAACTTGATTGATCTTT), TRCN0000019122 (CGTGGACTATATCCGAAAGTT); shTFEB: TRCN0000013108 (CCCACTTTGGTGCTAATAGCT), TRCN0000013109 (CGATGTCCTTGGCTACATCAA). shRNA constructs against human TFE3 were generated by annealing oligonucleotides against human TFE3 (corresponding to the sequence of the siRNA described below) into the AgeI and EcoRI sites of pLKO.1-puro vector. TFE3 target sequences are the following: GCAGCTCCGAATTCAGGAACT; CGCAGGCGATTCAACATTAAC; GGAATCTGCTTGATGTGTACA.
Cell proliferation and colony formation assay
Cells were plated in 12-well plates at 30,000 cells per well in 2 mL of complete culture media or in 6-well plates at 2,000 cells per well in 2 mL of media. At the indicated time points, cells were trypsinized and counted. Colony plates were fixed 7 days post-plating in 4% paraformaldehyde and stained with 0.1% crystal violet.
Amino acid starvation and Bafilomycin A1 treatment
10% AA starvation was conducted by incubating cells in AA free RMPI supplemented with 10 mM glucose, and 10% AA calculated relative to levels present in RPMI media. Stock solutions of AA were made from individual powders. Where BafA1 treatment was performed, cells were incubated with 150 nM BafA1. Acute AA starvation during colony formation was conducted by incubating cells in AA free media for 18 hrs on day 2 post-plating. Media was then changed to complete growth media for an additional 6 days of cell growth.
SDS-PAGE analysis
Cells were lysed in ice-cold lysis buffer (150 mM NaCl, 20 mM Tris (pH 7.5), 1mM EDTA, 1mM EGTA, 1% Triton X-100, 2.5 mM sodium pryophosphate, 1mM β-glycerophosphate, 1 mM sodium vanadate, and one tablet of EDTA-free protease inhibitors [Roche] per 10 ml). Samples were clarified by centrifugation and protein content measured using BCA protein assay kit (Thermo Scientific). 30 mg protein was resolved on 9% SDS-PAGE gels and transferred onto PVDF membranes (GE Healthcare Life Sciences, Pittsburgh, PA). Membranes were blocked in Tris-buffered saline (TBS) containing 5% non-fat dry milk and 0.1% Tween 20 (TBS-T), prior to incubation with primary antibody overnight at 4°C. The membranes were then washed with TBS-T followed by exposure to the appropriate horseradish peroxidase-conjugated secondary antibody for 45 min and visualized on Kodak X-ray film using the enhanced chemiluminescence (ECL) detection system (Thermo Scientific). Subcellular fractionation was performed using the Thermo Scientific NE-PER nuclear and cytoplasmic fractionation kit according to manufactures procedures. For immunoprecipitation experiments, 1–3 μg of clarified protein lysate from cell lines stably expressing FLAG tagged MiT/TFE proteins was captured on anti-FLAG antibody conjugated protein A-agarose beads (M2-FLAG affinity gel; Sigma Aldrich). Immune complexes were washed and analyzed via SDS-PAGE and western blotting. Immunoglobulin G antibody was used as a control.
Metabolite extraction
Samples were extracted while cells were in the exponential growth phase. Wells were washed with 1XPBS and aspirated. 600μL of −80°C MeOH:H2O (50:50) was added to each well and the plate was then placed at −80°C for 1–1.5hr. As plates were thawing on ice, cells were detached by scraping and transferred to a 1.5mL tube and placed on dry ice. Samples were vortexed at 4°C for 30 seconds. To clarify homogenates, samples were centrifuged at 20K x g, for 7 minutes at 4°C. Clarified supernatants were transferred to new 1.5mL tubes. 600μL of Choloroform (stabilized with amylene) was added to each sample, one at a time, and the sample was immediately vortexed at RT for 30 seconds, and then placed on ice. Phase separation was achieved by centrifugation at 20K x g, for 0.25hr at 4°C. The aqueous (polar) phase was extracted and transferred to a fresh 1.5mL tube. The samples were evaporated by SpeedVac, snap frozen in liquid nitrogen, and stored at −80° for further processing.
Derivatization (all samples)
Evaporated samples were warmed to RT by quickly spinning them in a SpeedVac. Samples were dissolved in 30μl of 2% methoxyamine hydrochloride in pyridine (MOX) (Pierce) at 37°C for 1.5 hrs. Samples were derivatized by adding 45μl of N-methyl-N-(tert-butyldimethylsilyl)trifluoroacetamide (MBTSTFA) + 1% tert-butyldimethylchlorosilane (TBDMCS; Pierce) at 60°C for 1 hr.
GC-MS/MS analysis
GC-MS analysis was performed as described 32,33. Briefly, analysis was performed on an Agilent 6890 GC instrument that contained a 30m DB-35MS capillary column, which was interfaced to an Agilent 5975B MS. Electron impact (EI) ionization was set at 70 eV. Each analysis was operated in scanning mode, recording mass-to-charge-ratio spectra in the range of 100 – 605 m/z. For each sample 1μl was injected at 270°C, using helium as the carrier gas at a flow rate of 1 ml/min. To mobilize metabolites, the GC oven temperature was held at 100°C for 3 min and increased to 300°C at 3.5°C/min. Samples were analyzed in triplicate. Metabolite levels where normalized to cell number and/or protein and plotted as fold change relative to control conditions.
Immunofluorescence assays
Cells were plated on fibronectin-coated glass coverslips at 100,000–300,000 cells/coverslip. 12–16 hours later, the slides were rinsed with PBS once and fixed for 15 min with 4% paraformaldehyde at RT or for 5min with −20 °C methanol. The slides were rinsed twice with PBS and cells were permeabilized with 0.05% Triton X-100 for 2 min. After rinsing twice with PBS, the slides were incubated with primary antibody in 5% normal goat serum for 1 hr at room temperature, rinsed four times with PBS, and incubated with secondary antibodies produced in goat (diluted 1:400 in 5% normal goat serum) for 45 min at room temperature in the dark. Slides were mounted on glass slides using Vectashield (Vector Laboratories) and imaged on a spinning disk confocal system (Perkin Elmer) or a Zeiss Laser Scanning Microscope (LSM) 710. Images were processed using ImageJ and Adobe PhotoshopCS4. For quantification of lysosome diameter, ImageJ software was used to draw lines across 130 – 290 lysosomes from 3–5 fields containing 4–6 cells/field. Line pixel values were converted into μm based on objective magnification and camera pixel size. Presented data are representative of 3–5 replicate experiments. DQ-BSA experiments were performed as previously described34. Briefly, cells were incubated with DQ-BSA for 30 min and subsequently chased for 1hr in DQ-BSA free media. Were indicated, treatment with BafA1 was for 1 hr at 100 nM. The number of DQ-BSA spots co-localizing with LAMP2 positive lysosomes was counted. Measurement of autolysosome maturation was performed in cells transfected with the mCherry-GFP-LC3 reporter. Cells were transfected with siCTRL or siMITF/siTFE3 and 48 hrs later transfected with the mCherry-GFP-LC3. After 24 hrs cells were fixed in 4% PFA and quantification of total number of autolysosomes (mCherry+/GFP− spots) compared to total spots/cell (N > 1000 total spots from N = 10 cells/condition) for at least 3 independent experiments was counted.
Histology and immunostaining
Tissue samples were fixed overnight in 4% buffered formaldehyde, and then embedded in paraffin and sectioned (5 mm thickness) by the DF/HCC Research Pathology Core. Haematoxylin and eosin staining was performed using standard methods. For immunohistochemistry, unstained slides were baked at 55 °C overnight, deparaffinized in xylenes (two treatments, 6 min each), rehydrated sequentially in ethanol (5 min in 100%, 3 min in 95%, 3 min in 75%, and 3 minin 40%), and washed for 5 min in 0.3%Triton X-100/PBS (PBST) and 3min in water. For antigen unmasking, specimens were cooked in a 2100 Antigen Retriever (Aptum Biologics) in 1xAntigen Unmasking Solution, Citric Acid Based (H-3300, Vector Laboratories), rinsed three times with PBST, incubated for 10 min with 1% H2O2 at room temperature to block endogenous peroxidase activity, washed three times with PBST, and blocked with5%goat serum in PBST for 1 h. Primary antibodies were diluted in blocking solution as follows: anti-TFE3 (Cell marque, 354R-14) 1:100; anti-CTSS (Sigma, HPA002988) 1:200; anti-ATP6V1H (Sigma, HPA023421) 1:100; anti-ULK2 (Sigma, HPA009027) 1:100, and incubated with the tissue sections at 4 °C overnight. The evaluation of MITF and TFEB protein levels in patient PDA tissue could not be evaluated due to lack of antibodies suitable for IHC. Commercially available MITF antibodies for IHC are specific to the melanoma (MITF-M) isoform or cross-react with other MiT/TFE family members. Specimens were then washed three times for 3 min each in PBST and incubated with biotinylated secondary antibody (Vector Laboratories) in blocking solution for 1 h at room temperature. Specimens were then washed three times in PBST and treated with ABC reagent (Vectastain ABC kit #PK-6100) for 30 min, followed by three washes for 3 min each. Finally, slides were stained for peroxidase for 3 min with the DAB(di-aminebenzidine) substrate kit (SK-4100, Vector Laboratories), washed with water and counterstained with haematoxylin. Immunostaining was assessed by semi-quantitative analysis of tissue microarray, quantifying the intensity of stained tumor cells scored on a scale from 0 (no staining) to 3 (strongest intensity). Stained slides were photographed with an OlympusDP72 microscope.
Human samples
PDA samples used for IHC and generation of early passage PDA cultures were obtained under IRB approved protocols 02–240 and 2007P001918. The samples for IHC were from patients resected at Massachusetts General Hospital (MGH) between 2001 and 2012. Pathological diagnosis of PDA was confirmed by a gastrointestinal cancer pathologist at MGH (V.D.). Early passage PDA cultures were derived from ascites specimens. Patients were verified to have PDA from biopsies.
Electron Microscopy
For in vitro studies, tissue culture specimens in confluent 6-well or 10-cm plates were fixed directly with gentle rocking for 15 minutes at room temperature with a glutaraldehyde fixative (2.5 % glutaraldehyde, 2% paraformaldehyde, 0.025% calcium chloride, in a 0.1M sodium cacodylate buffer, pH 7.4), gently scraped and pelleted at 500xg, and washed twice with cacodylate buffer. To make a cell block, the cells were centrifuged and resuspended in warm (60°C) 2% agar in a warm water bath to keep the agar fluid. The cells were then centrifuged again and the agar allowed to harden in an ice water bath. The tissue containing tip of the centrifuge tube was cut off resulting in an agar block with the cells embedded within it. This agar block was subsequent routinely processed in a Leica Lynx automatic tissue processor. Briefly, the tissue was post-fixed in osmium tetroxide, stained En Bloc with uranyl acetate, dehydrated in graded ethanol solutions, infiltrated with propylene oxide/Epon mixtures, embedded in pure Epon, and polymerized over night at 60°C. One micron sections were cut, stained with toluidine blue, and examined by light microscopy. Representative areas were chosen for electron microscopic study and the Epon blocks trimmed accordingly. Thin sections were cut with an LKB 8801 ultramicrotome and diamond knife, stained with lead citrate, and examined in a FEI Morgagni transmission electron microscope. Images were captured with an AMT digital CCD camera.
For analysis of human tissue, fresh biopsy tissue placed into Karnovsky’s KII Solution (2.5% glutaraldehyde, 2.0% paraformaldehyde, 0.025% calcium chloride, in a 0.1M sodium cacodylate buffer, pH 7.4), fixed overnight at 4°C, and stored in cold buffer. Subsequently, they were post-fixed in osmium tetroxide, stained En Bloc with uranyl acetate, dehydrated in graded ethanol solutions, infiltrated with propylene oxide/Epon mixtures, flat embedded in pure Epon, and polymerized over night at 60°C. One micron sections were cut, stained with toluidine blue, and examined by light microscopy. Representative areas were chosen for electron microscopic study and the Epon blocks were trimmed accordingly. Thin sections were cut with an LKB 8801 ultramicrotome and diamond knife, stained with Sato’s lead, and examined in a FEI Morgagni transmission electron microscope. Images were captured with a AMT (Advanced Microscopy Techniques) 2K digital CCD camera.
Measurement of lysosomal pH
Determination of lysosomal pH was carried out on intact cells by ratiometric imaging of the pH-sensitive dye Oregon Green 514, as described35,36. 8988T cells were transfected with control siRNA or TFE3 siRNA. One day before the experiment, 80,000 cells were plated in black 96-multiwell plates in low serum and low glucose media. On the day of the experiment, cells were fed 30 μg/ml 70KDa Dextran conjugated to Oregon Green 514 (Dx-OG514, Invitrogen) for 6 hrs in full media. Cells were rinsed 3 times to remove excess dye, and chased for 2 hrs in media free of Dx-OG514, which results in the selective accumulation of Dx-OG514 in lysosomes. Dx-OG514 fluorescence was collected at 530 nm upon excitation at 440nm and 490nm in a Spectramax microplate reader (Molecular Devices). The 490/440 fluorescence emission ratios were interpolated to a calibration curve. The calibration curve was built by bathing cells in a K+ isotonic solution (145 mM KCl, 10 mM glucose, 1 mM MgCl2, and 20 mM of either HEPES, MES, or acetate) buffered to pH ranging from 3.5 to 7.0 and containing 10 μg/ml Nigericin. The 490/440 ratios were plotted as a function of pH, and fitted to a Boltzmann sigmoid. All measurements were performed in quadruplicate. Presented data are representative of 3 replicate experiments.
Quantitative RT-PCR
Total cellular RNA was extracted using RNeasy Mini Kit (Qiagen, Valencia, CA) and reverse transcription was performed from 2 μg of total RNA using the QuantiTect Reverse Transcription Kit (Qiagen). Quantitative RT-PCR was performed with FastStart Universal SYBR Green (Roche) in a MX3005P continuous fluorescence detector (Stratagene) or using a Lightcycler 480 (Roche). PCR reactions were performed in triplicate and the relative amount of cDNA was calculated by the comparative CT method using the 18S ribosomal RNA sequences as a control. Primer sequences are available upon request. MITF isoform specific PCR was conducted as previously described 37.
Chromatin Immunoprecipitation (ChIP)
ChIP experiments were conducted using the Chromatin Immunoprecipitation assay kit (Millipore) according to manufacturer’s instructions. Briefly, 106 cells expressing FLAG-tagged MITF or TFE3 were fixed with 1% formaldehyde for 10 minutes (for FLAG-MITF experiments, cells were fixed 48 hrs post Doxycycline treatment). Cells were washed twice with ice-cold PBS and lysed in ice-cold SDS lysis buffer containing protease inhibitors (Roche). Chromatin extraction and DNA sonication were conducted according to manufacturer’s protocol. DNA was recovered from immune complexes on M2-FLAG affinity gel. The immuno-precipitated DNA was recovered and analyzed by real-time PCR. ChIP primers have been previously described 38.
Xenograft studies
Mice were housed in pathogen-free animal facilities. All experiments were conducted under protocol 2005N000148 approved by the Subcommittee on Research Animal Care at Massachusetts General Hospital. For subcutaneous xenografts, Panc1 ,8988T or PL18 cells were infected with lentiviral shRNAs targeting TFE3 (n=2), MITF (n=2) and GFP (control hairpin, n=1) and subjected to a puromycin selection (2 μg/mL) in vitro. 1.5 – 2.5 × 10⁶ cells, suspended in a 1:1 mixture of Hanks Buffered Saline Solution (HBSS):matrigel, were injected subcutaneously into the lower flank of 3–4 female NOD.CB17-Prkdcscid/J mice per group (6–10 weeks of age) (purchase from Jackson Laboratories, strain #001303). Tumor length and width were measured weekly and the volume was calculated according to the formula (length × width2)/2. All xenograft experiments with human PDA lines were approved by the HMS Institutional Animal Care and Use Committee (IACUC) under protocol number 04–605. For orthotopic mouse studies, MITF or GFP was stably expressed in mouse PanIN primary cells39. Alternatively, a doxycycline-inducible expression construct for MITF was also stably expressed in mouse PanIN primary cells. 1 × 10⁶ cells were orthotopically injected in a 1:1 mixture of matrigel:PBS into the pancreas of SCID mice (n = 5/group). Mice were euthanized 2 months post implantation, pancreas were harvested and submitted for histological examination. No mice were excluded from the analysis. Experiments were designed to detect a 50% change in tumor size with 80% power and a type I error of 5% using the T-test.
Image analysis and Statistics
Image analysis, including densitometry and measurement of fluorescence intensity, was conducted using Image J software (NIH). Statistical analyses of results are expressed as mean ± standard deviation, unless otherwise specified. Significance was analyzed using 2-tailed Student’s t test. A p value of less than 0.05 was considered statistically significant.
Gene expression profiling and gene-set enrichment analysis
To build a comprehensive autophagy-lysosome gene signature (geneset) we combined published lysosome proteomics40,41 and autophagy interactome datasets 42 together with known lysosomal disease associated genes43 (see Table S1). Datasets used for the meta-analysis in Fig 1C, F, and S1B and C are accessible from GEO (http://www.ncbi.nlm.nih.gov/gds/) including GSE16515, GSE28735, and GSE15471, from TCGA (http://cancergenome.nih.gov/), from CCLE (http://www.broadinstitute.org/software/cprg/?q=node/11). For the GEO and CCLE data sets, raw expression values in the form of CEL files were collected and then processed using RMA in the R bioconductor package. For TCGA data, expression data sets were created by combining RNASeqV2 Level3 normalized gene result files for individual samples and producing tables with genes in rows and samples in columns. Data for the 8988T cells of Figure 1G, H was processed using a standard RNA-seq pipeline that used Trimmomatic to clip and trim the reads, used tophat2 to align the reads to hg19, and used cuffdiff to calculate differential expression. Gene Set Enrichment Analysis (GSEA) (http://www.broadinstitute.org/gsea/index.jsp) of the expression data was used to assess enrichment of the autophagy-lysosome gene signature. Depending upon the data set, there were several different methods used to rank genes for GSEA: In the PDA samples for Figures 1F and S1 J, I, genes were ranked according to Pearson correlation with a meta-gene formed by the mean expression of MITF, TFE3, and TFEB and p-values were obtained by permuting the phenotype (2500 permutations). In the 8988T cells of Figure 1G, H, a pairwise GSEA was performed by creating ranked lists of genes using the log2 ratio of shTFE3 to shControl and p-values were obtained by permuting the gene set (1000 permutations). In the paired tumor / normal PDA data sets of Figure S1B, a paired t-test between matched tumor normal samples was used to rank genes and the ranked list was used in GSEA with p-values from permuting the gene set (2500 permutations). For Figure S1K, DAVID analysis of PDA cell lines in CCLE was performed as described13 by using Pearson correlation to select the 100 genes most correlated with TFE3 and MITF and checking for enriched pathways.
Quantitative proteomics on TFE3 associated proteins
Enriched proteins were subjected to multiplexed quantitative proteomics analysis using tandem-mass tag (TMT) reagents on an Orbitrap Fusion mass spectrometer (Thermo Scientific). Disulfide bonds were reduced with ditheiothreitol (DTT) and free thiols alkylated with iodoacetamide as described previously44. Proteins were then precipitated with tricholoracetic acid, resuspended in 50 mM HEPES (pH 8.5) and 1 M urea and digested first with endoproteinase Lys-C (Wako) for 17 hours at room temperature and then with sequencing-grade trypsin (Promega) for 6 hours at 37 °C. Peptides were desalted over Sep-Pak C18 solid-phase extraction (SPE) cartridges (Waters), the peptide concentration was determined using a BCA assay (Thermo Scientific) and a maximum of 50 μg of peptides were labeled with one out of the available TMT-10plex reagents (Thermo Scientific)45. To achieve this, peptides were dried and resuspended in 50 μl of 200 mM HEPES (pH 8.5) and 30 % acetonitrile (ACN) and 10 μg of the TMT in reagent in 5 μl of anhydrous ACN was added to the solution, which was incubated at room temperature (RT) for one hour. The reaction was then quenched by adding 6 μl of 5 % (w/v) hydroxylamine in 200 mM HEPES (pH 8.5) and incubation for 15 min at RT. The solutions were acidified by adding 50 μl of 1 % trifluoroacetic acid (TFA) and samples that were quantified in one mass spectrometry measurement were pooled before being subjected to desalting over a Sep-Pak C18 (SPE) cartridge. The peptide mixtures was then dried and resuspended in 8 μl, 3 of which were analyzed by microcapillary liquid chromatography tandem mass spectrometry on an Orbitrap Fusion mass spectrometer and using a recently introduced multistage (MS3) method to provide highly accurate quantification44,45.
The mass spectrometer was equipped with an EASY-nLC 1000 integrated autosampler and HPLC pump system. Peptides were separated over a 100 μm inner diameter microcapillary column in-house packed with first 0.5 cm of Magic C4 resin (5 μm, 100 Å, Michrom Bioresources), then with 0.5 cm of Maccel C18 resin (3 μm, 200 Å, Nest Group) and 29 cm of GP-C18 resin (1.8 μm, 120 Å, Sepax Technologies). Peptides were eluted applying a gradient of 8–27 % ACN in 0.125 % formic acid over 165 min at a flow rate of 300 nl/min. To identify and quantify the TMT-labeled peptides we applied a synchronous precursor selection MS3 method44–46 in a data dependent mode. The scan sequence was started with the acquisition of a full MS or MS1 one spectrum acquired in the Orbitrap (m/z range, 500–1200; resolution, 60,000; AGC target, 5×10⁵; maximum injection time, 100 ms), and the ten most intense peptide ions from detected in the full MS spectrum were then subjected to MS2 and MS3 analysis, while the acquisition time was optimized in an automated fashion (Top Speed, 5 sec). MS2 scans were done in the linear ion trap using the following settings: quadrupole isolation at an isolation width of 0.5 Th; fragmentation method, CID; AGC target, 1×10⁴; maximum injection time, 35 ms; normalized collision energy, 30 %). Using synchronous precursor selection the 10 most abundant fragment ions were selected for the MS3 experiment following each MS2 scan. The fragment ions were further fragmented using the HCD fragmentation (normalized collision energy, 50 %) and the MS3 spectrum was acquired in the Orbitrap (resolution, 60,000; AGC target, 5×10⁴; maximum injection time, 250 ms).
Data analysis was performed on an on an in-house generated SEQUEST-based47 software platform. RAW files were converted into the mzXML format using a modified version of ReAdW.exe. MS2 spectra were searched against a protein sequence database containing all protein sequences in the human UniProt database (downloaded 02/04/2014) as well as that of known contaminants such as porcine trypsin. This target component of the database was followed by a decoy component containing the same protein sequences but in flipped (or reversed) order48. MS2 spectra were matched against peptide sequences with both termini consistent with trypsin specificity and allowing two missed trypsin cleavages. The precursor ion m/z tolerance was set to 50 ppm, TMT tags on the N-terminus and on lysine residues (229.162932 Da) as well as carbamidomethylation (57.021464 Da) on cysteine residues were set as static modification, and oxidation (15.994915 Da) of methionines as variable modification. Using the target-decoy database search strategy48 a spectra assignment false discovery rate of less than 1 % was achieved through using linear discriminant analysis with a single discriminant score calculated from the following SEQUEST search score and peptide sequence properties: mass deviation, XCorr, dCn, number of missed trypsin cleavages, and peptide length49. The probability of a peptide assignment to be correct was calculated using a posterior error histogram and the probabilities for all peptides assigned to a protein were combined to filter the data set for a protein FDR of less than 1 %. Peptides with sequences that were contained in more than one protein sequence from the UniProt database were assigned to the protein with most matching peptides49.
TMT reporter ion intensities were extracted as that of the most intense ion within a 0.03 Th window around the predicted reporter ion intensities in the collected MS3 spectra. Only MS3 with an average signal-to-noise value of larger than 28 per reporter ion as well as with an isolation specificity44 of larger than 0.75 were considered for quantification. Reporter ions from all peptides assigned to a protein were summed to define the protein intensity. A two-step normalization of the protein TMT-intensities was performed by first normalizing the protein intensities over all acquired TMT channels for each protein based to the median average protein intensity calculated for all proteins. To correct for slight mixing errors of the peptide mixture from each sample a median of the normalized intensities was calculated from all protein intensities in each TMT channel and the protein intensities were normalized to the median value of these median intensities.
Extended Data
Extended Data Figure 1. Tumor-specific expression and constitutive activation of MiT/TFE factors in PDA.
a) Immunofluorescence staining of autophagosomes (LC3) and lysosomes (LAMP2) showing extensive overlap of these organelles and increased LC3 immunofluorescence in PDA cell lines (graph at right; error bars indicate mean ± s.e.m for N = 3 independent experiments with at least 130 cells scored). Scale bar = 11 μm. b) GSEA of different human PDA datasets for enrichment of the autophagy-lysosome gene signature in tumor versus normal tissue (GEO accession numbers indicated). c) Mean expression (RPKM; reads per kilobase per million) of TFE3, MITF, and TFEB individually or cumulatively as a meta-gene formed by the mean of the three transcription factors (3TF) in primary tumor specimens from the indicated malignancies (TCGA dataset). d) TFE3 and MITF antibody validation by western blotting in cells treated with the indicated siRNA. TFE3 antibody IHC validation using alveolar soft part sarcoma (ASPS) tissue. This antibody (MRQ-37, Cell Marque) is used as a clinical diagnostic for ASPS. Scale Bar = 100 μm (top), 20 μm (bottom). e) Gene expression analysis showing upregulation of MiT/TFE genes in subsets of PDA relative to normal pancreatic ductal tissue. SAGE data29 from normal microdissected pancreatic ductal cells (normal microdissected control; black box, HPDE; grey box), cultured PDA cells (cell line), and PDA xenografts and primary tumor tissues (tumor). f) qRT-PCR analysis of MiT/TFE expression levels in a panel of human PDA cell lines. Note that PL18 and HupT3 preferentially express high levels of MITF, while 8988T, PSN1 and Panc1 express TFE3 at higher levels. The highest levels of TFEB were detected in 8902 and A13A cells. g) RT-PCR analysis reveals that PDA cells express distinct MITF isoforms. Note the complete absence of all MITF isoforms in normal HPDE cells. PDA cells lack the melanoma-specific M isoform (detected in M14 melanoma cells, lane 2). h) MITF, TFE3 and TFEB protein levels in a panel of non-PDA cell lines, patient-derived PDA cultures and PDA cell lines. i) GSEA analysis showing correlation between expression of MiT/TFE factors and autophagy-lysosome gene set in primary human PDA specimens (TCGA dataset). j) GSEA analysis showing correlation between cumulative expression of MiT/TFE factors (see Methods) and the autophagy-lysosome gene set in human PDA cell lines (CCLE dataset). k) DAVID analysis of gene sets correlating with increasing expression of TFE3 (left) or MITF (right) in human PDA cell lines (CCLE dataset).
Extended Data Figure 2. MiT/TFE-dependent regulation of autophagy-lysosome gene expression in PDA cell lines.
a) Chromatin immunoprecipitation analysis of FLAG-MITF (left) and FLAG-TFE3 (right) binding to autophagy-lysosome genes in 8902 and Panc1 cells, respectively. Histograms show the amount of immunoprecipitated DNA detected by qPCR normalized to input and plotted as relative enrichment over mock control. Error bars indicate mean ± s.e.m for N = 3 independent experiments. * p < 0.05. b) siRNA mediated knockdown of MITF in HupT3 and PL18 cells causes a decrease in autophagy-lysosome gene expression, assayed 48 hrs post siRNA transfection. * p < 0.05. c) Knockdown of TFE3 in PSN1, Panc1 and 8988T cells, or of TFEB in 8902 cells, causes a decrease in autophagy-lysosome gene expression. * p < 0.05. d) HPDE, HPNE, and QGP1 control cells show minimal changes in autophagy-lysosome gene expression upon knockdown of the MiT/TFE genes. e) Decreased autophagy-lysosome gene expression following MITF knockdown (left; PL18 cells; * p < 0.05) or TFE3 knockdown (right; 8988T cells; * p < 0.01) is rescued by transient ectopic expression of MITF or TFE3. Cells were transfected with expression constructs for MITF or TFE3 24 hrs post-siRNA transfection. After 48 hrs, gene expression was assayed. f) Expression of MITF-DN in HupT3 cells causes a decrease in autophagy-lysosome gene expression compared to control cells (left panel; * p < 0.02). Similar results are seen in PSN1 cells expressing Doxycycline (Dox)-inducible MITF-DN upon addition of 1 μg/ml of Dox for 48 hrs (right panel; * p < 0.05). For all graphs error bars indicate mean ± s.d. for N = 3 independent experiments.
Extended Data Figure 3. MiT/TFE transcription factors escape mTOR-mediated cytoplasmic retention in PDA.
a) Subcellular localization of ectopically expressed GFP-TFEB in HPDE cells under full nutrient and starvation conditions (3 hrs HBSS) (left) and Torin1 dependent nuclear localization of ectopically expressed FLAG-MITF (left) or FLAG-TFE3 (right) in HPNE cells (right). b) Subcellular localization of ectopically expressed GFP-MITF (left panels) or GFP-TFE3 (right panels) in HupT3 and 8988T cells respectively under full nutrient and starvation conditions (3 hrs HBSS). c–d) Subcellular fractionation studies showing that endogenous TFE3 (c) and MITF (d) are constitutively nuclear localized in PDA cell lines. e) Immunofluorescence staining of endogenous TFEB in A13A and 8902 PDA cells. Note the predominant nuclear localization under both full nutrient (FED) and starved conditions. f) Subcellular fractionation of PL18 and HupT3 PDA cells under full nutrient, amino acid (AA) starved and AA re-fed conditions shows constitutive nuclear residence of endogenous MITF regardless of the nutrient status of the cells. Lamin = nuclear fraction; GAPDH = cytoplasmic fraction. g) Subcellular fractionation of Panc1 cells and a primary patient-derived culture (PDAC1) showing constitutive nuclear localization of TFE3 (in Panc1) and MITF (in PDAC1) independent of Torin1 treatment. h) Immunoblot for phospho-ERK1/2 in the indicated cell lines treated with vehicle or with the MEK inhibitor, AZD6244 (AZD). i) Neither AZD6244 nor Torin1 affect MITF localization (PL18 cells) or TFE3 localization (8988T cells). j) Immunoblot showing readily detectable phospho-p70S6K in the indicated non-PDA and PDA cell lines, and extinction of phosphorylation upon Torin1 treatment. k) Immunofluorescence showing that AA re-feeding of starved 8988T and Panc1 PDA cells results in mTOR (green) translocation from a diffuse cytoplasmic distribution to the lysosome (LAMP2; red), as indicated by co-localization with LAMP2. Scale bar = 20 μm. l) The indicated non-PDA (left panels) and PDA cell lines (right panels) stably expressing FLAG-tagged TFE3 (F-TFE3) or MITF (F-MITF) were treated with vehicle or Torin1. Cells were then lysed, subjected to FLAG immunoprecipitation and immunoblotted for FLAG and 14-3-3. Note that in all cell lines, 14-3-3 is detected in the anti-FLAG immunoprecipitates and binding is lost upon Torin1 treatment. All images shown are representative of at least N = 3 independent experiments.
Extended Data Figure 4. IPO8 drives increased MiT/TFE nuclear import in PDA cells.
a) Identification of IPO8 as a PDA-specific binding partner of TFE3. HPDE (left panel), PSN1 (middle panel) and 8988T cells (right panel) stably expressing FLAG-TFE3 or control vector were subjected to affinity purification, followed by multiplexed quantitative proteomics analysis using tandem-mass tag (TMT) reagents. The graphs show normalized protein intensities in the FLAG-TFE3 and control samples. Note the specific enrichment of IPO8 in the FLAG-TFE3-expressing PDA cell lines. In HPDE cells, IPO8 did not score as a significantly enriched interactor (mean log2 ratio flag-TFE3/control = −0.14 (N = 3), p = 0.30 (paired two-tailed t-test), while in PSN1 and 8988T IPO8 was significantly enriched in TFE3 immunoprecipitates (mean log2 ratio flag-TFE3/control = 4.35 (N = 3), p = 0.015 (PSN1) and mean log2 ratio flag-TFE3/control = 1.70 (N = 3), p = 0.002 (8988T)). b) Immunoprecipitation of endogenous IPO8 with FLAG-TFE3 in a PDA cell line (PSN1) and primary PDA culture (PDAC3). c) qRT-PCR showing increased expression of IPO8 in PDAC cell lines and primary patient-derived cultures (red bars) compared to control pancreatic ductal cells (HPDE and HPNE, black bars). d) quantification of IPO8 immunohistochemistry staining intensity (0 = no staining to 3 = high staining) in normal (N = 11) and PDA (N = 110) patient samples. e) Subcellular fractionation and immunoblot analyses of the indicated cell lines transfected with control siRNA (siCTRL) or siIPO8. Note that siIPO8 leads to a marked decrease in nuclear TFE3 in PDA cells (PSN1 and Panc1) (left panel) and in whole cell lysates (right panel). f) Immunoblot of whole cell lysates showing that IPO8+IPO7 knockdown decreases the levels of MITF and TFEB in PL18 and 8902 cells respectively. g) Knockdown of IPO8 has no effect on total TFE3 protein (left) or mRNA (right) levels in HPDE and HPNE cells. Error bars indicate mean ± s.d. for N = 3 independent experiments. h) Torin1 induced TFE3 nuclear localization in HPNE cells is unaffected by knockdown of IPO8. i) qRT-PCR showing that siRNA-mediated knockdown of IPO8, or of both IPO8 and IPO7, effectively reduces target expression without significantly affecting the expression of TFE3, TFEB or MITF mRNA levels. Error bars indicate mean ± s.d. for N = 3 independent experiments. j) Immunoblot of 8988T cells transfected with control siRNA (siCTRL) or siIPO8 and treated with cycloheximide (CHX) for the indicated time points shows a decrease in steady-state levels and stability of TFE3 upon loss of IPO8. Data are representative of N = 3 independent experiments.
Extended Data Figure 5. Altered lysosome morphology and function following loss of MiT/TFE factors.
a) RNAi-mediated knockdown of MITF in PL18 (right panel; N = 259 siCTRL, N = 263 siMITF) or TFEB in PaTu8902 cells (left panel; N = 273 siCTRL, N = 147 siTFEB) causes aberrant lysosome morphology and an increase in lysosome diameter as visualized by immunofluorescence staining for LAMP2. ** p < 0.001. b) Lysosome size in HPDE cells is not affected by knockdown of MITF (N = 156) and TFE3 (N = 81), and is only slightly increased by TFEB knockdown (N = 198) relative to siCTRL (N = 296). N.S. = not significant. * p < 0.05, Scale bar = 7.5 μm. c) Electron microscopy of 8988T PDA cells transfected with siCTRL (panels 1–5) or siTFE3 (panels 6–10). Note that TFE3 loss causes an accumulation of undigested material shown by asterisks indicating a defect in clearance (graph indicates % lysosomes filled with cargo; N = 80 lysosomes for siCTRL and N = 153 lysosomes for siTFE3) and an increase in average lysosome diameter (quantified in graph on the right; N = 63 lysosomes in siCTRL and N = 68 lysosomes in siTFE3). Scale bar = 1μm. ** p < 0.001 d) Immunofluorescence staining with LC3 (green) and LAMP2 (red) in 8988T cells following siRNA-mediated knockdown of TFE3, shows similar accumulation of undigested LC3-positive aggregates encapsulated within enlarged LAMP2 positive lysosomes (bottom panel) compared to control cells (top panel). Magnifications of the boxed regions are shown (right panels). Scale bar = 7.5 μm.
Extended Data Figure 6. Ectopic MiT/TFE expression in PDA cell lines causes an increase in autophagy-lysosome function.
a, b) Ectopic expression of MITF induces autophagy-lysosome genes in HPDE cells (a), and causes an increased abundance of LC3 puncta (b) as measured by immunoflourescence staining of endogenous LC3 (red) and quantified in the graph on the right. * p < 0.01, ** p < 0.001. Scale bar = 7.5 μm. c) Ectopic expression of FLAG-tagged MITF or TFE3 in HPDE cells (left panel) or HPNE cells (right panel) causes an increase in autophagic flux as measured by the increase in LC3-II versus LC3-I, following treatment with 25 μM Chloroquine (CQ) for 18 hrs. MITF and TFE3 protein expression is represented by immunoblot for FLAG. d) Expression of MITF in 8902 PDA cells (which lack MITF expression) or in MiaPaca cells (which express low levels of all MiT/TFE members) causes an increase in autophagy-lysosome gene expression. * p < 0.05. e) Dox-inducible expression of MITF in MiaPaca cells causes an increase in endogenous LC3 positive puncta, as measured in the graph on the right, indicating increased autophagy induction. N = 68 cells, –Dox; N = 100 cells, +Dox, ** p < 0.001. Scale bar = 15 μm.
Extended Data Figure 7. Role of lysosome in maintaining AA levels in PDA.
a) AA uptake was measured as fold change in extracellular AA in 8988T cells following transfection with 2 siRNA against TFE3 relative to siCTRL. Media was changed 1hr before media samples were harvested for analysis. Data is matched to results presented in Fig 3B. b–d) Effect of BafA1 (b), siTFE3 (c), and siATG5 (d) on intracellular AA levels in the indicate cell lines. Error bars represent mean ± s.d. for N = 3 independent experiments. * p < 0.05.
Extended Data Figure 8. MiT/TFE factors couple amino acid metabolism to energy homeostasis in PDA.
a) Knockdown of TFE3 in PSN1 and 8988T cells causes an increase in p-ACC (Ser 79) and p-AMPK (Thr 172) levels. b) Knockdown of TFE3 (in 8988T and PSN1 cells) or MITF (in HupT3 cells) causes a decrease in cellular ATP levels. N = 3 independent experiments, * p < 0.05, ** p < 0.001. c) BafA1 treatment (150 nM) for 18 hrs induces p-ACC and p-AMPK in PDA cells but not in HPDE, HPNE or QGP1 cells. d) Forced expression of MITF or TFE3 in HPDE cells causes a decrease in p-ACC and p-AMPK levels.
Extended Data Figure 9. Regulation of in vitro and in vivo growth by MiT/TFE factors.
a) A panel of human PDA cell lines were infected with shRNAs targeting MITF, TFE3 or TFEB. Growth relative to cells infected with shGFP control was assayed 8–10 days post infection. Note that sensitivity to individual knockdown correlates with the relative expression of each factor (see Extended Data Figure 1F). Colored bars indicate knockdown condition, which leads to the greatest growth impairment. b) Selective sensitivity of PDA cells compared to non-PDA cells (QGP1, HPNE and the NSCLC cell line H460) to treatment with 50 μM CQ for 4 days. Error bars indicate mean ± s.e.m. * p < 0.05. c) Immunoblot showing robust detection of LC3-II across a panel of primary patient-derived cultures (PDAC 1–6) and PDA cell lines. d) Subcellular fractionation showing that PDA patient cultures have constitutively nuclear MITF and TFE3. e) qRT-PCR showing that MITF (left) or TFE3 (right) knockdown suppressed multiple autophagy-lysosomal genes in patient-derived PDA cells. * p < 0.01. f) Immunofluorescence staining for LAMP2 showing that MITF (N = 212 siCTRL, N = 220 siMITF), TFE3 (N = 228 siCTRL, N = 244 siTFE3), TFEB (N = 229 siCTRL, N = 271 siTFEB) knockdown results in enlarged, dysmorphic lysosomes in patient-derived PDA cultures. Scale bar = 7.5 μm. ** p < 0.0001. g) Knockdown of the indicated MiT/TFE factors inhibits colony formation in a series of primary PDA cultures. h) 8988T cells infected in vitro with shGFP or shTFE3 (left panel) and PL18 cells infected with shGFP or 2 hairpins targeting MITF (shMITF_1 and shMITF_2; right panel) were implanted subcutaneously on both flanks of SCID mice (N = 4 mice per group). Tumor xenograft growth was monitored over the course of 70 (8988T) and 50 (PL18) days. Error bars indicate mean ± s.e.m. i) Forced expression of MITF in KrasG12D mouse PanIN cells causes an increase in autophagy-lysosome gene expression relative to control cells in vitro. * p < 0.005. Data are representative of N = 3 independent experiments.
Supplementary Material
Acknowledgments
We would like to thank L. Ellisen, W. Kim, and R. Mostoslavsky and for advice and helpful comments on the manuscript, S. Gygi for access to proteomics data analysis software, F. Kottakis, Y. Mizukami and M. Leisa for technical support, and C. Ivan for bioinformatics support. This work was supported by grants from the NIH (P50CA1270003, P01 CA117969-07, R01 CA133557-05) and Linda J. Verville Cancer Research Foundation to NB. N.B. holds the Gallagher Endowed Chair in Gastrointestinal Cancer Research. R.M.P holds a Hirshberg Foundation for Pancreatic Cancer seed grant. N.B. and R.M.P. are members of the Andrew Warshaw Institute for Pancreatic Cancer Research.
Footnotes
Author contributions:
R.M.P and N.B. conceived and designed the study. R.M.P and S.S. performed all experiments involving PDA cells and mouse models. R.M.P. and B.N.N. performed the metabolite measurements. J.F. and J.L. performed immunohistochemistry on human tissue sections. M.B. and W.H. performed quantitative proteomics measurements and analysis. K.N.R and S.R. performed computational analysis. V.D. and M.K.S performed pathology assessment and electron microscopy analysis. C.R.F provided essential reagents. N.J.D and G.S. supervised the metabolite analysis. R.Z. and J.S contributed to the study design. R.M.P. and N.B wrote the manuscript with feedback from all authors.
RNA-sequencing data are available in GEO under accession GSE62077.
References
- 1.White E. Exploiting the bad eating habits of Ras-driven cancers. Genes Dev. 2013;27:2065–2071. doi: 10.1101/gad.228122.113. [DOI] [PMC free article] [PubMed] [Google Scholar]
- 2.Yang S, et al. Pancreatic cancers require autophagy for tumor growth. Genes Dev. 2011;25:717–729. doi: 10.1101/gad.2016111. [DOI] [PMC free article] [PubMed] [Google Scholar]
- 3.Rosenfeldt MT, et al. p53 status determines the role of autophagy in pancreatic tumour development. Nature. 2013;504:296–300. doi: 10.1038/nature12865. [DOI] [PubMed] [Google Scholar]
- 4.Yang A, et al. Autophagy Is Critical for Pancreatic Tumor Growth and Progression in Tumors with p53 Alterations. Cancer Discov. 2014;4:905–913. doi: 10.1158/2159-8290.CD-14-0362. [DOI] [PMC free article] [PubMed] [Google Scholar]
- 5.Kroemer G, Marino G, Levine B. Autophagy and the integrated stress response. Molecular cell. 2010;40:280–293. doi: 10.1016/j.molcel.2010.09.023. [DOI] [PMC free article] [PubMed] [Google Scholar]
- 6.Haq R, Fisher DE. Biology and clinical relevance of the micropthalmia family of transcription factors in human cancer. J Clin Oncol. 2011;29:3474–3482. doi: 10.1200/JCO.2010.32.6223. [DOI] [PubMed] [Google Scholar]
- 7.Settembre C, et al. TFEB links autophagy to lysosomal biogenesis. Science. 2011;332:1429–1433. doi: 10.1126/science.1204592. [DOI] [PMC free article] [PubMed] [Google Scholar]
- 8.Sardiello M, et al. A gene network regulating lysosomal biogenesis and function. Science. 2009;325:473–477. doi: 10.1126/science.1174447. [DOI] [PubMed] [Google Scholar]
- 9.Settembre C, et al. A lysosome-to-nucleus signalling mechanism senses and regulates the lysosome via mTOR and TFEB. The EMBO journal. 2012;31:1095–1108. doi: 10.1038/emboj.2012.32. [DOI] [PMC free article] [PubMed] [Google Scholar]
- 10.Roczniak-Ferguson A, et al. The transcription factor TFEB links mTORC1 signaling to transcriptional control of lysosome homeostasis. Science signaling. 2012;5:ra42. doi: 10.1126/scisignal.2002790. [DOI] [PMC free article] [PubMed] [Google Scholar]
- 11.Martina JA, et al. The nutrient-responsive transcription factor TFE3 promotes autophagy, lysosomal biogenesis, and clearance of cellular debris. Science signaling. 2014;7:ra9. doi: 10.1126/scisignal.2004754. [DOI] [PMC free article] [PubMed] [Google Scholar]
- 12.Ting L, Rad R, Gygi SP, Haas W. MS3 eliminates ratio distortion in isobaric multiplexed quantitative proteomics. Nature methods. 2011;8:937–940. doi: 10.1038/nmeth.1714. [DOI] [PMC free article] [PubMed] [Google Scholar]
- 13.Raices M, D’Angelo MA. Nuclear pore complex composition: a new regulator of tissue-specific and developmental functions. Nature reviews. Molecular cell biology. 2012;13:687–699. doi: 10.1038/nrm3461. [DOI] [PubMed] [Google Scholar]
- 14.Chook YM, Suel KE. Nuclear import by karyopherin-betas: recognition and inhibition. Biochimica et biophysica acta. 2011;1813:1593–1606. doi: 10.1016/j.bbamcr.2010.10.014. [DOI] [PMC free article] [PubMed] [Google Scholar]
- 15.Zehorai E, Seger R. Beta-like importins mediate the nuclear translocation of mitogen-activated protein kinases. Mol Cell Biol. 2014;34:259–270. doi: 10.1128/MCB.00799-13. [DOI] [PMC free article] [PubMed] [Google Scholar] [Retracted]
- 16.Yao X, Chen X, Cottonham C, Xu L. Preferential utilization of Imp7/8 in nuclear import of Smads. J Biol Chem. 2008;283:22867–22874. doi: 10.1074/jbc.M801320200. [DOI] [PMC free article] [PubMed] [Google Scholar]
- 17.Waldmann I, Walde S, Kehlenbach RH. Nuclear import of c-Jun is mediated by multiple transport receptors. J Biol Chem. 2007;282:27685–27692. doi: 10.1074/jbc.M703301200. [DOI] [PubMed] [Google Scholar]
- 18.Xu L, et al. Msk is required for nuclear import of TGF-{beta}/BMP-activated Smads. The Journal of cell biology. 2007;178:981–994. doi: 10.1083/jcb.200703106. [DOI] [PMC free article] [PubMed] [Google Scholar]
- 19.Golomb L, et al. Importin 7 and exportin 1 link c-Myc and p53 to regulation of ribosomal biogenesis. Molecular cell. 2012;45:222–232. doi: 10.1016/j.molcel.2011.11.022. [DOI] [PMC free article] [PubMed] [Google Scholar]
- 20.Ballabio A, Gieselmann V. Lysosomal disorders: from storage to cellular damage. Biochimica et biophysica acta. 2009;1793:684–696. doi: 10.1016/j.bbamcr.2008.12.001. [DOI] [PubMed] [Google Scholar]
- 21.Settembre C, Fraldi A, Medina DL, Ballabio A. Signals from the lysosome: a control centre for cellular clearance and energy metabolism. Nature reviews. Molecular cell biology. 2013;14:283–296. doi: 10.1038/nrm3565. [DOI] [PMC free article] [PubMed] [Google Scholar]
- 22.Commisso C, et al. Macropinocytosis of protein is an amino acid supply route in Ras-transformed cells. Nature. 2013;497:633–637. doi: 10.1038/nature12138. [DOI] [PMC free article] [PubMed] [Google Scholar]
- 23.Rabinowitz JD, White E. Autophagy and metabolism. Science. 2010;330:1344–1348. doi: 10.1126/science.1193497. [DOI] [PMC free article] [PubMed] [Google Scholar]
- 24.Singh R, et al. Autophagy regulates lipid metabolism. Nature. 2009;458:1131–1135. doi: 10.1038/nature07976. [DOI] [PMC free article] [PubMed] [Google Scholar]
- 25.Zoncu R, Efeyan A, Sabatini DM. mTOR: from growth signal integration to cancer, diabetes and ageing. Nature reviews. Molecular cell biology. 2011;12:21–35. doi: 10.1038/nrm3025. [DOI] [PMC free article] [PubMed] [Google Scholar]
- 26.Petersen NH, et al. Transformation-associated changes in sphingolipid metabolism sensitize cells to lysosomal cell death induced by inhibitors of acid sphingomyelinase. Cancer Cell. 2013;24:379–393. doi: 10.1016/j.ccr.2013.08.003. [DOI] [PubMed] [Google Scholar]
- 27.Saftig P, Sandhoff K. Cancer: Killing from the inside. Nature. 2013;502:312–313. doi: 10.1038/nature12692. [DOI] [PubMed] [Google Scholar]
- 28.Narita M, et al. Spatial coupling of mTOR and autophagy augments secretory phenotypes. Science. 2011;332:966–970. doi: 10.1126/science.1205407. [DOI] [PMC free article] [PubMed] [Google Scholar]
- 29.Jones S, et al. Core signaling pathways in human pancreatic cancers revealed by global genomic analyses. Science. 2008;321:1801–1806. doi: 10.1126/science.1164368. [DOI] [PMC free article] [PubMed] [Google Scholar]
- 30.Tzatsos A, et al. KDM2B promotes pancreatic cancer via Polycomb-dependent and -independent transcriptional programs. J Clin Invest. 2013;123:727–739. doi: 10.1172/JCI64535. [DOI] [PMC free article] [PubMed] [Google Scholar]
- 31.Garraway LA, et al. Integrative genomic analyses identify MITF as a lineage survival oncogene amplified in malignant melanoma. Nature. 2005;436:117–122. doi: 10.1038/nature03664. nature03664 [pii] [DOI] [PubMed] [Google Scholar]
- 32.Gameiro PA, et al. In vivo HIF-mediated reductive carboxylation is regulated by citrate levels and sensitizes VHL-deficient cells to glutamine deprivation. Cell Metab. 2013;17:372–385. doi: 10.1016/j.cmet.2013.02.002. S1550-4131(13)00050-8 [pii] [DOI] [PMC free article] [PubMed] [Google Scholar]
- 33.Metallo CM, et al. Reductive glutamine metabolism by IDH1 mediates lipogenesis under hypoxia. Nature. 2011;481:380–384. doi: 10.1038/nature10602. nature10602 [pii] [DOI] [PMC free article] [PubMed] [Google Scholar]
- 34.Commisso C, et al. Macropinocytosis of protein is an amino acid supply route in Ras-transformed cells. Nature. 2013;497:633–637. doi: 10.1038/nature12138. [DOI] [PMC free article] [PubMed] [Google Scholar]
- 35.Steinberg BE, et al. A cation counterflux supports lysosomal acidification. The Journal of cell biology. 2010;189:1171–1186. doi: 10.1083/jcb.200911083. [DOI] [PMC free article] [PubMed] [Google Scholar]
- 36.Zoncu R, et al. mTORC1 senses lysosomal amino acids through an inside-out mechanism that requires the vacuolar H(+)-ATPase. Science. 2011;334:678–683. doi: 10.1126/science.1207056. [DOI] [PMC free article] [PubMed] [Google Scholar]
- 37.Hershey CL, Fisher DE. Genomic analysis of the Microphthalmia locus and identification of the MITF-J/Mitf-J isoform. Gene. 2005;347:73–82. doi: 10.1016/j.gene.2004.12.002. S0378–1119(04)00736-X [pii] [DOI] [PubMed] [Google Scholar]
- 38.Settembre C, et al. TFEB links autophagy to lysosomal biogenesis. Science. 2011;332:1429–1433. doi: 10.1126/science.1204592. [DOI] [PMC free article] [PubMed] [Google Scholar]
- 39.Corcoran RB, et al. STAT3 plays a critical role in KRAS-induced pancreatic tumorigenesis. Cancer Res. 2011;71:5020–5029. doi: 10.1158/0008-5472.CAN-11-0908. [DOI] [PMC free article] [PubMed] [Google Scholar]
- 40.Chapel A, et al. An extended proteome map of the lysosomal membrane reveals novel potential transporters. Molecular & cellular proteomics : MCP. 2013;12:1572–1588. doi: 10.1074/mcp.M112.021980. [DOI] [PMC free article] [PubMed] [Google Scholar]
- 41.Schroder B, et al. Integral and associated lysosomal membrane proteins. Traffic. 2007;8:1676–1686. doi: 10.1111/j.1600-0854.2007.00643.x. [DOI] [PubMed] [Google Scholar]
- 42.Behrends C, Sowa ME, Gygi SP, Harper JW. Network organization of the human autophagy system. Nature. 2010;466:68–76. doi: 10.1038/nature09204. nature09204 [pii] [DOI] [PMC free article] [PubMed] [Google Scholar]
- 43.Ballabio A, Gieselmann V. Lysosomal disorders: from storage to cellular damage. Biochimica et biophysica acta. 2009;1793:684–696. doi: 10.1016/j.bbamcr.2008.12.001. [DOI] [PubMed] [Google Scholar]
- 44.Ting L, Rad R, Gygi SP, Haas W. MS3 eliminates ratio distortion in isobaric multiplexed quantitative proteomics. Nature methods. 2011;8:937–940. doi: 10.1038/nmeth.1714. [DOI] [PMC free article] [PubMed] [Google Scholar]
- 45.McAlister GC, et al. Increasing the multiplexing capacity of TMTs using reporter ion isotopologues with isobaric masses. Analytical chemistry. 2012;84:7469–7478. doi: 10.1021/ac301572t. [DOI] [PMC free article] [PubMed] [Google Scholar]
- 46.Weekes MP, et al. Quantitative temporal viromics: an approach to investigate host-pathogen interaction. Cell. 2014;157:1460–1472. doi: 10.1016/j.cell.2014.04.028. [DOI] [PMC free article] [PubMed] [Google Scholar]
- 47.Eng JK, McCormack AL, Yates JR. An approach to correlate tandem mass spectral data of peptides with amino acid sequences in a protein database. Journal of the American Society for Mass Spectrometry. 1994;5:976–989. doi: 10.1016/1044-0305(94)80016-2. [DOI] [PubMed] [Google Scholar]
- 48.Elias JE, Gygi SP. Target-decoy search strategy for increased confidence in large-scale protein identifications by mass spectrometry. Nature methods. 2007;4:207–214. doi: 10.1038/nmeth1019. [DOI] [PubMed] [Google Scholar]
- 49.Huttlin EL, et al. A tissue-specific atlas of mouse protein phosphorylation and expression. Cell. 2010;143:1174–1189. doi: 10.1016/j.cell.2010.12.001. [DOI] [PMC free article] [PubMed] [Google Scholar]
Associated Data
This section collects any data citations, data availability statements, or supplementary materials included in this article.


