Significance
FMS-like tyrosine kinase 3 (FLT3) inhibitors have shown impressive activity in clinical trials for acute myeloid leukemia (AML); however, these inhibitors invariably fail to achieve sustained remissions. Here we demonstrate that FLT3 inhibition causes severe deficiencies in redox metabolism and accumulation of reactive oxygen species (ROS) in the mitochondria of AML cells. We discovered that the metabolic regulators ataxia telangiectasia mutated and glucose 6-phosphate dehydrogenase help maintain antioxidant capacity and survival of a subpopulation of AML cells in the face of FLT3 inhibition. Inactivation of these factors escalates mitochondrial ROS and enhances AML cell eradication. Importantly, we show that the use of a drug that increases mitochondrial ROS enhances the efficacy of FLT3 inhibitor therapy, suggesting a combinatorial therapeutic strategy.
Keywords: acute myeloid leukemia, FLT3, metabolism, ATM, glutathione
Abstract
Activating mutations in FMS-like tyrosine kinase 3 (FLT3) are common in acute myeloid leukemia (AML) and drive leukemic cell growth and survival. Although FLT3 inhibitors have shown considerable promise for the treatment of AML, they ultimately fail to achieve long-term remissions as monotherapy. To identify genetic targets that can sensitize AML cells to killing by FLT3 inhibitors, we performed a genome-wide RNA interference (RNAi)-based screen that identified ATM (ataxia telangiectasia mutated) as being synthetic lethal with FLT3 inhibitor therapy. We found that inactivating ATM or its downstream effector glucose 6-phosphate dehydrogenase (G6PD) sensitizes AML cells to FLT3 inhibitor induced apoptosis. Examination of the cellular metabolome showed that FLT3 inhibition by itself causes profound alterations in central carbon metabolism, resulting in impaired production of the antioxidant factor glutathione, which was further impaired by ATM or G6PD inactivation. Moreover, FLT3 inhibition elicited severe mitochondrial oxidative stress that is causative in apoptosis and is exacerbated by ATM/G6PD inhibition. The use of an agent that intensifies mitochondrial oxidative stress in combination with a FLT3 inhibitor augmented elimination of AML cells in vitro and in vivo, revealing a therapeutic strategy for the improved treatment of FLT3 mutated AML.
Acute myeloid leukemia (AML) is a hematological cancer that is characterized by the aberrant growth of myeloid progenitor cells with a block in cellular differentiation. AML is the most common adult acute leukemia and accounts for ∼20% of childhood leukemias. Although frontline treatment of AML with cytotoxic chemotherapy achieves high remission rates, 75–80% of patients will either not respond to or will relapse after initial therapy, and most patients will die of their disease (1, 2). Thus, more effective and less toxic therapies for AML are required. The promise of molecularly targeted cancer therapies has generated much excitement with the remarkable clinical success of the small molecule tyrosine kinase inhibitors (TKIs) targeting the oncogenic kinase BCR-ABL for the treatment of chronic myeloid leukemia (3). However, targeted approaches for the treatment of AML have not yet yielded major successes.
In AML, aberrant signal transduction drives the proliferation and survival of leukemic cells. Activated signal transduction occurs through genetic alterations of signaling molecules such as FLT3, KIT, PTPN11, and members of the RAS family (4, 5). Given the successful development and utilization of numerous TKIs, the FLT3 receptor tyrosine kinase has emerged as a promising target for the treatment of AML. Indeed, activating mutations in FLT3 are one of the most frequently observed genetic defects in AML and are comprised predominantly of internal tandem duplication (ITD) mutations in the juxtamembrane domain (6). FLT3-ITD mutations are associated with poor prognosis, including increased relapse rate, decreased disease-free survival, and poor overall survival (5, 7, 8). The clinical significance and the strong evidence of the role of activated FLT3 in driving leukemogenesis (9, 10) have led to the development of FLT3-targeted TKIs, several of which have been tested in clinical trials. The most potent and selective of these inhibitors, AC220 (quizartinib), demonstrated impressive activity, with 44% of patients harboring FLT3-ITD mutations achieving a complete remission. However, remissions achieved by FLT3 inhibitor therapy were always short-lived, irrespective of the FLT3 inhibitor being used (11). Although various trials examining efficacy of FLT3 inhibitors in combination with conventional chemotherapy are still ongoing, these trials have not as of yet demonstrated sustained remissions in FLT3-ITD+ AML.
The inability of FLT3 inhibitors to induce durable remissions indicates that additional targets will be required for an effective molecularly targeted AML therapy. To uncover such targets, we performed a genome-wide shRNA-based synthetic lethal screen with a FLT3 inhibitor in FLT3-ITD+ AML cells. Our data show that modulation of leukemia cell redox metabolism can cooperate with FLT3 inhibition to elicit more effective eradication of AML cells.
Results
ATM and G6PD Are Synthetic Lethal on FLT3 Inhibition in FLT3-ITD+ AML Cells.
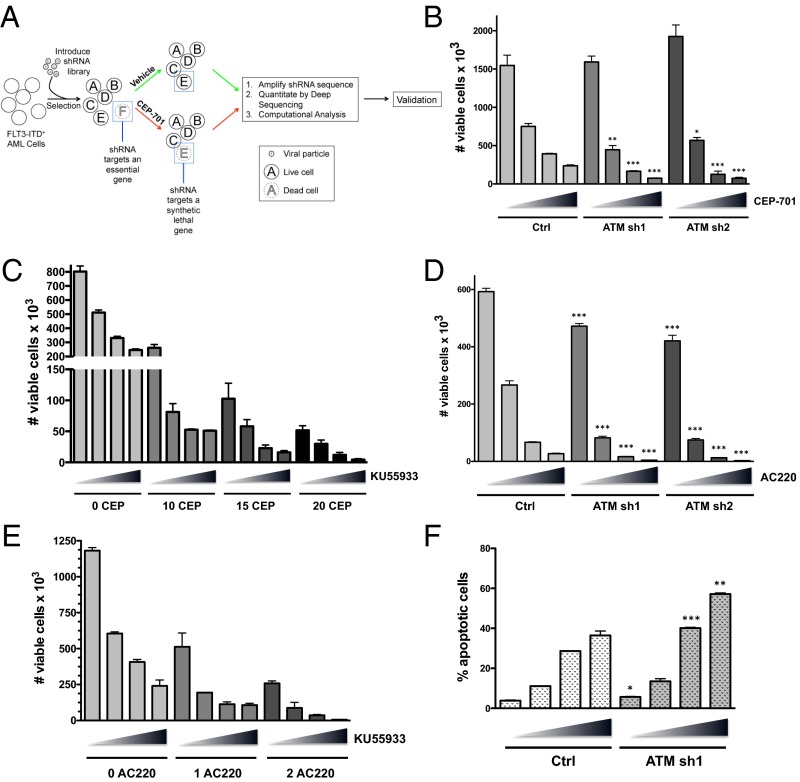
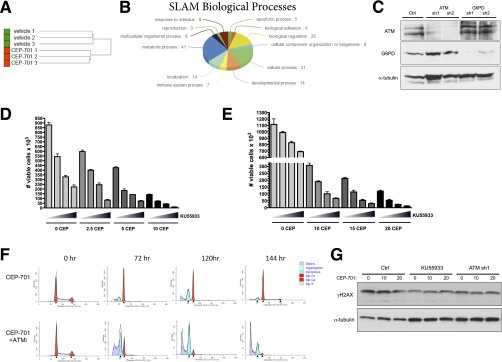
To identify genes whose suppression sensitizes FLT3-ITD+ AML cells to killing by FLT3 inhibitors, we performed a large-scale RNAi-based screen (Fig. 1A). Briefly, FLT3-ITD+ Molm13 cells were virally transduced with a genome-wide shRNA library (∼4–5 shRNAs per human RNA transcript) and selected in puromycin for a period of 10 d to obtain a pure population of transduced cells and to allow for the exclusion of shRNAs that target essential genes. The transduced cells (replicates of three) were then treated with either vehicle (DMSO) or the FLT3 inhibitor CEP-701 (lestaurtinib) at 20 nM for 72 h, a dose that eliminates ∼85–90% of the cells. The cells were cultured for an additional week to allow for recovery. RNA was isolated and reverse-transcribed, and the shRNA sequences were amplified by PCR followed by quantitation by deep sequencing. Hierarchical clustering of unfiltered data showed that the replicates cluster by treatment condition, suggesting that shRNA representation is dependent on the drug treatment and is not stochastic (Fig. S1A). Computational analysis using BiNGS!SL-seq (12) revealed 93 genes that met the inclusion criteria of at least two shRNAs per gene, with each shRNA having a weighted z-value of <0.1 and a mean fold change of <−10 (Dataset S1). We refer to these genes as SLAMs (for synthetic lethal in AML), i.e., inhibition (knockdown) of these genes significantly sensitizes AML cells to FLT3 inhibitor-induced loss of viability. Gene ontology analysis (Panther) showed that a large proportion of SLAMs are involved in metabolic processes (Fig. S1B and Table S1), including ataxia telangiectasia mutated (ATM). ATM encodes a serine/threonine kinase that facilitates the DNA damage response. More recently, ATM has been shown to control cellular metabolism and the response to oxidative stress (13).
Fig. 1.
RNAi-based functional genomic screening identifies ATM as synthetic lethal on FLT3 inhibition in AML. (A) Experimental overview. Molm13 cells were transduced with a genome-wide lentiviral shRNA library. After selection in puromycin, the cells were treated with either vehicle (0.1% DMSO) or the FLT3 inhibitor CEP-701 (20 nM) for 72 h. After treatment, the shRNAs were recovered, amplified, and quantitated by next-generation sequencing. Differential shRNA representation was compared between the vehicle and treatment groups. (B) Molm13 AML cells were stably transduced with shRNAs (sh1 or sh2) targeting ATM or a negative control shRNA (ctrl). The cell lines were treated with CEP-701 (increasing concentrations of 0, 10, 15, and 20 nM indicated by triangles) for 72 h, and the number of viable cells (based on PI exclusion) was counted by flow cytometry. (C) Molm13 cells were treated with CEP-701 and KU55933 alone or in combination as indicated (triangle: 0, 5, 7.5, and 10 µM KU55933) for 72 h, and viable cells were counted. (D) Molm13 cell lines were treated with AC220 (triangle: 0, 1, 2, and 3 nM), and cell viability was assessed. (E) Molm13 cells were treated with AC220 (0, 1, or 2 nM as indicated) and KU55933 alone or in combination (as in C), and cell viability was assessed. (F) Molm13 cell lines were treated for 48 h (as in D), and apoptosis was measured by Annexin V staining and flow cytometry. For B, D, and F, asterisks indicate statistical significance (t test; *P ≤ 0.05, **P ≤ 0.01, ***P ≤ 0.001) for comparisons of ctrl and ATM knockdown cells under the same treatment conditions.
Fig. S1.
RNAi-based functional genomic screening identifies genes that are synthetic lethal on FLT3 inhibition in AML, including ATM, whose inhibition sensitizes AML cells to apoptosis. (A) Unsupervised hierarchical clustering of unfiltered screening data demonstrates that shRNA representation clusters in replicates according to the cell treatment. (B) Gene ontology analysis (Panther) shows the biological processes of SLAM genes. (C) Molm13 shRNA stably transduced cell lines were subjected to Western blot analysis for ATM, G6PD, and α-tubulin (loading control). (D) MV4-11 cells were treated with CEP-701 and KU55933 alone or in combination as indicated (increasing KU55933 concentrations of 0, 5, 7.5, and 10 µM indicated by triangles) for 72 h, and viable cells (based on PI exclusion) were counted by flow cytometry. (E) EOL-1 cells were treated with CEP-701 and KU55933 alone or in combination as indicated (triangle: 0, 5, 7.5, and 10 µM KU55933) for 72 h, and viable cells were counted. (F) Molm13 cells were treated with CEP-701 (10 nM) alone or in combination with 10 µM KU55933 for 72–144 h and subjected to cell cycle analysis. The cells were resuspended in a saponin/propidium iodide solution (25 µg/mL propidium iodide, 0.3% saponin, 0.1 mM EDTA, and 2 U/mL RNase), incubated overnight at 4 °C, and analyzed by flow cytometry. Modfit LT (Verity Software) was used for cell cycle and apoptotic peak modeling. (G) Molm13 control cells ± KU55933 (10 µM for 24 h) or ATM sh1 cells were treated with CEP-701 as indicated for 24 h and Western blot analysis for phospho-H2AX (γΗ2ΑX) or α-tubulin (loading control) was performed.
Table S1.
List of metabolic SLAM genes: Ontology term GO:0008152 metabolic process
| Gene ID | Description |
| HUMAN|HGNC = 4367|UniProtKB = P17900 | Ganglioside GM2 activator;GM2A;ortholog |
| HUMAN|HGNC = 11362|UniProtKB = P42224 | Signal transducer and activator of transcription 1-alpha/beta;STAT1;ortholog |
| HUMAN|HGNC = 8491|UniProtKB = O43913 | Origin recognition complex subunit 5;ORC5;ortholog |
| HUMAN|HGNC = 13109|UniProtKB = P17038 | Zinc finger protein 43;ZNF43;ortholog |
| HUMAN|HGNC = 795|UniProtKB = Q13315 | Serine-protein kinase ATM;ATM;ortholog |
| HUMAN|HGNC = 7670|UniProtKB = Q9Y6Q9 | Nuclear receptor coactivator 3;NCOA3;ortholog |
| HUMAN|HGNC = 2919|UniProtKB = P56179 | Homeobox protein DLX-6;DLX6;ortholog |
| HUMAN|HGNC = 66|UniProtKB = Q9UBJ2 | ATP-binding cassette subfamily D member 2;ABCD2;ortholog |
| HUMAN|HGNC = 5270|UniProtKB = P25685 | DnaJ homolog subfamily B member 1;DNAJB1;ortholog |
| HUMAN|HGNC = 10931|UniProtKB = O00476 | Sodium-dependent phosphate transport protein 4;SLC17A3;ortholog |
| HUMAN|HGNC = 29009|UniProtKB = Q6AHZ1 | Zinc finger protein 518A;ZNF518A;ortholog |
| HUMAN|HGNC = 1917|UniProtKB = O14647 | Chromodomain-helicase-DNA-binding protein 2;CHD2;ortholog |
| HUMAN|HGNC = 19003|UniProtKB = Q96GD3 | Polycomb protein SCMH1;SCMH1;ortholog |
| HUMAN|HGNC = 3712|UniProtKB = P68106 | Peptidyl-prolyl cis-trans isomerase FKBP1B;FKBP1B;ortholog |
| HUMAN|HGNC = 29501|UniProtKB = P81274 | G protein-signaling modulator 2;GPSM2;ortholog |
| HUMAN|HGNC = 1583|UniProtKB = P30279 | G1/S-specific cyclin-D2;CCND2;ortholog |
| HUMAN|HGNC = 5026|UniProtKB = Q14541 | Hepatocyte nuclear factor 4-gamma;HNF4G;ortholog |
| HUMAN|HGNC = 9005|UniProtKB = Q99697 | Pituitary homeobox 2;PITX2;ortholog |
| HUMAN|HGNC = 23657|UniProtKB = Q9Y223 | Bifunctional UDP-N-acetylglucosamine 2-epimerase/N-acetylmannosamine kinase;GNE;ortholog |
| HUMAN|HGNC = 6501|UniProtKB = P13473 | Lysosome-associated membrane glycoprotein 2;LAMP2;ortholog |
| HUMAN|HGNC = 10304|UniProtKB = P40429 | 60S ribosomal protein L13a;RPL13A;ortholog |
| HUMAN|HGNC = 3298|UniProtKB = O43432 | Eukaryotic translation initiation factor 4 gamma 3;EIF4G3;ortholog |
| HUMAN|HGNC = 917|UniProtKB = O43825 | Beta-1,3-galactosyltransferase 2;B3GALT2;ortholog |
| HUMAN|HGNC = 30423|UniProtKB = Q9HB71 | Calcyclin-binding protein;CACYBP;ortholog |
| HUMAN|HGNC = 9635|UniProtKB = Q12974 | Protein tyrosine phosphatase type IVA 2;PTP4A2;ortholog |
| HUMAN|HGNC = 3581|UniProtKB = Q12830 | Nucleosome-remodeling factor subunit BPTF;BPTF;ortholog |
| HUMAN|HGNC = 16809|UniProtKB = Q9HAU4 | E3 ubiquitin-protein ligase SMURF2;SMURF2;ortholog |
| HUMAN|HGNC = 950|UniProtKB = Q92560 | Ubiquitin carboxyl-terminal hydrolase BAP1;BAP1;ortholog |
| HUMAN|HGNC = 12638|UniProtKB = O14607 | Histone demethylase UTY;UTY;ortholog |
| HUMAN|HGNC = 17103|UniProtKB = Q9Y5L0 | Transportin-3;TNPO3;ortholog |
| HUMAN|HGNC = 1528|UniProtKB = P51636 | Caveolin-2;CAV2;ortholog |
| HUMAN|HGNC = 6917|UniProtKB = Q9UBB5 | Methyl-CpG-binding domain protein 2;MBD2;ortholog |
| HUMAN|HGNC = 4315|UniProtKB = Q53GS7 | Nucleoporin GLE1;GLE1;ortholog |
| HUMAN|HGNC = 8068|UniProtKB = P52948 | Nuclear pore complex protein Nup98-Nup96;NUP98;ortholog |
| HUMAN|HGNC = 29612|UniProtKB = Q13571 | Lysosomal-associated transmembrane protein 5;LAPTM5;ortholog |
| HUMAN|HGNC = 2311|UniProtKB = P14384 | Carboxypeptidase M;cpm;ortholog |
| HUMAN|HGNC = 9644|UniProtKB = Q06124 | Tyrosine-protein phosphatase nonreceptor type 11;PTPN11;ortholog |
| HUMAN|HGNC = 17015|UniProtKB = Q13610 | Periodic tryptophan protein 1 homolog;PWP1;ortholog |
| HUMAN|HGNC = 12870|UniProtKB = P08048 | Zinc finger Y-chromosomal protein;ZFY;ortholog |
| HUMAN|HGNC = 11825|UniProtKB = P43699 | Homeobox protein Nkx-2.1;NKX2-1;ortholog |
| HUMAN|HGNC = 221|UniProtKB = Q9UNA0 | A disintegrin and metalloproteinase with thrombospondin motifs 5;ADAMTS5;ortholog |
| HUMAN|HGNC = 1987|UniProtKB = Q99967 | Cbp/p300-interacting transactivator 2;CITED2;ortholog |
Gene ontology analysis (Panther) of SLAM genes identified numerous genes involved in metabolic processes.
To verify that inactivation of ATM is synthetic lethal with FLT3 inhibition, we generated ATM knockdown Molm13 cell lines using shRNAs that were unique from those used in the screen. Western blot analysis was used to confirm effective knockdown of ATM in 2 cell lines (designated ATM sh1 and sh2; Fig. S1C). Control (expressing a nontargeting shRNA) and ATM knockdown cells were treated with increasing doses of CEP-701 for 72 h, and viability was assessed, based on propidium iodide exclusion, by flow cytometry. As shown in Fig. 1B, the ATM knockdown cells were significantly more sensitive to CEP-701–induced loss of viability relative to control cells. Notably, the ATM knockdown cells proliferated at a similar rate to control cells, suggesting that ATM does not influence cell viability in the absence of FLT3 inhibition. To determine if pharmacological inactivation of ATM has similar effects as genetic inactivation, we used the ATM kinase inhibitor KU55933. Treatment of Molm13 cells with CEP-701 in combination with KU55933 resulted in synergistic elimination (Fig. 1C). Combination index (CI) values were synergistic (<0.7) at all combination doses tested and were strongly synergistic (<0.3) with several combinations (Table S2). Similar effects were observed using KU55933 in combination with CEP-701 in two additional FLT3-dependent AML cell lines, MV4-11 and EOL-1 (Fig. S1 D and E and Table S2). Furthermore, knockdown of ATM or inhibition with KU55933 sensitized Molm13 cells to treatment with AC220 (Fig. 1 D and E), a more potent and selective FLT3 inhibitor that is currently being explored in phase III clinical trials for AML (14). To better understand how ATM inhibition facilitates loss of viability on treatment with a FLT3 inhibitor, cell cycle analysis was performed. As shown in Fig. S1F, treatment of Molm13 cells with a single dose of CEP-701 resulted in both G1 arrest (or quiescence) and apoptosis after 72 h; however, by 144 h, apoptotic cells were mostly cleared and surviving cells began to re-enter the cell cycle. In contrast, in cells treated with both CEP-701 and KU55933, the dominant response was apoptosis, with surviving G1 cells barely detectable after 120 h. Similarly, analysis of apoptosis using Annexin V staining revealed that ATM knockdown significantly increases apoptosis on treatment with AC220 (Fig. 1F). Thus, these data demonstrate that ATM inhibition alters the fate of FLT3-ITD+ AML cells on FLT3 inhibition, enhancing cell killing through increased apoptosis.
Table S2.
Combination index (CI values) for drug combinations tested in cell viability assays
| Cell line (Dose) | Drug combination (Dose) | Effect | CI |
| Molm13 (nM CEP) | CEP701+KU55933 (µM KU) | ||
| 10.0 | 5.0 | 0.8986 | 0.52057 |
| 10.0 | 7.5 | 0.9344 | 0.3295 |
| 10.0 | 10.0 | 0.9364 | 0.33619 |
| 15.0 | 5.0 | 0.9277 | 0.49993 |
| 15.0 | 7.5 | 0.9713 | 0.18137 |
| 15.0 | 10.0 | 0.9796 | 0.12847 |
| 20.0 | 5.0 | 0.9626 | 0.30678 |
| 20.0 | 7.5 | 0.985 | 0.11441 |
| 20.0 | 10.0 | 0.9946 | 0.0383 |
| MV4-11 (nM CEP) | CEP701+KU55933 (µM KU) | ||
| 2.5 | 5.0 | 0.5457 | 1.47242 |
| 2.5 | 7.5 | 0.72 | 0.79558 |
| 2.5 | 10.0 | 0.9053 | 0.21498 |
| 5.0 | 5.0 | 0.7897 | 0.56483 |
| 5.0 | 7.5 | 0.839 | 0.46817 |
| 5.0 | 10.0 | 0.9176 | 0.22933 |
| 10.0 | 5.0 | 0.9185 | 0.25816 |
| 10.0 | 7.5 | 0.9523 | 0.15168 |
| 10.0 | 10.0 | 0.9883 | 0.03257 |
| EOL-1 (nM CEP) | CEP701+KU55933 (µM KU) | ||
| 10.0 | 5.0 | 0.831 | 0.64969 |
| 10.0 | 7.5 | 0.9093 | 0.29693 |
| 10.0 | 10.0 | 0.9397 | 0.18316 |
| 15.0 | 5.0 | 0.8975 | 0.50971 |
| 15.0 | 7.5 | 0.9516 | 0.20882 |
| 15.0 | 10.0 | 0.9734 | 0.10522 |
| 20.0 | 5.0 | 0.9516 | 0.2763 |
| 20.0 | 7.5 | 0.9788 | 0.10761 |
| 20.0 | 10.0 | 0.989 | 0.05153 |
| Molm13 (nM AC) | AC220+KU55933 (µM KU) | ||
| 1.0 | 5.0 | 0.8358 | 0.54475 |
| 1.0 | 7.5 | 0.9041 | 0.34689 |
| 1.0 | 10.0 | 0.9094 | 0.37882 |
| 2.0 | 5.0 | 0.9255 | 0.35098 |
| 2.0 | 7.5 | 0.969 | 0.15495 |
| 2.0 | 10.0 | 0.9949 | 0.02666 |
| Molm13 (nM CEP) | CEP701+DHEA (µM DHEA) | ||
| 10.0 | 10.0 | 0.6996 | 1.58427 |
| 10.0 | 30.0 | 0.7866 | 1.04452 |
| 10.0 | 50.0 | 0.8635 | 0.61041 |
| 15.0 | 10.0 | 0.8423 | 0.92758 |
| 15.0 | 30.0 | 0.9078 | 0.49533 |
| 15.0 | 50.0 | 0.9576 | 0.20332 |
| 20.0 | 10.0 | 0.9635 | 0.20966 |
| 20.0 | 30.0 | 0.9882 | 0.05986 |
| 20.0 | 50.0 | 0.9965 | 0.01566 |
| Molm13 (nM AC) | AC220+DHEA (µM DHEA) | ||
| 1.0 | 10.0 | 0.8632 | 0.81494 |
| 1.0 | 30.0 | 0.9389 | 0.41991 |
| 1.0 | 50.0 | 0.9904 | 0.0782 |
| 2.0 | 10.0 | 0.9625 | 0.45317 |
| 2.0 | 30.0 | 0.991 | 0.13209 |
| 2.0 | 50.0 | 0.998 | 0.03584 |
| MV4–11 (nM CEP) | CEP701+DHEA (µM DHEA) | ||
| 5.0 | 10.0 | 0.5719 | 1.42972 |
| 5.0 | 30.0 | 0.8294 | 0.43408 |
| 5.0 | 50.0 | 0.9592 | 0.08034 |
| 7.5 | 10.0 | 0.7736 | 0.67132 |
| 7.5 | 30.0 | 0.9124 | 0.22903 |
| 7.5 | 50.0 | 0.9863 | 0.02705 |
| 10.0 | 10.0 | 0.8824 | 0.35138 |
| 10.0 | 30.0 | 0.967 | 0.08512 |
| 10.0 | 50.0 | 0.9936 | 0.01355 |
| 32D-Vector (nM AC) | AC220+KU55933 (µM KU) | ||
| 0.25 | 5.0 | 0.7334 | 1.23676 |
| 0.25 | 7.5 | 0.8299 | 1.01952 |
| 0.25 | 10.0 | 0.8605 | 1.06383 |
| 0.5 | 5.0 | 0.7143 | 1.38245 |
| 0.5 | 7.5 | 0.8327 | 1.00593 |
| 0.5 | 10.0 | 0.8754 | 0.93435 |
| 1.0 | 5.0 | 0.7505 | 1.16721 |
| 1.0 | 7.5 | 0.8891 | 0.62137 |
| 1.0 | 10.0 | 0.8372 | 1.30589 |
| 32D-Vector (nM AC) | AC220+DHEA (µM DHEA) | ||
| 0.25 | 10.0 | 0.3987 | 4.48953 |
| 0.25 | 30.0 | 0.7479 | 2.42979 |
| 0.25 | 50.0 | 0.8304 | 2.28841 |
| 0.5 | 10.0 | 0.4507 | 3.59236 |
| 0.5 | 30.0 | 0.7729 | 2.09201 |
| 0.5 | 50.0 | 0.8508 | 1.93202 |
| 1.0 | 10.0 | 0.5075 | 2.87616 |
| 1.0 | 30.0 | 0.8129 | 1.60482 |
| 1.0 | 50.0 | 0.8259 | 2.39782 |
| 32D-FLT3-ITD (nM AC) | AC220+KU55933 (µM KU) | ||
| 0.25 | 5.0 | 0.8204 | 1.13448 |
| 0.25 | 7.5 | 0.9525 | 0.37217 |
| 0.25 | 10.0 | 0.9858 | 0.13992 |
| 0.5 | 5.0 | 0.9087 | 0.6084 |
| 0.5 | 7.5 | 0.9844 | 0.13534 |
| 0.5 | 10.0 | 0.9942 | 0.06352 |
| 1.0 | 5.0 | 0.9725 | 0.23059 |
| 1.0 | 7.5 | 0.9949 | 0.0565 |
| 1.0 | 10.0 | 0.9964 | 0.04818 |
| 32D-FLT3-ITD (nM AC) | AC220+DHEA (µM DHEA) | ||
| 0.25 | 10.0 | 0.5571 | 1.05908 |
| 0.25 | 30.0 | 0.8673 | 0.28485 |
| 0.25 | 50.0 | 0.9464 | 0.12341 |
| 0.5 | 10.0 | 0.736 | 0.88604 |
| 0.5 | 30.0 | 0.9329 | 0.23542 |
| 0.5 | 50.0 | 0.9815 | 0.074 |
| 1.0 | 10.0 | 0.9079 | 0.55726 |
| 1.0 | 30.0 | 0.9688 | 0.21511 |
| 1.0 | 50.0 | 0.9918 | 0.06725 |
| Molm13 (nM AC) | AC220+ELC (nM ELC) | ||
| 1.0 | 10.0 | 0.7856 | 0.77348 |
| 1.0 | 20.0 | 0.9117 | 0.32166 |
| 1.0 | 40.0 | 0.9783 | 0.08739 |
| 2.0 | 10.0 | 0.915 | 0.50397 |
| 2.0 | 20.0 | 0.96 | 0.25081 |
| 2.0 | 40.0 | 0.9983 | 0.01285 |
| 3.0 | 10.0 | 0.98 | 0.17961 |
| 3.0 | 20.0 | 0.9956 | 0.04436 |
| 3.0 | 40.0 | 0.9972 | 0.03001 |
| MV4-11 (nM AC) | AC220+ELC (nM ELC) | ||
| 0.5 | 10.0 | 0.8528 | 1.25492 |
| 0.5 | 20.0 | 0.9519 | 0.69121 |
| 0.5 | 40.0 | 0.9997 | 0.00717 |
| 1 | 10.0 | 0.8597 | 1.26286 |
| 1 | 20.0 | 0.9385 | 0.9329 |
| 1 | 40.0 | 0.9978 | 0.05621 |
| 2 | 10.0 | 0.9345 | 0.59989 |
| 2 | 20.0 | 0.9863 | 0.2044 |
| 2 | 40.0 | 0.9997 | 0.0076 |
| Primary AML 03 (nM AC) | AC220+ELC (nM ELC) | ||
| 2.5 | 10.0 | 0.5993 | 0.7233 |
| 2.5 | 20.0 | 0.7207 | 0.6175 |
| 2.5 | 40.0 | 0.8279 | 0.51136 |
| 5.0 | 10.0 | 0.692 | 0.57234 |
| 5.0 | 20.0 | 0.8304 | 0.33015 |
| 5.0 | 40.0 | 0.9118 | 0.21706 |
| 10.0 | 10.0 | 0.8136 | 0.37447 |
| 10.0 | 20.0 | 0.8986 | 0.20988 |
| 10.0 | 40.0 | 0.9355 | 0.17083 |
| Primary AML 05 (nM AC) | AC220+ELC (nM ELC) | ||
| 2.5 | 10.0 | 0.6181 | 1.02332 |
| 2.5 | 20.0 | 0.8959 | 0.22694 |
| 2.5 | 40.0 | 0.9657 | 0.09605 |
| 5.0 | 10.0 | 0.7681 | 0.58944 |
| 5.0 | 20.0 | 0.8355 | 0.52231 |
| 5.0 | 40.0 | 0.9113 | 0.36681 |
| 10.0 | 10.0 | 0.8443 | 0.5041 |
| 10.0 | 20.0 | 0.9091 | 0.31921 |
| 10.0 | 40.0 | 0.9825 | 0.05952 |
| Primary AML 10 (nM AC) | AC220+ELC (nM ELC) | ||
| 2.5 | 10.0 | 0.2539 | 2.07593 |
| 2.5 | 20.0 | 0.3376 | 1.3092 |
| 2.5 | 40.0 | 0.634 | 0.32238 |
| 5.0 | 10.0 | 0.6091 | 0.72584 |
| 5.0 | 20.0 | 0.5733 | 0.86049 |
| 5.0 | 40.0 | 0.7448 | 0.35413 |
| 10.0 | 10.0 | 0.8337 | 0.38094 |
| 10.0 | 20.0 | 0.8895 | 0.22155 |
| 10.0 | 40.0 | 0.9467 | 0.08955 |
CI values were calculated using CalcuSyn software (Biosoft). CI values less than 1 correspond to synergistic drug interactions, CI values equal to 1 correspond to additive interactions, and CI values more than 1 correspond to antagonistic interactions.
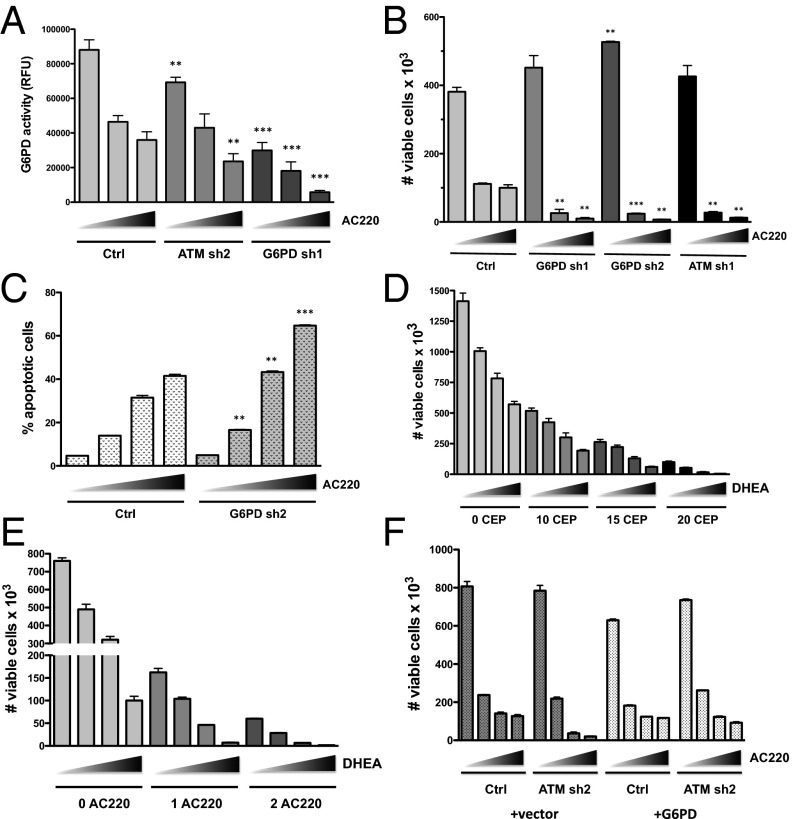
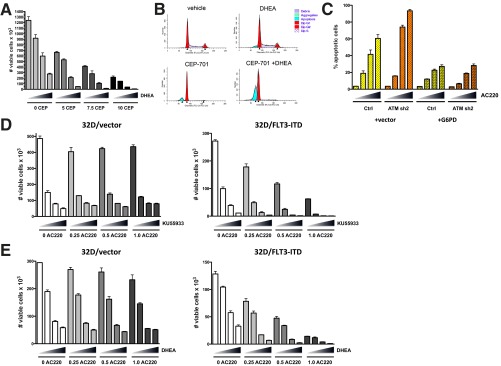
ATM is well known to regulate the response to DNA damage in the form of double-strand breaks (DSBs). However, inactivation of ATM, either by knockdown or treatment with KU55933, did not significantly affect DNA damage levels in the presence or absence of FLT3 inhibition as measured by Western blotting for γ-H2AX, a biomarker for DSBs (Fig. S1G). ATM function is not limited to the response to DSBs, and ATM has been shown to promote an antioxidant response through activation of glucose-6-phosphate dehydrogenase (G6PD), the rate-limiting enzyme of the pentose phosphate pathway (PPP) (15). It should be noted that G6PD was identified in the RNAi screen as being synthetic lethal, but did not qualify as a SLAM because it was only identified by a single shRNA. Thus, we examined whether inactivation of ATM influences the activity of G6PD in Molm13 cells. As shown in Fig. 2A, G6PD activity was suppressed by ATM knockdown and was further suppressed by inhibition of FLT3 with AC220, although not to the extent observed in a G6PD knockdown cell line. To determine if G6PD inactivation sensitizes Molm13 cells to cell killing on FLT3 inhibition, control or two different G6PD knockdown cell lines (sh1 and sh2; knockdown confirmed by Western blot analysis; Fig. S1C) were treated with AC220 for 72 h, and cell viability was assessed. Indeed, G6PD knockdown cells were significantly more sensitive to AC220 (Fig. 2B), phenocopying the effect of ATM knockdown, including enhanced apoptosis on AC220 treatment (Fig. 2C). Moreover, dehydroepiandrosterone (DHEA), an inhibitor of G6PD activity, synergized with both CEP-701 and AC220 in inducing cell death at most dose combinations tested (Fig. 2 D and E and Table S2). Similar results were obtained using the FLT3-ITD+ AML cell line MV4-11 (Fig. S2A and Table S2). Cell cycle analysis showed that, similar to ATM, inhibition of G6PD reduces G1 arrest (or quiescence) and increases apoptosis in combination with FLT3 inhibition (Fig. S2B). The sensitivity of cells to the combination of an ATM inhibitor or G6PD inhibitor together with a FLT3 inhibitor is reliant on expression of mutant FLT3, as these combinations were synergistic in 32D cells expressing FLT3-ITD but not in isogenic vector control cells (Fig. S2 D and E). To determine if overexpression of G6PD is sufficient to rescue the effects of ATM knockdown, Molm13 Ctrl or ATM knockdown (sh2) cells were transduced with empty vector or vector expressing G6PD and treated with AC220. As shown in Fig. 2F, G6PD was able reverse the enhanced loss of viability of ATM knockdown cells with AC220, as well as the increased apoptosis (Fig. S2C). Taken together, these data indicate that ATM and its key downstream effector G6PD promote the survival of FLT3-ITD+ AML cells on inhibition of FLT3.
Fig. 2.
Inhibition of G6PD sensitizes AML cells to FLT3 inhibitor-induced apoptosis. (A) The indicated Molm13 cell lines were treated with AC220 (triangle: 0, 1, 2, and 3 nM) for 20 h, and G6PD activity was assayed (values shown were normalized to cell number). (B) The indicated Molm13 cell lines were treated with AC220 (triangle: 0, 1, and 2 nM) for 72 h, and number of viable cells was counted by flow cytometry. (C) Molm13 cell lines were treated with AC220 (triangle: 0, 1, 2, and 3 nM), and apoptosis was measured by AnnexinV staining and flow cytometry. (D and E) Molm13 cells were treated with CEP-701 (D) or AC220 (E) and DHEA alone or in combination as indicated (triangle: 0, 10, 30, and 50 µM DHEA) for 72 h, and viable cells were counted. (F) Molm13 cell lines (ctrl or ATM sh2) were transduced with pLX304 (vector) or G6PD and treated with AC220 (triangle: 0, 1, 2, and 3 nM), and cell viability was measured after 72 h. For A–C, asterisks indicate statistical significance for comparisons of ctrl and ATM or G6PD knockdown cells under the same treatment conditions.
Fig. S2.
Inhibition of G6PD sensitizes AML cells to apoptosis induced by FLT3 inhibition. (A) MV4-11cells were treated with CEP-701 and DHEA alone or in combination as indicated (triangle: 0, 10, 30, and 50 µM DHEA) for 72 h, and viable cells were counted by flow cytometry. (B) Molm13 cells were treated with CEP-701 (20 nM) alone or in combination with 50 µM DHEA for 48 h and subjected to cell cycle analysis as described in Fig. S1F. (C) Molm13 cell lines (control or ATM sh2) transduced with pLX304 (vector) or G6PD were treated with AC220 (triangle: 0, 1, 2, and 3 nM), and apoptosis was measured by AnnexinV staining and flow cytometry. (D and E) 32D cells transduced with vector (MSCV-IRES-GFP) or expressing FLT3-ITD were treated with AC220 (nM) as indicated in combination with KU55933 (D; triangle: 0, 5, 7.5, and 10 µM) or DHEA (E; triangle: 0, 10, 30, and 50 µM) for 72 h, and viable cells were counted by flow cytometry.
AML Cellular Metabolism Is Substantially Altered by FLT3 Inhibition and Is Further Affected by Inhibition of ATM/G6PD.
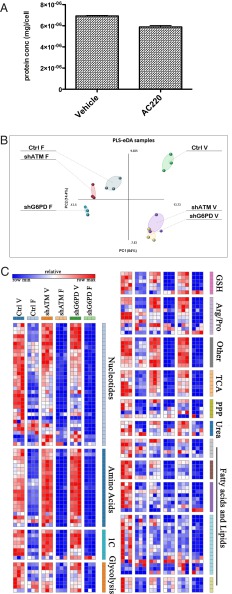
Given that ATM regulates G6PD activity and both factors are known to be involved in the regulation of metabolism, we wanted to determine what metabolic changes occur upon inhibition of these factors, especially in the context of concomitant FLT3 inhibition, as these changes may underlie the observed increase in cell killing. To this end, Molm13 control, ATM, or G6PD knockdown cell lines were treated with AC220 for 20 h, a time point that precedes the induction of apoptosis and before there are major reductions in cellular protein content elicited by AC220 (Fig. 3A). The cell extracts were subjected to whole metabolome profiling using ultra-performance LC-tandem MS (UPLC-MS/MS). Partial least squares enhanced discriminant analysis (PLS-eDA) showed tight clustering of ATM and G6PD knockdown cells, indicating significant metabolic similarities, whereas treatment with AC220 resulted in clustering of all three cell lines (Fig. 3B). AC220 treatment caused profound and global effects on metabolite levels, including severe decreases in anabolic substrates required for proliferation (nucleotides, amino acids, lipids), energy-related metabolites (glycolytic and TCA cycle intermediates), and metabolites involved in redox homeostasis (Fig. 3C and Fig. S3), indicating that FLT3 is a major driver of anabolic metabolism in FLT3-ITD+ AML cells. A large number of the metabolic changes elicited by FLT3 inhibition were further exacerbated in ATM and G6PD knockdown cells.
Fig. 3.
FLT3 inhibition causes broad metabolic changes in AML cells that are exacerbated by ATM or G6PD inactivation. (A) Molm13 cells were treated with vehicle (DMSO) or 2 nM AC220 for 20 h and counted via flow cytometry. Cell extracts were used for protein assay (Lowry) to determine protein concentration per cell. (B and C) Molm13 cell lines [Control (ctrl), ATM sh1 (shATM), or G6PD sh1 (shG6PD)] were treated for 20 h with vehicle (V) or with the FLT3 inhibitor AC220 (2 nM; F) in replicates of three. Cell extracts were subjected to metabolomic profiling using UPLC-MS/MS. PLS-eDA of the metabolomics data is shown (B). Heatmap showing variation in the metabolome of Molm13 cell lines treated with AC220 (C).
Fig. S3.
Detailed heatmap showing differential metabolite levels in Molm13 cell lines treated with AC220. Molm13 cell lines [Control (ctrl), ATM sh1 (shATM) or G6PD sh1 (shG6PD)] were treated for 20 h with vehicle (V) or with the FLT3 inhibitor AC220 (2 nM; F) in replicates of three. Cell extracts were subjected to metabolomic profiling using UPLC-MS/MS.
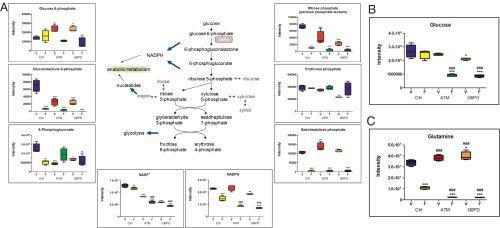
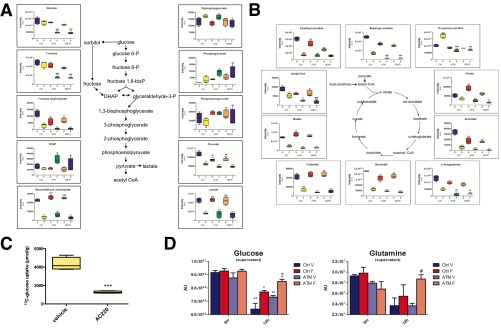
Examination of PPP metabolites revealed significant depletion of gluconolactone 6-phosphate, which is the direct product of G6PD, on inhibition of FLT3 (Fig. 4A). As expected, both ATM and G6PD knockdown caused significant accumulation of the G6PD substrate glucose 6-phosphate, as well as depletion of gluconolactone 6-phosphate. Similarly, levels of ribose phosphates (pentose phosphate isobars) were significantly reduced in ATM and G6PD knockdown cells relative to control cells and were further reduced on FLT3 inhibition. The reactions that produce gluconolactone 6-phosphate and ribulose 5-phosphate also generate NADPH, a key cofactor used in antioxidant defense. NADPH levels were largely maintained in ATM and G6PD knockdown cells, suggesting they are able to derive NADPH from other pathways. FLT3 inhibition caused significant reduction in NADPH levels in control cells, and this depletion was significantly greater in ATM and G6PD knockdown cells (Fig. 4A), indicating that AML cells become more dependent on the PPP for NADPH production on FLT3 inhibition. Another major metabolic pathway impeded by ATM/G6PD and FLT3 inhibition was glycolysis. Although glucose levels were largely maintained in control cells on FLT3 inhibition, they were significantly reduced in ATM and G6PD knockdown cells with FLT3 inhibition (Fig. 4B), implicating these factors in maintaining glucose homeostasis. Some glycolytic intermediates, such as fructose 1,6-biphosphate, glyceraldehyde 3-phosphate, and lactate, were severely reduced by FLT3 inhibition regardless of ATM/G6PD status (Fig. S4A), indicating a glycolytic blockade at an upstream step at the hexose phosphate level. The TCA cycle was also markedly affected by FLT3 inhibition, including severe reductions in acetyl-CoA, α-ketoglutarate, succinate, fumarate, and malate (Fig. S4B). Some of these components, such as acetyl-CoA and α-ketoglutarate, were significantly further reduced in ATM and G6PD knockdown cells.
Fig. 4.
PPP and glucose/glutamine metabolism are impaired on FLT3 and ATM/G6PD inhibition. Metabolomic analysis was performed as described in Fig. 3 by UPLC-MS/MS. (A) PPP metabolite levels in Molm13 cell lines treated with AC220 (pentose phosphate isobars: ribulose 5-phosphate, ribose 1-phosphate, ribose 5-phosphate, and xylulose phosphate). (B and C) Glucose (B) and glutamine (C) levels in Molm13 cell lines treated with AC220. Asterisks indicate statistical significance (ANOVA; *P ≤ 0.05, **P ≤ 0.01, ***P ≤ 0.001) for comparisons of all samples to vehicle-treated control cells, and pound signs indicate statistical significance (#P ≤ 0.05, ##P ≤ 0.01, ###P ≤ 0.001) for comparisons of ATM or G6PD knockdown cells to control cells under the same treatment conditions.
Fig. S4.
FLT3 inhibition causes severe alterations in central carbon metabolism. (A and B) Molm13 cells lines were treated and analyzed as described in Fig. S3 for glycolytic metabolites (A) and TCA cycle metabolites (B). (C) Molm13 cells were treated with vehicle or 3 nM AC220 for 24 h and labeled with 13C-glucose during the final 6 h of treatment followed by measurement of intracellular 13C-glucose by NMR. (D) Molm13 cell lines were treated with 2 nM AC220 for 12 h followed by incubation in fresh media containing 2 g/L glucose (replicates of 3) for 5 min or 24 h and glucose and glutamine levels in cell supernatants were measured using UPLC-MS/MS. Asterisks indicate statistical significance (ANOVA; *P ≤ 0.05, **P ≤ 0.01, ***P ≤ 0.001) for comparisons of all samples to vehicle-treated control cells, and pound signs indicate statistical significance (#P ≤ 0.05, ##P ≤ 0.01, ###P ≤ 0.001) for comparisons of ATM or G6PD knockdown cells to control cells under the same treatment conditions (A, B, and D). Asterisks indicate statistical significance (t test; ***P ≤ 0.001) for comparison of vehicle- and AC220-treated cells (C).
A large number of the metabolic effects of FLT3 inhibition may be attributed to a substantial shutdown of central carbon metabolism, i.e., the inability to use carbon sources such as glucose and glutamine to generate necessary precursors for biomass and energy production via glycolysis and the TCA cycle. Although glucose levels were largely maintained on FLT3 inhibition in Molm13 control cells, NMR analysis of 13C labeled glucose showed a clear defect in glucose uptake with AC220 in Molm13 cells (Fig. S4C). Thus, decreased glucose utilization, due to impairment of both the PPP and glycolytic pathways, likely accounts for why glucose fails to be depleted on FLT3 inhibition. Similarly, MS analysis of Molm13 cell supernatants showed decreased uptake of glucose on FLT3 inhibition that is further exacerbated in ATM knockdown cells (Fig. S4D), which could account for the reduced glucose levels observed in ATM/G6PD knockdown cells treated with AC220. Additionally, uptake of glutamine was impaired on FLT3 inhibition and further impaired with ATM knockdown. Examination of steady-state glutamine levels after FLT3 inhibition showed a marked depletion of glutamine, which was further exacerbated by either ATM or G6PD knockdown (Fig. 4C). Taken together, the metabolomic data suggest that many aspects of central carbon metabolism in Molm13 cells are substantially suppressed when FLT3 is inhibited and that ATM and G6PD act to help support central carbon metabolism through maintenance of glucose and glutamine levels on FLT3 inhibition.
Glutathione Metabolism Is Impaired on FLT3 Inhibition and Further Impaired by ATM/G6PD Inhibition.
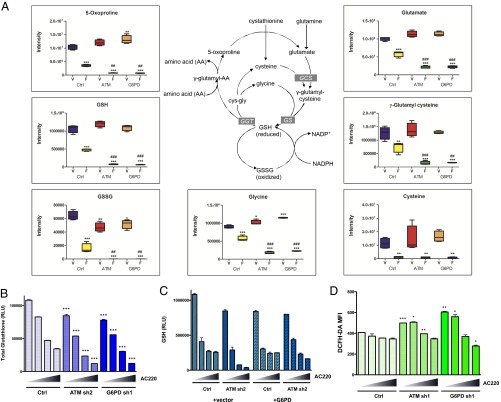
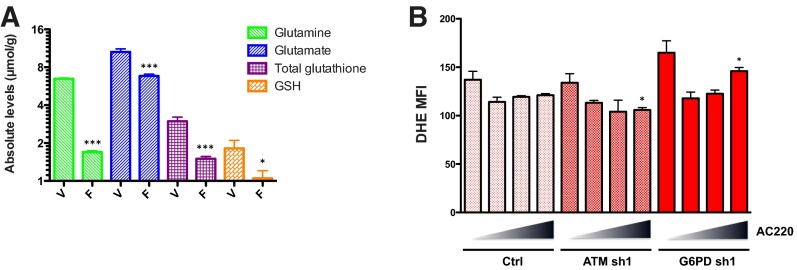
Although numerous metabolic pathways in Molm13 cells were affected by FLT3 inhibition, one of the pathways most severely affected was that of glutathione metabolism. As shown in Fig. 5A, levels of the reduced form of glutathione (GSH), a major antioxidant factor, were substantially decreased in Molm13 control cells on FLT3 inhibition and further decreased in ATM and G6PD knockdown cells. Likewise, levels of oxidized glutathione (GSSG) and 5-oxoproline, a product of GSH degradation, were similarly decreased. Thus, the observed depletion of GSH cannot simply be explained by a defect in NADPH-dependent glutathione recycling, which would predict an accumulation of GSSG, or increased turnover, which would correspond to increases in intermediates and byproducts of the γ-glutamyl cycle: 5-oxoproline and glutamate. Decreases in the total glutathione pool (GSH+GSSG) are instead consistent with a defect in glutathione synthesis. Indeed, the precursors of glutathione, glutamate and γ-glutamyl cysteine, were depleted on FLT3 inhibition and further depleted with ATM and G6PD inactivation, reflective of the changes observed with glutamine and consistent with glutamate being derived from glutamine through glutaminolysis. The other precursors of glutathione, cysteine and glycine, were similarly decreased on FLT3 inhibition. NMR analysis confirmed decreases in glutamine, glutamate, and glutathione in Molm13 cells on AC220 treatment (Fig. S5A). Measurement of total glutathione levels using a luminescent-based assay showed a dose-dependent effect of AC220 on glutathione depletion in Molm13 control cells that was more severe in the ATM and G6PD knockdown cells (Fig. 5B). Moreover, overexpression of G6PD was able to rescue the enhanced depletion of glutathione in ATM knockdown cells (Fig. 5C). In summary, multiple experiments support the conclusion that glutathione anabolism is compromised in Molm13 cells on FLT3 inhibition and further compromised by inactivation of ATM or its effector G6PD.
Fig. 5.
Glutathione metabolism is impaired on FLT3 inhibition and further impaired by ATM/G6PD inactivation. Metabolomic analysis was performed as described in Fig. 4 by UPLC-MS/MS. (A) Glutathione metabolites in Molm13 cell lines treated with AC220. Asterisks indicate statistical significance (ANOVA; *P ≤ 0.05, **P ≤ 0.01, ***P ≤ 0.001) for comparisons of all samples to vehicle-treated control cells, and pound signs indicate statistical significance (#P ≤ 0.05, ##P ≤ 0.01, ###P ≤ 0.001) for comparisons of ATM or G6PD knockdown cells to control cells under the same treatment conditions. (B) Molm13 cell lines were treated with AC220 (triangle: 0, 1, 2, and 3 nM) for 24 h and glutathione levels were measured using a luminescence based assay (RLU: relative light units; normalized to cell number). (C) Molm13 cell lines were treated with AC220 as in B and glutathione (GSH) levels were measured. (D) Molm13 cell lines were treated with AC220 as in B for 20 h and ROS levels were measured using the fluorogenic dye DCFH-DA (MFI: mean fluorescence intensity) by flow cytometry. For B and D, asterisks indicate statistical significance (t test; *P ≤ 0.05, **P ≤ 0.01, ***P ≤ 0.001) for comparisons of control and knockdown cells under the same treatment conditions.
Fig. S5.
FLT3 inhibition decreases glutathione levels but does not substantially affect global ROS levels. (A) Molm13 cells were treated with vehicle (V) or AC220 (F) as described in Fig. S4C, and levels of glutamine, glutamate, reduced glutathione (GSH), and oxidized glutathione (GSSG) were measured by NMR. (B) Molm13 cell lines were treated with AC220 (triangle: 0, 1, 2, and 3 nM) for 20 h, and superoxide levels were measured using the fluorogenic dye DHE by flow cytometry. Asterisks indicate statistical significance (t test; *P ≤ 0.05) for comparisons of ctrl and knockdown cells under the same treatment conditions.
Given that glutathione is a critical antioxidant factor that maintains redox homeostasis in most cells, one would predict that the glutathione depletion elicited by FLT3 inhibition would lead to high levels of oxidative stress, which could potentially be a major cause of cell death. To examine this possibility, Molm13 control, ATM, or G6PD knockdown cell lines were treated with AC220 for 20 h, and total ROS levels were measured by staining with DCFH-DA followed by flow cytometry. Surprisingly, ROS levels were not significantly changed on treatment with AC220 (Fig. 5D). Although ROS levels were elevated to a significant extent in both ATM and G6PD knockdown cells, ROS levels actually went down on treatment with AC220. Similar results were obtained using the ROS indicator dye dihydroethidium (DHE), which specifically detects total superoxides (Fig. S5B). Thus, despite overwhelming evidence that FLT3 inhibition greatly decreases glutathione, effects on ROS, at least at the global level, cannot account for the apoptosis caused by FLT3 inhibition or the influence of ATM and G6PD.
FLT3 Inhibition Causes Severe Accumulation of Mitochondrial ROS That Is Exacerbated by ATM/G6PD Inhibition.
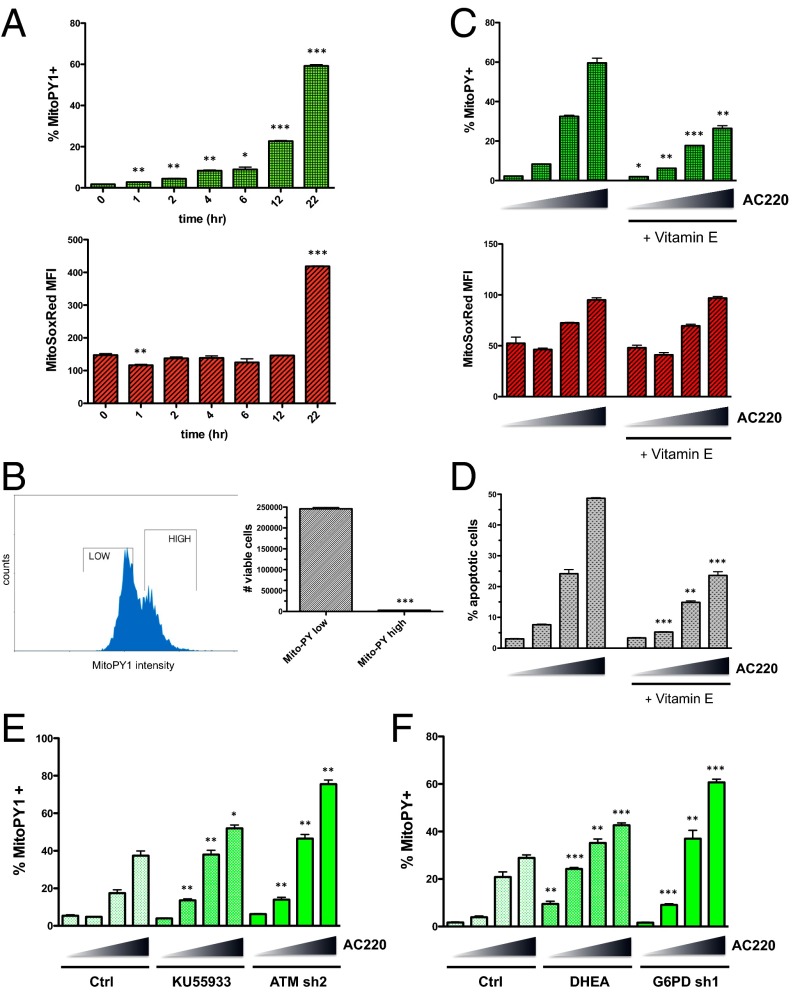
Our results indicate that inhibition of FLT3 and subsequent depletion of glutathione in FLT3-ITD+ AML cells does not significantly affect global ROS levels. However, given recent evidence showing that ATM is functional in the mitochondria and is implicated in controlling mitochondrial ROS (16–18), we explored the possibility that FLT3 inhibition induces oxidative stress specifically in the mitochondria. To this end, we used the ROS indicator MitoPY1, a fluorescent dye that is targeted to the mitochondria and is used to detect levels of hydrogen peroxide within this compartment (19). As shown in Fig. 6A, treatment of Molm13 cells with AC220 led to substantial accumulation of mitochondrial peroxides over time, with increased detection evident as early as 1 h after initiation of treatment. Use of the ROS indicator dye MitoSOX Red, which specifically detects superoxides in the mitochondria, showed a dramatic increase in mitochondrial superoxides with AC220; however, it was not until 22 h after initiation of treatment (Fig. 6A). This observation could indicate that mitochondrial superoxides are efficiently dismutated into hydrogen peroxide until they reach a certain threshold where superoxide production overwhelms the system.
Fig. 6.
FLT3 inhibition elicits accumulation of mitochondrial ROS that causes apoptosis and is exacerbated by ATM/G6PD inhibition. (A) Molm13 cells were treated with AC220 (3 nM) for the indicated times, and mitochondrial ROS levels were measured using the mitochondria-targeted fluorogenic dyes MitoPY1 (for peroxides) and MitoSox Red (for superoxides). Asterisks indicate statistical significance for comparisons of treated vs. untreated (0 h) cells. (B) Molm13 cells were treated with AC220 (2 nM) for 20 h, stained using MitoPY1, and sorted based on fluorescence intensity. “High” and “Low” MitoPY1 populations were reseeded at the same density, and viable cells were counted after 72 h of additional culture. (C) Molm13 cells ± vitamin E treatment (2 mM; 3-h pretreatment) were treated with AC220 (triangle: 0, 1, 2, and 3 nM) for 20 h, and ROS levels were measured using MitoPY1 and MitoSox Red. (D) Molm13 cells were treated as in C for 48 h, and apoptosis was measured by Annexin V staining and flow cytometry. (E and F) Molm13 cell lines were treated with AC220 (triangle: 0, 1, 2, and 3 nM) for 20 h with or without cotreatment (of control cells) with KU55933 (E) or DHEA (F), and mitochondrial ROS levels were measured using MitoPY1. For C–F, asterisks indicate statistical significance for comparisons of Vitamin E-treated, KU55933-treated, DHEA-treated, or knockdown cells, with control cells under the same AC220 treatment conditions.
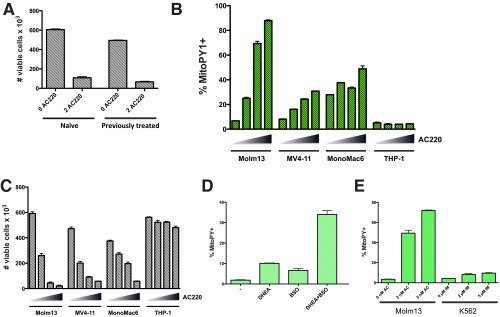
To determine if the observed phenomenon of increased mitochondrial ROS has implications for cell survival, cells were treated with AC220 for 20 h, MitoPY1 “low” and “high” subpopulations (defined as the ∼40% dimmest and brightest dye fluorescence) were sorted and reseeded at the same concentration in drug-free media, and viability was assessed after 72 h. Whereas surviving cells in the MitoPY1 high subpopulation were almost completely undetectable, cells in the MitoPY1 low subpopulation retained the ability to survive and proliferate (Fig. 6B). It is worth noting that Molm13 cells treated for 72 h with AC220 and then allowed to recover for 4 d were just as sensitive to retreatment with AC220 as the original population (Fig. S6A), indicating that resistance displayed by the mitochondrial ROS low subset is transient and these cells do not represent a stable subpopulation. Pretreatment of Molm13 cells with the lipophilic antioxidant vitamin E significantly suppressed the levels of mitochondrial peroxides induced by AC220 treatment but not superoxides (Fig. 6C), and resulted in substantial inhibition of apoptosis (Fig. 6D). AC220 treatment of other FLT3-dependent cell lines, MV4-11 (FLT3-ITD+) and Mono-Mac-6 (FLT3-V592A), but not FLT3 WT THP-1, caused significantly increased levels of mitochondrial peroxides (Fig. S6B), which inversely correlated with cell viability (Fig. S6C). All together, these data suggest that high mitochondrial peroxide levels are causative in apoptosis on FLT3 inhibition in FLT3-ITD+ AML cells.
Fig. S6.
FLT3 inhibition elicits accumulation of mitochondrial ROS in multiple FLT3-ITD+ cell lines. (A) Molm13 cells were treated with 2 nM AC220 for 72 h, and surviving cells were allowed to recover in drug-free media for 4 d. These cells (previously treated) or Molm13 cells that had not been previously treated with AC220 (naive) were seeded at the same density and treated with 2 nM AC220 for 72 h, and cell viability assessed by flow cytometry. (B and C) The indicated AML cell lines were treated with AC220 (triangle: 0, 1, 2, and 3 nM) for 20 h, and mitochondrial ROS levels were measured using MitoPY1 (A), and cell viability was assessed (based on PI exclusion) after 48 h by flow cytometry (B). (D) Molm13 cells were untreated or treated with BSO (150 μM) and DHEA (50 μM) alone or in combination for 20 h, and mitochondrial ROS levels were measured using MitoPY1. (E) Molm13 cells or K562 cells were treated with AC220 (AC) or imatinib (IM) at the indicated doses for 20 h, and mitochondrial ROS levels were measured using MitoPY1.
Although inhibition of glutathione synthesis (with BSO) or inhibition of the PPP (with DHEA) were both sufficient to increase levels of mitochondrial ROS, inhibition of both was required to majorly elevate ROS levels, to the extent that reflects FLT3 inhibition (Fig. S6D). Notably, increased mitochondrial ROS is not a universal consequence of all TKIs, as treatment of K562 CML with high doses of the BCR-ABL TKI imatinib that are known to cause apoptosis (20, 21) failed to cause substantial induction of mitochondrial ROS (Fig. S6E).
Finally, inhibition of ATM either using the ATM inhibitor KU55933 or genetic knockdown caused further increases in mitochondrial ROS on FLT3 inhibition with AC220 (Fig. 6E). Similarly, inhibition of G6PD using either the G6PD inhibitor DHEA or genetic knockdown exacerbated mitochondrial ROS induced by AC220 (Fig. 6F). Thus, there is a strong correlation between increased mitochondrial ROS, decreased glutathione levels, and the increased apoptosis observed with either ATM or G6PD inhibition. These data further support the conclusion that mitochondrial ROS are causative in FLT3 inhibitor-induced apoptosis. Moreover, they implicate ATM and G6PD as key mediators of mitochondrial redox homeostasis and survival of a subpopulation of FLT3-ITD+ AML cells on treatment with FLT3 inhibitors.
A Mitochondrial Pro-Oxidant Drug Cooperates with a FLT3 Inhibitor in Eliminating FLT3-ITD+ AML Cells in Vitro and in Vivo.
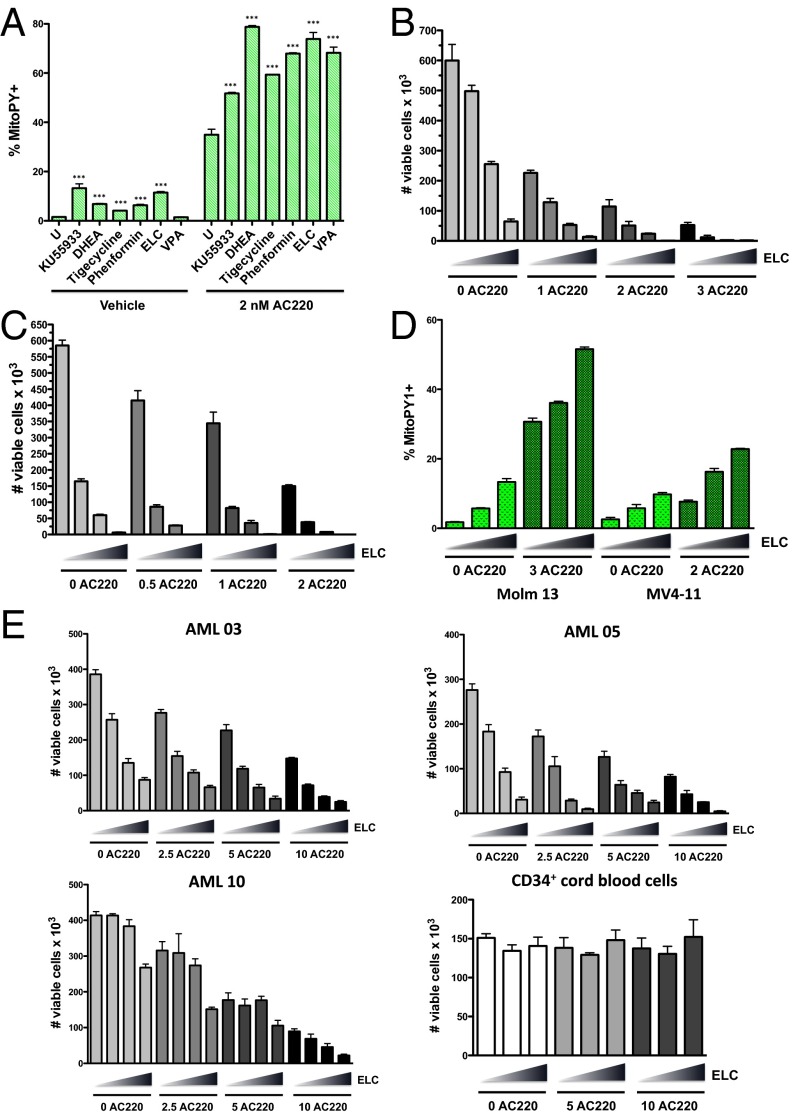
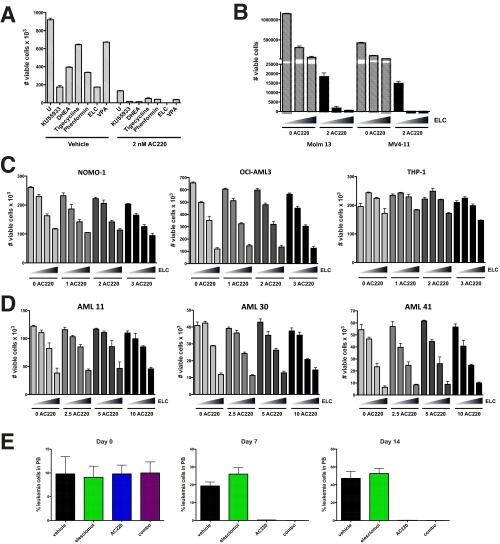
Our data demonstrate that a proportion of AML cells are able to survive FLT3 inhibitor induced apoptosis and that this is associated with the ability of these cells to maintain lower levels of mitochondrial ROS through the actions of ATM and G6PD. Although these data advocate the targeting of ATM or G6PD as a therapeutic strategy to improve the efficacy of FLT3 inhibitors in treating FLT3-dependent AML, clinically viable drugs directly targeting these factors are not yet available. However, if increased mitochondrial ROS could be achieved using alternative means, it could be quite effective in enhancing AML cell killing. To explore this therapeutic strategy, we tested the effects of several drugs known or suspected to cause mitochondrial oxidative stress in leukemia cells, including phenformin and elesclomol (electron transport chain inhibitors) (22, 23), tigecycline (inhibitor of mitochondrial translation) (24), and valproic acid (shown to impair ATM levels and induce ROS) (25) for their ability to augment mitochondrial ROS production when combined with FLT3 inhibitor AC220 in Molm13 cells. Elesclomol at nanomolar concentrations was shown to be as effective as ATM or G6PD inhibitors (KU5593 or DHEA) at inducing mitochondrial ROS (Fig. 7A) and reducing cell viability (Fig. S7A) in combination with AC220 and thus was chosen for further study. Elesclomol, which has been evaluated in clinical trials for melanoma, has been shown to selectively transport copper into the mitochondria, to disrupt multiple components of the electron transport chain, and to promote overproduction of mitochondrial ROS (26–28). In combination with AC220, elesclomol caused synergistic cell killing in both Molm13 cells and MV4-11 cells (Fig. 7 B and C and Table S2). Elesclomol treatment caused a dose-dependent increase in mitochondrial peroxide levels in both Molm13 and MV4-11 cells in combination with AC220 (Fig. 7D), which correlated with decreased cell viability (Fig. S7B). Moreover, this drug combination caused synergistic reductions in cell viability in multiple primary FLT3-ITD+ AML patient samples, most notably at higher drug concentrations (Fig. 7E and Table S2). In contrast, AC220/elesclomol was not synergistic in killing FLT3 WT AML cell lines (NOMO-1, OCI-AML3, or THP-1; Fig. S7C), FLT3 WT primary samples (AML 11 and 41; Fig. S7D), or FLT3 D835 mutant AML (AML 30; Fig. S7D), a mutation that prevents binding of AC220, strongly arguing that efficacy of the drug combination is not due to off-target effects of AC220. These results demonstrate that elesclomol can be effective at enhancing FLT3-ITD+ AML cell elimination with a FLT3 inhibitor, at least in vitro.
Fig. 7.
Pro-oxidant drug elesclomol cooperates with a FLT3 inhibitor in eliminating FLT3-ITD+ AML cells in vitro. (A) Molm13 cells were left untreated (U) or treated with the indicated drug alone or in combination with AC220 (2 nM) for 20 h; KU55933 (10 µM), DHEA (40 µM), tigecycline (5 µM), phenformin (40 µM), elesclomol (ELC; 40 nM), and valproic acid (VPA; 1 mM). Mitochondrial ROS levels were measured using MitoPY1. Asterisks indicate statistical significance for comparisons of ROS drug treated cells vs. untreated cells (with or without AC220). (B) Molm13 cells were treated with AC220 and elesclomol alone or in combination as indicated (triangle: 0, 10, 20, and 40 nM elesclomol) for 72 h, and viable cells were counted by flow cytometry. (C) MV4-11 cells were treated with AC220 and elesclomol, and cell viability was measured as in B. (D) Molm13 or MV4-11 cells were treated with AC220 and elesclomol alone or together as indicated (triangle: 0, 20, and 40 nM elesclomol), and mitochondrial ROS levels were measured using MitoPY1. (E) Human FLT3-ITD+ primary AML samples or CD34+ cord blood cells were treated in vitro with AC220 (nM) and elesclomol at the indicated concentrations (triangle: 0, 10, 20, and 40 nM elesclomol or 0, 20, and 40 nM for cord blood cells), and viable cells were counted by flow cytometry after 72 h.
Fig. S7.
Elesclomol cooperates with a FLT3 inhibitor in eliminating FLT3-ITD+ AML cells in vitro and in vivo. (A) Molm13 cells were left untreated (U) or treated with the indicated drug alone or in combination with AC220 for 20 h; KU55933 (10 μM), DHEA (40 μM), tigecycline (5 μM), phenformin (40 μM), elesclomol (ELC; 40 nM), valproic acid (VPA; 1 mM). Viable cells (PI−) were counted by flow cytometry. (B) Molm13 or MV4-11 cells were treated with AC220 and elesclomol alone or together as indicated (triangle: 0, 20, and 40 nM elesclomol) for 72 h, and viable cells were counted by flow cytometry. (C) FLT3 WT AML cell lines NOMO-1, OCI-AML3, or THP-1 were treated with AC220 and elesclomol alone or together as indicated (triangle: 0, 10, 20, and 40 nM elesclomol) for 72 h, and viable cells were counted by flow cytometry. (D) Human primary AML samples AML 11 (FLT3 WT), AML 30 (FLT3 D835), or AML 41 (very low FLT3-ITD) were treated in vitro with AC220 (nM) and elesclomol at the indicated concentrations (triangle: 0, 10, 20, and 40 nM elesclomol), and viable cells were counted by flow cytometry after 72 h. (E) NSG mice were engrafted with primary FLT3-ITD+ leukemia, and groups of mice (n = 5) were treated with vehicle, elesclomol (50 mg/kg), AC220 (10 mg/kg), or elesclomol, and AC220. Leukemic burden was monitored weekly by peripheral blood (PB) draws and quantitation of leukemic cells (human CD45+, HLA-ABC+ cells) by flow cytometry.
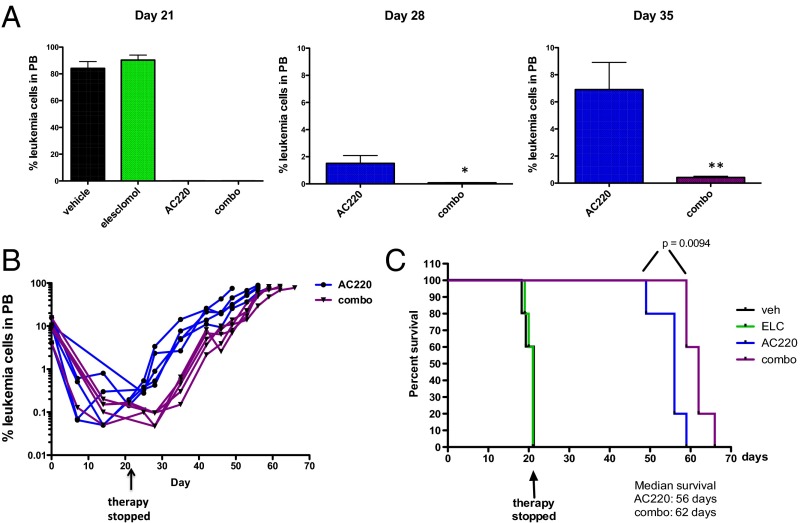
To test the efficacy of elesclomol combined with a FLT3 inhibitor in vivo, we used a patient-derived xenograft model of FLT3-ITD+ AML. Primary leukemic cells from a patient with FLT3-ITD+ AML were engrafted into NSG mice, and after mean leukemic burden in the peripheral blood reached ∼10%, therapy was initiated using vehicle, elesclomol, AC220, or elesclomol and AC220 in combination (n = 5/group). Although elesclomol was ineffective by itself, leukemia cells in the peripheral blood became undetectable in the AC220 and combination groups after 1 wk of therapy (Fig. S7E) and remained so until day 21 (Fig. 8A), at which point the mice were taken off therapy. It should be noted that no hematopoietic or other toxicities were observed over the course of therapy. On days 28 and 35, relapses in the AC220 monotherapy group were evident, whereas leukemia in the combination group remained low/undetectable (Fig. 8A). Fig. 8B shows that, after cessation of therapy, leukemic burden remained lower in the combination group compared with the AC220 group throughout the course of the experiment, demonstrating that a deeper remission was achieved. Moreover, the combination therapy extended survival of mice by ∼1 wk compared with AC220 therapy alone (Fig. 8C). Although the survival improvement was modest with short-term therapy, these data demonstrate the potential of using a pro-oxidant drug as adjuvant therapy for improving the efficacy of FLT3 inhibitors in the treatment of FLT3-ITD+ AML. Other pro-oxidant adjuvant therapies are currently being explored. The same therapeutic strategy should be applicable to other tumor types where inhibition of the driving oncogene compromises glutathione metabolism and impairs mitochondrial redox homeostasis.
Fig. 8.
Elesclomol cooperates with a FLT3 inhibitor in eliminating FLT3-ITD+ AML cells in vivo. NSG mice were engrafted with primary FLT3-ITD+ leukemia, and groups of mice (n = 5) were treated with vehicle, elesclomol (50 mg/kg), AC220 (10 mg/kg), or elesclomol and AC220 in combination for 21 d. (A) Leukemic burden was monitored weekly by peripheral blood (PB) draws and quantitation of leukemic cells (human CD45+, HLA-ABC+ cells) by flow cytometry on the indicated day after therapy is shown. (B) Weekly monitoring of leukemic burden in PB indicates a deeper response in combination-treated mice relative to AC220-treated mice. (C) Kaplan–Meier curves showing survival of mice receiving the indicated therapy. Statistical significance determined using the log-rank (Mantel–Cox) test.
Discussion
The promise of molecularly targeted cancer therapies has generated substantial excitement in recent years with the clinical success of TKIs targeting oncogenic driver proteins, including BCR-ABL for the treatment of chronic myeloid leukemia, EGFR and ALK for non–small-cell lung cancer, HER2 for breast cancer, BRAF for melanoma, and FLT3 for AML, among others (29). However, for most TKIs, including those targeting FLT3, the therapeutic benefit is transient due to development of resistance and relapse, reflecting the inability of TKI therapy to sufficiently eradicate the tumor cells. The effectiveness of oncogene-targeted therapy relies on a concept called “oncogene addiction,” the phenomenon where some tumors, despite having an array of genetic abnormalities, are dependent on a single dominant oncogene for growth and survival (30). Although there have been myriad studies exploring the use of oncogene-targeted therapies that exploit the concept of oncogene addiction for treating various cancers, only a modicum of these studies have attempted to explain the precise mechanism by which oncogene inactivation causes tumor cell ablation. The data presented here demonstrate that acute inhibition of FLT3 results in severe metabolic deficiencies, including depletion of glutathione, leading to high levels of mitochondrial ROS that promote apoptosis. Thus, “FLT3 addiction” in AML could be explained, at least partly, by the reliance of tumor cells on FLT3 driven metabolism for maintenance of mitochondrial redox homeostasis that is essential for cell survival.
It has long been appreciated that cancer cells are characterized by an increased rate of ROS production relative to normal cells and an altered redox state (31). Oncogenes have been shown to promote highly anabolic cellular metabolism and the production of ROS, which can contribute to the tumorigenic process through the activation of various signaling pathways that control cellular growth and proliferation (32); however, excessive levels of ROS can also induce apoptosis (33). Indeed, there is also evidence that oncogenes actively up-regulate antioxidant mechanisms to avoid this fate (34). There has recently been extensive focus on exploring ways to exploit the altered redox state of tumor cells through the use of pro-oxidant therapies, thus far with limited success, at least as monotherapy (35–37). Mitochondria are the major source of ROS in most cells and are highly dependent on mitochondrial antioxidant defenses, such as glutathione peroxidase (about one third of glutathione peroxidase is mitochondrial) to avoid their deleterious effects (38). Given our data showing that FLT3 inhibition causes a severe decrease in glutathione levels in AML cells, it is not surprising that this results in a severe increase in ROS in the mitochondria.
Glutathione represents the major ROS detoxification system in cells, and the idea of targeting glutathione as an anticancer strategy has been explored for several tumors, including AML (35). CD34+ AML cells were found to have aberrant glutathione metabolism and were sensitive to therapies that further disrupted the glutathione pathway, such as parthenolide and piperlongumine, and it was proposed that AML cells are addicted to glutathione (39). Our results in FLT3-ITD+ AML cells support this hypothesis, because FLT3 inhibitors were shown to deplete glutathione, which correlated with increased mitochondrial ROS and the induction of apoptosis. Moreover, our data strongly support the therapeutic strategy of promoting mitochondrial ROS in combination with FLT3 inhibition. We have shown that FLT3-ITD+ AML cells that survive FLT3 inhibition have lower levels of mitochondrial ROS. However, these cells may still be on the brink of ROS induced apoptosis and thus hypersensitive to any further oxidative stress. Because glutathione metabolism is driven by FLT3 in FLT-ITD+ AML cells, but not in normal cells, FLT3 inhibitors should not perturb glutathione levels in normal cells. Furthermore, FLT3 inhibited AML cells may be sensitive to mitochondrial pro-oxidant therapies at doses that would be innocuous to normal cells.
Our data show that one avenue for elevating mitochondrial ROS levels is through inhibition of ATM. ATM is well known for its roles in mediating the DNA damage response (40); however, a plethora of recent data implicate ATM as a first responder to a variety of cellular stresses (41). Several studies have demonstrated a role for ATM in the response to oxidative stress (13). It has been shown that oxidation of ATM directly leads to its activation (42) and that ATM activates G6PD to reroute glucose into the PPP for the production of NADPH to combat oxidative stress (15). In accordance with these studies, we showed that ATM inactivation impairs G6PD activity in AML cells and further reduces NADPH levels on FLT3 inhibition. However, effects on NADPH are insufficient to explain the observed further depletion of total glutathione and its glutamine-derived precursors in ATM/G6PD knockdown cells on FLT3 inhibition, which is indicative of impaired de novo glutathione synthesis. We show that ATM inactivation has widespread effects on cellular metabolism in the context of FLT3 inhibition, engendering a primary defect in central carbon metabolism. ATM has numerous substrates in the cell, and the metabolic effects of ATM inactivation could possibly be explained through its regulation of metabolic effectors such as AKT, AMPK and mTORC1 (43, 44). However, the metabolic effects of ATM knockdown were largely mimicked by G6PD knockdown, implicating G6PD as the major metabolic effector downstream of ATM. Indeed, knockdown of either ATM or G6PD in the context of FLT3 inhibition caused further decreases in intracellular glucose and glutamine, major sources for central carbon metabolism. It has previously been shown that a proportion of ATM is localized in the mitochondria and that ATM deficiency is associated with increased mitochondrial ROS (16–18), consistent with our data from AML cells. Together, these results suggest a model in which ATM acts as a sentinel for mitochondrial ROS, activating G6PD and the PPP when ROS levels become excessive, such as on FLT3 inhibition, to quell oxidative stress through up-regulation of glutathione metabolism and possibly other pathways.
The effects of FLT3 inhibition on AML cellular metabolism have not previously been explored. Our data strongly argue that FLT3 is a major driver of anabolic metabolism, consistent with the normal role of FLT3 in promoting the robust proliferation of early hematopoietic progenitor cells (45). Many tumor cells are highly dependent on glutamine for glutaminolysis, a mitochondrial pathway producing glutamate, which can then be converted into α-ketoglutarate to fuel the TCA cycle or used as a precursor for glutathione synthesis (46, 47). Deficient glutamine uptake could account for the decline in glutamine/glutamate levels we observed in AML cells on FLT3 inhibition and the impaired glutathione production that makes them hypersensitive to oxidative stress. This same phenomenon may occur in other tumors that are driven by oncogenes that promote glutamine uptake and catabolism, i.e., inactivation of the driving oncogene could lead to defective glutamine metabolism and subsequent glutathione depletion, making the cells highly vulnerable to oxidative stress. Thus, the strategy of using a pro-oxidant agent as an adjuvant to oncogene-targeted therapy could be broadly applicable for the improved treatment of many tumors.
Materials and Methods
Cell Culture and Generation of Cell Lines.
The AML cell lines Molm13 and MV4-11 (FLT3-ITD+), EOL-1 (FLT3WT but FLT3-dependent) (48), NOMO-1, OCI-AML3, and THP-1 were obtained from D. Graham (University of Colorado, Aurora, CO). MonoMac6 (FLT3V592A) was obtained from K. Bernt (University of Colorado, Aurora, CO). Cells were cultured in RPMI medium 1640/10% (vol/vol) FBS. 32D cell lines were obtained from C. Porter (University of Colorado, Aurora, CO) and cultured as described previously for Ba/F3 cells (49). For generation of shRNA-expressing cell lines, lentivirus was produced using pLKO.1 constructs (obtained from The Functional Genomics Facility at CU Boulder), transductions were performed as described previously (49) and cells were selected and maintained in puromycin (2.0 µg/mL). Cell lines expressing G6PD were generated similarly using pLX304 constructs and with selection in 10 µg/mL blasticidin. Cell lines were authenticated by short tandem repeat examination and tested negative for mycoplasma using the e-Myco plus PCR Detection Kit (iNtRON).
Cell Viability Assays.
Cells were seeded at 0.5–1.0 × 10⁵/mL in triplicate wells of 48-well tissue culture plates. Where indicated, the cells were treated with drug for a period of 24–72 h. After treatment, a sample of cells from each well was stained with PI (10 µg/mL), and viable cells (PI−) were counted with a flow cytometer (Guava easyCyte 8HT). Alternatively, cells were stained using 7-AAD/anti-Annexin V (Nexin reagent; Millipore EMD) to detect apoptotic cells.
Western Blots.
Western blot analysis was performed as described previously (49) using the following antibodies: ATM (11G12; Santa Cruz), G6PD (#8866; Cell Signaling), Tubulin-α (Ab-2, DM1A; NeoMarkers), and Phospho-H2AX (MA1-2022; Pierce).
Cell Metabolic Assays.
To measure G6PD activity, the G6PD Activity Assay (Cell Signaling) was used according to the manufacturer's instructions. To measure glutathione levels, the GSH/GSSG-Glo or GSH-Glo Assay (Promega) was used according to the manufacturer's instructions.
Metabolomics Analysis.
Metabolomics analyses were performed as previously reported (50). Briefly, 2 × 10⁶ cells and 20 µL cell media were extracted in 1.0 mL and 980 µL cold lysis/extraction buffer (methanol:acetonitrile:water 5:3:2), respectively. After discarding protein pellets, water- and methanol-soluble fractions were run through a hydrophilic interaction liquid chromatography and C18 reversed phase column (phase A: water, 0.1% formic acid; phase B: acetonitrile, 0.1% formic acid; Phenomenex) through an ultra-high performance chromatographic system (Ultimate 3000; Thermo Fisher). UPLC was coupled on line with a high-resolution quadrupole Orbitrap instrument run in either polarity modes (QExactive; Thermo Fisher) at 140,000 resolution (at 200 m/z). Metabolite assignment and peak integration for relative quantitation were performed through the software Maven (Princeton), against the Kyoto Encyclopedia of Genes and Genomes pathway database and an in-house validated standard library (>650 compounds; Sigma Aldrich; IROATech). Integrated peak areas were exported into Excel (Microsoft) and elaborated for statistical analysis (t test, ANOVA) and hierarchical clustering analysis (HCA) through Prism (GraphPad Software) and GENE E (Broad Institute), respectively.
ROS Measurements.
Cells (1 × 10⁵) were treated with drug as indicated, washed in PBS, resuspended in 150 µL 5 µM dichloro-dihydro-fluorescein diacetate (DCFH-DA), 10 µM DHE, 5 µM MitoSox Red, or 10 µM MitoPY1 in serum-free media, and incubated at 37 °C for 15–60 min. Cells were washed in cold FACS buffer, resuspended in FACS buffer, and immediately analyzed by flow cytometry. All dyes were from Molecular Probes/Life Technologies except MitoPY1 (Tocris Bioscience).
Mouse Experiments.
NOD.Cg-Prkdcscid Il2rgtm1Wjl/SzJ (NSG) mice were obtained from The Jackson Lab and bred in-house. The patient sample for xenograft (obtained from D. Pollyea, University of Colorado, Aurora, CO) came from a 54-y-old female with AML expressing FLT3ITD and NPM1 mutations. Four-to 6-wk-old female NSG mice were pretreated with 25 mg/kg busulfan delivered by i.p. injection. After expansion in vivo, the secondary leukemia was harvested from the spleen and bone marrow and subsequently transplanted into 6- to 10-wk-old female NSG mice for drug treatment; 5 × 10⁵ cells were injected i.v., and treatment started when peripheral blast count was between 4% and 17% (mean was 9.1–10% for all groups). AC220, which was synthesized and prepared as previously described (20), was delivered once daily p.o. Elesclomol was dissolved in 10% DMSO/18% (vol/vol) Kolliphor and delivered once daily i.v. For monitoring leukemic burden in mice, blood collected into heparin was hemolyzed and stained with anti-human CD45-FITC and HLA-ABC-PE-Cy7 (eBioscience) and analyzed by flow cytometry. Mice were killed when leukemic burden in peripheral blood was ≥75% and before any signs of distress. The Institutional Animal Care and Use Committee at CU approved all mouse experiments under protocol 41414(05)1E. Primary human AML samples were obtained under Institutional Review Board protocol 12-0173.
Statistics.
Data are expressed as the mean ± SEM. Comparisons between two values were performed by the Student t test, unless otherwise noted. Combination indices were calculated using the median-effect principle and the Combination Index-Isobologram Theorem (CompuSyn software).
SI Materials and Methods
Pharmacologic Agents.
CEP-701 (lestaurtinib) was obtained from Cephalon. AC220 (quizartinib) and elesclomol were purchased from Selleck Chemicals and were also synthesized by the CU Medicinal Chemistry Core (described below). KU55933 and DHEA were purchased from Calbiochem (EMD Millipore). All other agents were purchased from Sigma-Aldrich Chemical Company.
Synthetic Lethal Screen and Analysis.
A total of 2 × 10⁷ Molm13 cells were transduced with 1 × 10⁷ infectious units of the lentiviral human 50K shRNA library (GeneNet; SBI) using standard protocols. Two days after infection, cells were subjected to selection in puromycin (2.0 µg/mL) for a period of 10 d. The cells were then divided into six groups of 2 × 10⁷ cells: three were treated with vehicle (0.1% DMSO) and three were treated with CEP-701 at 20 nM for 72 h and were cultured for an additional week. Total RNA was isolated from each group using TRIzol reagent (Invitrogen) and reverse transcribed with Moloney murine leukemia virus reverse transcriptase (Epicenter). shRNA sequences were PCR amplified and quantitated by deep sequencing (Illumina) as previously described (51). shRNAs in the control group with low sequence read counts (mean < 20) were filtered out, and the BiNGS!SL-seq bioinformatics pipeline was used for analysis (12). Genes were called synthetic lethal (SLAM) if they were represented by ≥2 shRNAs each with a BiNGs!SL z-value of <0.1 and a mean fold-change <−10. Gene ontology for biological processes was performed using Panther (52).
NMR Spectroscopy.
Molm13 cells were cultured in 5.5 mM [1-13C]-glucose (Cambridge Isotope Laboratories) during the final 6 h of vehicle/AC220 treatment before perchloric acid extraction (53). High-resolution 1H- and 13C-NMR experiments were performed using a Bruker 500 MHz DRX spectrometer as previously described (54). Trimethylsilyl-propionic-2,2,3,3,-d4 acid (TSP, 0.5 mM) and methyl-diphosphoric acid (MDP) were used as an external standard for chemical shifts assignment and quantification. All NMR analysis was performed using the Bruker WINNMR program.
Drug Synthesis.
AC220 and its formulation was prepared as previously described (20). Elesclomol was synthesized as follows. In a dry 500-mL round bottom flask containing a stir bar and magnesium powder (3.87 g, 159 mmol), bromobenzene (20 g, 127.4 mmol) was added followed by freshly distilled anhydrous THF (200 mL). A reflux condenser was attached and the contents heated to reflux (2.0 h). The reaction mixture was then allowed to cool to ambient temperature, and the clear reaction solution was then added to an ice-cold solution of carbon disulfide (12.9 mL; 214 mmol). The reaction mixture was allowed to slowly warm to ambient temperature and stirred for an additional 30 min. The resulting solution was then added to an ice-cold solution of methyl hydrazine (20.1 mL, 382 mmol). The mixture was allowed to warm to ambient temperature and stirred at room temperature for 2.0 h. Next, water (40 mL) was added, and the contents were extracted with ethyl acetate (3 × 200 mL). The organic phases were combined, dried over anhydrous sodium sulfate, filtered, and concentrated under reduced pressure to afford crude material which was purified by silica gel column chromatography via CH2Cl2–MeOH (1%) as the eluent to afford N-methylbenzothiohydrazide (11.0 g, 52% yield) as a viscous liquid, which solidified on standing. To an ice cold solution of N-methylbenzothiohydrazide (5.00 g, 18.1 mmol) in dry THF (75 mL) was added triethylamine (4.41 mL, 31.61 mmol), followed by malonyldichloride (1.64 mL, 16.9 mmol). The reaction was stirred for 30 min, then ice-cold water (50 mL) was added, and the reaction mixture extracted with ethyl acetate (3 × 200 mL). The organic phase was then dried over anhydrous sodium sulfate, filtered, and concentrated under reduced pressure. The crude material was then loaded onto a silica gel column and purified using CH2Cl2–MeOH [10% (vol/vol)] as the eluent to afford N′1,N′3-dimethyl-N′1,N′3 di(phenylcarbonothioyl)malonohydrazide (elesclomol; 3.00 g, 50% yield) as a yellow solid.
Viability Assays on Primary AML Samples.
Primary FLT3-ITD+ AML patient samples were obtained from C. T. Jordan (University of Colorado, Aurora, CO; see characteristics below). Total bone marrow mononuclear cells were isolated by standard Ficoll procedures (GE Healthcare) and cryopreserved in freezing medium consisting of Cryostor CS10 (BioLife Solutions). The viability of leukemic cells after thawing was >85%. Isolation of CD34+ cells from umbilical cord blood was performed as described previously (20), and purity was >98%. The cells were cultured in Iscove's modified Dulbecco's medium with 4 mM glutamine and 10% (vol/vol) heat-inactivated FBS and supplemented with 10 µg/mL of IL-3, IL-6, IL-7, GM-CSF, and SCF (Peprotech) for 2 d before exposure to drugs. After 72 h of drug treatment, viable cells (PI-excluded) were counted by flow cytometry.
| Specimen | Diagnosis | CG | FLT3ITD status |
| AML 03 | NA | Monosomy 7 | + |
| AML 05 | De novo | Normal | + |
| AML 10 | Relapse | Normal | + |
| AML 11 | De novo | Clone 1: +8q, +3q, t (9, 22)(BCR-ABL); clone 2: clone 1 abnormalities AND +3, +10, +12 +13, +15 +20; clone 3: clone 2 abnormalities AND der (22) | − |
| AML 30 | De novo | Normal | −, FLT3 D835 |
| AML 41 | NA | t(9:11) | ± (low allelic burden) |
The clinical characteristics of the AML cohort studied are summarized. CG, cytogenetics; NA, not available.
Supplementary Material
Acknowledgments
We thank Vadym Zaberezhnyy, Andrea Merz, and Dr. Chris Porter for assistance with experiments. We thank Karen Helm, Christine Childs, and Lester Acosta of the University of Colorado Cancer Center Flow Cytometry Core (supported by NIH Grant P30-CA46934) for technical assistance. Grants from the National Institutes of Health (K22-CA133182 to M.A.G. and F31-CA157166 to F.A.C.), the Cancer League of Colorado (to M.A.G.), and the Leukemia Lymphoma Society (to J.D.) supported these studies. The research used services of the Medicinal Chemistry Core Facility, which is supported in part by NIH/National Center for Advancing Translational Sciences Grant UL1TR001082 to Colorado Clinical & Translational Sciences Institute.
Footnotes
The authors declare no conflict of interest.
This article is a PNAS Direct Submission.
This article contains supporting information online at www.pnas.org/lookup/suppl/doi:10.1073/pnas.1603876113/-/DCSupplemental.
References
- 1.Stone RM, O’Donnell MR, Sekeres MA. Acute myeloid leukemia. Hematology Am Soc Hematol Educ Program. 2004;2004:98–117. doi: 10.1182/asheducation-2004.1.98. [DOI] [PubMed] [Google Scholar]
- 2.Dinner SN, Giles FJ, Altman JK. New strategies for relapsed acute myeloid leukemia: Fertile ground for translational research. Curr Opin Hematol. 2014;21(2):79–86. doi: 10.1097/MOH.0000000000000018. [DOI] [PubMed] [Google Scholar]
- 3.Paterson SC, Smith KD, Holyoake TL, Jørgensen HG. Is there a cloud in the silver lining for imatinib? Br J Cancer. 2003;88(7):983–987. doi: 10.1038/sj.bjc.6600828. [DOI] [PMC free article] [PubMed] [Google Scholar]
- 4.Scholl C, Gilliland DG, Fröhling S. Deregulation of signaling pathways in acute myeloid leukemia. Semin Oncol. 2008;35(4):336–345. doi: 10.1053/j.seminoncol.2008.04.004. [DOI] [PubMed] [Google Scholar]
- 5.Cancer Genome Atlas Research Network Genomic and epigenomic landscapes of adult de novo acute myeloid leukemia. N Engl J Med. 2013;368(22):2059–2074. doi: 10.1056/NEJMoa1301689. [DOI] [PMC free article] [PubMed] [Google Scholar]
- 6.Swords R, Freeman C, Giles F. Targeting the FMS-like tyrosine kinase 3 in acute myeloid leukemia. Leukemia. 2012;26(10):2176–2185. doi: 10.1038/leu.2012.114. [DOI] [PubMed] [Google Scholar]
- 7.Armstrong SA, et al. FLT3 mutations in childhood acute lymphoblastic leukemia. Blood. 2004;103(9):3544–3546. doi: 10.1182/blood-2003-07-2441. [DOI] [PubMed] [Google Scholar]
- 8.Small D. FLT3 mutations: Biology and treatment. Hematology Am Soc Hematol Educ Program. 2006;2006:178–184. doi: 10.1182/asheducation-2006.1.178. [DOI] [PubMed] [Google Scholar]
- 9.Levis M, Small D. FLT3: ITDoes matter in leukemia. Leukemia. 2003;17(9):1738–1752. doi: 10.1038/sj.leu.2403099. [DOI] [PubMed] [Google Scholar]
- 10.Smith CC, et al. Validation of ITD mutations in FLT3 as a therapeutic target in human acute myeloid leukaemia. Nature. 2012;485(7397):260–263. doi: 10.1038/nature11016. [DOI] [PMC free article] [PubMed] [Google Scholar]
- 11.Pratz KW, Luger SM. Will FLT3 inhibitors fulfill their promise in acute meyloid leukemia? Curr Opin Hematol. 2014;21(2):72–78. doi: 10.1097/MOH.0000000000000022. [DOI] [PMC free article] [PubMed] [Google Scholar]
- 12.Kim J, Tan AC. BiNGS!SL-seq: A bioinformatics pipeline for the analysis and interpretation of deep sequencing genome-wide synthetic lethal screen. Methods Mol Biol. 2012;802:389–398. doi: 10.1007/978-1-61779-400-1_26. [DOI] [PubMed] [Google Scholar]
- 13.Ambrose M, Gatti RA. Pathogenesis of ataxia-telangiectasia: The next generation of ATM functions. Blood. 2013;121(20):4036–4045. doi: 10.1182/blood-2012-09-456897. [DOI] [PMC free article] [PubMed] [Google Scholar]
- 14.Levis M. Quizartinib for the treatment of FLT3/ITD acute myeloid leukemia. Future Oncol. 2014;10(9):1571–1579. doi: 10.2217/fon.14.105. [DOI] [PMC free article] [PubMed] [Google Scholar]
- 15.Cosentino C, Grieco D, Costanzo V. ATM activates the pentose phosphate pathway promoting anti-oxidant defence and DNA repair. EMBO J. 2011;30(3):546–555. doi: 10.1038/emboj.2010.330. [DOI] [PMC free article] [PubMed] [Google Scholar]
- 16.Pallardó FV, et al. Mitochondrial dysfunction in some oxidative stress-related genetic diseases: Ataxia-Telangiectasia, Down Syndrome, Fanconi Anaemia and Werner Syndrome. Biogerontology. 2010;11(4):401–419. doi: 10.1007/s10522-010-9269-4. [DOI] [PubMed] [Google Scholar]
- 17.Valentin-Vega YA, et al. Mitochondrial dysfunction in ataxia-telangiectasia. Blood. 2012;119(6):1490–1500. doi: 10.1182/blood-2011-08-373639. [DOI] [PMC free article] [PubMed] [Google Scholar]
- 18.Morita A, Tanimoto K, Murakami T, Morinaga T, Hosoi Y. Mitochondria are required for ATM activation by extranuclear oxidative stress in cultured human hepatoblastoma cell line Hep G2 cells. Biochem Biophys Res Commun. 2014;443(4):1286–1290. doi: 10.1016/j.bbrc.2013.12.139. [DOI] [PubMed] [Google Scholar]
- 19.Dickinson BC, Chang CJ. A targetable fluorescent probe for imaging hydrogen peroxide in the mitochondria of living cells. J Am Chem Soc. 2008;130(30):9638–9639. doi: 10.1021/ja802355u. [DOI] [PMC free article] [PubMed] [Google Scholar]
- 20.Alvarez-Calderon F, et al. Tyrosine kinase inhibition in leukemia induces an altered metabolic state sensitive to mitochondrial perturbations. Clin Cancer Res. 2015;21(6):1360–1372. doi: 10.1158/1078-0432.CCR-14-2146. [DOI] [PMC free article] [PubMed] [Google Scholar]
- 21.Jacquel A, et al. Imatinib induces mitochondria-dependent apoptosis of the Bcr-Abl-positive K562 cell line and its differentiation toward the erythroid lineage. FASEB J. 2003;17(14):2160–2162. doi: 10.1096/fj.03-0322. [DOI] [PubMed] [Google Scholar]
- 22.Blackman RK, et al. Mitochondrial electron transport is the cellular target of the oncology drug elesclomol. PLoS One. 2012;7(1):e29798. doi: 10.1371/journal.pone.0029798. [DOI] [PMC free article] [PubMed] [Google Scholar]
- 23.Miskimins WK, et al. Synergistic anti-cancer effect of phenformin and oxamate. PLoS One. 2014;9(1):e85576. doi: 10.1371/journal.pone.0085576. [DOI] [PMC free article] [PubMed] [Google Scholar]
- 24.Skrtić M, et al. Inhibition of mitochondrial translation as a therapeutic strategy for human acute myeloid leukemia. Cancer Cell. 2011;20(5):674–688. doi: 10.1016/j.ccr.2011.10.015. [DOI] [PMC free article] [PubMed] [Google Scholar]
- 25.Yoon JY, Ishdorj G, Graham BA, Johnston JB, Gibson SB. Valproic acid enhances fludarabine-induced apoptosis mediated by ROS and involving decreased AKT and ATM activation in B-cell-lymphoid neoplastic cells. Apoptosis. 2014;19(1):191–200. doi: 10.1007/s10495-013-0906-7. [DOI] [PubMed] [Google Scholar]
- 26.Kirshner JR, et al. Elesclomol induces cancer cell apoptosis through oxidative stress. Mol Cancer Ther. 2008;7(8):2319–2327. doi: 10.1158/1535-7163.MCT-08-0298. [DOI] [PubMed] [Google Scholar]
- 27.Nagai M, et al. The oncology drug elesclomol selectively transports copper to the mitochondria to induce oxidative stress in cancer cells. Free Radic Biol Med. 2012;52(10):2142–2150. doi: 10.1016/j.freeradbiomed.2012.03.017. [DOI] [PubMed] [Google Scholar]
- 28.Hasinoff BB, Yadav AA, Patel D, Wu X. The cytotoxicity of the anticancer drug elesclomol is due to oxidative stress indirectly mediated through its complex with Cu(II) J Inorg Biochem. 2014;137:22–30. doi: 10.1016/j.jinorgbio.2014.04.004. [DOI] [PubMed] [Google Scholar]
- 29.Pagliarini R, Shao W, Sellers WR. Oncogene addiction: Pathways of therapeutic response, resistance, and road maps toward a cure. EMBO Rep. 2015;16(3):280–296. doi: 10.15252/embr.201439949. [DOI] [PMC free article] [PubMed] [Google Scholar]
- 30.Torti D, Trusolino L. Oncogene addiction as a foundational rationale for targeted anti-cancer therapy: Promises and perils. EMBO Mol Med. 2011;3(11):623–636. doi: 10.1002/emmm.201100176. [DOI] [PMC free article] [PubMed] [Google Scholar]
- 31.Glasauer A, Chandel NS. Targeting antioxidants for cancer therapy. Biochem Pharmacol. 2014;92(1):90–101. doi: 10.1016/j.bcp.2014.07.017. [DOI] [PubMed] [Google Scholar]
- 32.Weinberg F, et al. Mitochondrial metabolism and ROS generation are essential for Kras-mediated tumorigenicity. Proc Natl Acad Sci USA. 2010;107(19):8788–8793. doi: 10.1073/pnas.1003428107. [DOI] [PMC free article] [PubMed] [Google Scholar]
- 33.Maryanovich M, Gross A. A ROS rheostat for cell fate regulation. Trends Cell Biol. 2013;23(3):129–134. doi: 10.1016/j.tcb.2012.09.007. [DOI] [PubMed] [Google Scholar]
- 34.DeNicola GM, et al. Oncogene-induced Nrf2 transcription promotes ROS detoxification and tumorigenesis. Nature. 2011;475(7354):106–109. doi: 10.1038/nature10189. [DOI] [PMC free article] [PubMed] [Google Scholar]
- 35.Wondrak GT. Redox-directed cancer therapeutics: Molecular mechanisms and opportunities. Antioxid Redox Signal. 2009;11(12):3013–3069. doi: 10.1089/ars.2009.2541. [DOI] [PMC free article] [PubMed] [Google Scholar]
- 36.Gorrini C, Harris IS, Mak TW. Modulation of oxidative stress as an anticancer strategy. Nat Rev Drug Discov. 2013;12(12):931–947. doi: 10.1038/nrd4002. [DOI] [PubMed] [Google Scholar]
- 37.Trachootham D, Alexandre J, Huang P. Targeting cancer cells by ROS-mediated mechanisms: A radical therapeutic approach? Nat Rev Drug Discov. 2009;8(7):579–591. doi: 10.1038/nrd2803. [DOI] [PubMed] [Google Scholar]
- 38.Ribas V, García-Ruiz C, Fernández-Checa JC. Glutathione and mitochondria. Front Pharmacol. 2014;5:151. doi: 10.3389/fphar.2014.00151. [DOI] [PMC free article] [PubMed] [Google Scholar]
- 39.Pei S, et al. Targeting aberrant glutathione metabolism to eradicate human acute myelogenous leukemia cells. J Biol Chem. 2013;288(47):33542–33558. doi: 10.1074/jbc.M113.511170. [DOI] [PMC free article] [PubMed] [Google Scholar]
- 40.Canman CE, Lim DS. The role of ATM in DNA damage responses and cancer. Oncogene. 1998;17(25):3301–3308. doi: 10.1038/sj.onc.1202577. [DOI] [PubMed] [Google Scholar]
- 41.Shiloh Y, Ziv Y. The ATM protein kinase: Regulating the cellular response to genotoxic stress, and more. Nat Rev Mol Cell Biol. 2013;14(4):197–210. [PubMed] [Google Scholar]
- 42.Guo Z, Kozlov S, Lavin MF, Person MD, Paull TT. ATM activation by oxidative stress. Science. 2010;330(6003):517–521. doi: 10.1126/science.1192912. [DOI] [PubMed] [Google Scholar]
- 43.Li Y, Yang DQ. The ATM inhibitor KU-55933 suppresses cell proliferation and induces apoptosis by blocking Akt in cancer cells with overactivated Akt. Mol Cancer Ther. 2010;9(1):113–125. doi: 10.1158/1535-7163.MCT-08-1189. [DOI] [PubMed] [Google Scholar]
- 44.Alexander A, et al. ATM signals to TSC2 in the cytoplasm to regulate mTORC1 in response to ROS. Proc Natl Acad Sci USA. 2010;107(9):4153–4158. doi: 10.1073/pnas.0913860107. [DOI] [PMC free article] [PubMed] [Google Scholar]
- 45.Stirewalt DL, Radich JP. The role of FLT3 in haematopoietic malignancies. Nat Rev Cancer. 2003;3(9):650–665. doi: 10.1038/nrc1169. [DOI] [PubMed] [Google Scholar]
- 46.Wise DR, Thompson CB. Glutamine addiction: A new therapeutic target in cancer. Trends Biochem Sci. 2010;35(8):427–433. doi: 10.1016/j.tibs.2010.05.003. [DOI] [PMC free article] [PubMed] [Google Scholar]
- 47.Daye D, Wellen KE. Metabolic reprogramming in cancer: Unraveling the role of glutamine in tumorigenesis. Semin Cell Dev Biol. 2012;23(4):362–369. doi: 10.1016/j.semcdb.2012.02.002. [DOI] [PubMed] [Google Scholar]
- 48.Auclair D, et al. Antitumor activity of sorafenib in FLT3-driven leukemic cells. Leukemia. 2007;21(3):439–445. doi: 10.1038/sj.leu.2404508. [DOI] [PubMed] [Google Scholar]
- 49.Gregory MA, et al. Wnt/Ca2+/NFAT signaling maintains survival of Ph+ leukemia cells upon inhibition of Bcr-Abl. Cancer Cell. 2010;18(1):74–87. doi: 10.1016/j.ccr.2010.04.025. [DOI] [PMC free article] [PubMed] [Google Scholar]
- 50.D’Alessandro A, et al. Metabolic effect of TAp63α: Enhanced glycolysis and pentose phosphate pathway, resulting in increased antioxidant defense. Oncotarget. 2014;5(17):7722–7733. doi: 10.18632/oncotarget.2300. [DOI] [PMC free article] [PubMed] [Google Scholar]
- 51.Porter CC, et al. Integrated genomic analyses identify WEE1 as a critical mediator of cell fate and a novel therapeutic target in acute myeloid leukemia. Leukemia. 2012;12(12):2675–2684. doi: 10.1038/leu.2011.392. [DOI] [PMC free article] [PubMed] [Google Scholar]
- 52.Mi H, Muruganujan A, Casagrande JT, Thomas PD. Large-scale gene function analysis with the PANTHER classification system. Nat Protoc. 2013;8(8):1551–1566. doi: 10.1038/nprot.2013.092. [DOI] [PMC free article] [PubMed] [Google Scholar]
- 53.Gottschalk S, Anderson N, Hainz C, Eckhardt SG, Serkova NJ. Imatinib (STI571)-mediated changes in glucose metabolism in human leukemia BCR-ABL-positive cells. Clin Cancer Res. 2004;10(19):6661–6668. doi: 10.1158/1078-0432.CCR-04-0039. [DOI] [PubMed] [Google Scholar]
- 54.Klawitter J, et al. Metabolic characteristics of imatinib resistance in chronic myeloid leukaemia cells. Br J Pharmacol. 2009;158(2):588–600. doi: 10.1111/j.1476-5381.2009.00345.x. [DOI] [PMC free article] [PubMed] [Google Scholar]
Associated Data
This section collects any data citations, data availability statements, or supplementary materials included in this article.


