Significance
The PPARγ-coactivator-1α (PGC-1α) is a transcriptional regulator of genes involved in energy metabolism. We observed previously that PGC-1α decreases the generation of Aβ in cell culture, and its levels are reduced in Alzheimer’s disease (AD) brains. To determine its potential therapeutic role in vivo, we delivered PGC-1α in specific brain areas of an AD model by using viral vectors. We found that PGC-1α–injected mice showed decreased Aβ plaques by reducing the expression of the main enzyme involved in Aβ production, preserving most neurons in the brain and performing as well as wild-type mice in cognitive tests. Therefore, PGC-1α selective delivery shows promising therapeutic value in AD.
Keywords: Aβ, BACE1, growth factor, inflammation, neurodegeneration
Abstract
Current therapies for Alzheimer’s disease (AD) are symptomatic and do not target the underlying Aβ pathology and other important hallmarks including neuronal loss. PPARγ-coactivator-1α (PGC-1α) is a cofactor for transcription factors including the peroxisome proliferator-activated receptor-γ (PPARγ), and it is involved in the regulation of metabolic genes, oxidative phosphorylation, and mitochondrial biogenesis. We previously reported that PGC-1α also regulates the transcription of β-APP cleaving enzyme (BACE1), the main enzyme involved in Aβ generation, and its expression is decreased in AD patients. We aimed to explore the potential therapeutic effect of PGC-1α by generating a lentiviral vector to express human PGC-1α and target it by stereotaxic delivery to hippocampus and cortex of APP23 transgenic mice at the preclinical stage of the disease. Four months after injection, APP23 mice treated with hPGC-1α showed improved spatial and recognition memory concomitant with a significant reduction in Aβ deposition, associated with a decrease in BACE1 expression. hPGC-1α overexpression attenuated the levels of proinflammatory cytokines and microglial activation. This effect was accompanied by a marked preservation of pyramidal neurons in the CA3 area and increased expression of neurotrophic factors. The neuroprotective effects were secondary to a reduction in Aβ pathology and neuroinflammation, because wild-type mice receiving the same treatment were unaffected. These results suggest that the selective induction of PGC-1α gene in specific areas of the brain is effective in targeting AD-related neurodegeneration and holds potential as therapeutic intervention for this disease.
Alzheimer’s disease (AD) is the most prevalent form of dementia in the elderly and affects more than 40 million people worldwide. The global cost of dementia is estimated at more than 800 billion USD, without effective treatment that can at least halt, cure, and prevent the disease (World Alzheimer’s report 2015, ref. 1). Current drug therapies for AD are merely symptomatic and do not target the underlying cause of the disease. New strategies include disease-modifying treatments, which aim to reduce the production of amyloid-β (Aβ) peptides and plaques or the modified protein tau and tangles. These particular therapies are expected to block the progression of the disease and prevent neuronal loss, but are likely also to have serious side effects (2, 3).
We have recently explored the potential neuroprotective effects of the PPARγ-coactivator 1α (PGC-1α), a transcriptional coactivator for the peroxisome proliferator-activated receptor-γ (PPARγ) and for other transcription factors (4). PGC-1α is abundantly expressed in high-energy demanding tissues such as adipose tissue, liver, skeletal muscle, heart, kidney, and brain (5, 6) where it is involved in the regulation of glucose and lipid metabolism, oxidative phosphorylation, and mitochondrial biogenesis (4, 5).
PGC-1α has been implicated in various neurodegenerative diseases (6) and its expression is reduced in the brain of AD patients (7, 8). Interestingly, exogenous human PGC-1α expression in neuroblastoma cells and in primary neurons from the Tg2576 mouse model of AD decreased Aβ generation and increased nonamyloidogenic sAPPα levels (7, 8). Additionally, we showed that PGC-1α mediates this effect by reducing β-APP cleaving enzyme (BACE1) gene transcription via a PPARγ-dependent mechanism (7). Conversely, crossing Tg2576 with mice deficient in PGC-1α or silencing PGC-1α using siRNA transfection in neuronal cells, led to increased Aβ levels (7–9). Pharmacological stimulation of PGC-1α synthesis with nicotinamide riboside, the precursor of NAD+, resulted in reduced Aβ levels and attenuated cognitive deterioration in Tg2576 mice (9). Furthermore, treatment with resveratrol, another PGC-1α activator, increased the activity of the Aβ-degrading enzyme neprilysin and reduced amyloid plaques (10). Nevertheless, these drugs may promote these beneficial effects by acting on molecules other than PGC-1α, and an additional independent approach to investigate these specific functions of PGC-1α in AD was therefore considered relevant. We hypothesized that gene therapy with PGC-1α delivered in the brain could be neuroprotective because of its effect on the transcription of genes involved in Aβ generation, energy and glucose metabolism, and oxidative stress.
The aim of this study was to generate a lentiviral vector expressing human PGC-1α and target it in defined brain regions of APP23 transgenic mice by stereotaxic delivery, allowing us to evaluate the specific effects of this transcriptional regulator and define its potential for gene therapy for AD. Our results show that PGC-1α prevents neuronal loss by increasing the transcription of growth factors and by decreasing Aβ-mediated neuroinflammation in those animals, consolidating the potential of PGC-1α gene delivery as treatment for AD.
Results
Effective Transduction of PGC1α Using RVG-B2c Lentiviral Vectors Confers Neurotropism and High Expression in the Brain.
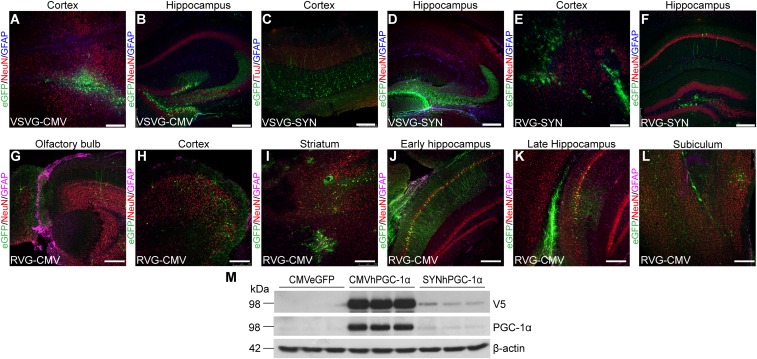
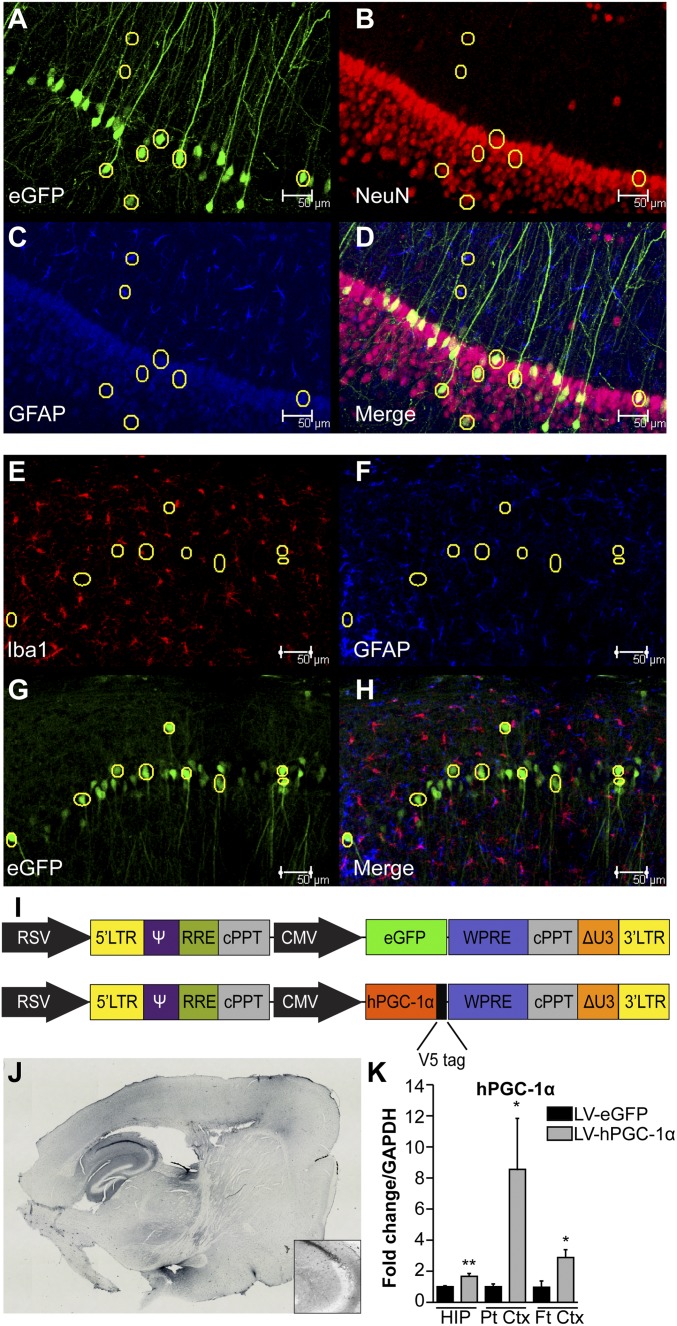
Lentiviral vectors (LV) that efficiently transduce neurons were generated, compared by various combinations of gene promoters and viral envelope glycoproteins. We first tested vesicular stomatitis viral glycoprotein (VSVG) and rabies virus glycoprotein B2c (RVG). Pseudotyping lentiviral vectors with the RVG envelope glycoprotein confers both neurotropism and, more importantly, the ability of retrograde transport along neuronal axons (11). Additionally, we compared lentiviral vectors carrying the ubiquitous human CMV major immediate-early enhancer/promoter or the neuronal-specific human synapsin I (SYN) gene promoter. We generated combinations of VSVG-CMV, VSVG-SYN, RVG-CMV, and RVG-SYN vectors that carried the enhanced GFP (eGFP) gene and injected them unilaterally in the brain of wild-type mice (SI Text and Fig. S1 A–L). RVG-CMV resulted in higher expression, transduced cells both proximal and distal to the site of injection and preferentially transduced pyramidal neurons in the cortex and the CA1 area of the hippocampus (HIP) (Fig. S1 G–L). CMV promoter was selected because it resulted in higher expression compared with the SYN promoter (Fig. S1 E–M). The neurotropism of the vector was confirmed by costaining for eGFP and NeuN (Fig. 1 A–D), and by showing little or no localization of the transgene with astrocytes or microglia by costaining of eGFP with Iba1 and GFAP (Fig. 1 E–H). Therefore, the RVG-CMV-eGFP LV and RVG-CMV- hPGC-1α LV (further referred as LV-eGFP and LV-hPGC-1α) were generated as the vectors of choice (Fig. 1I).
Fig. S1.
Expression analysis of viral envelope glycoproteins and promoters. (A–L) Different glycoproteins and promoters were trialed with lentiviral vectors and their biodistribution was examined 3 wk poststereotaxic delivery in the frontal cortex and HIP of wild-type mice. Expression was confirmed in several brain areas both proximal and distal to the injection sites (n = 3, 16–20 sections). (Scale bars: 250 μm.) (M) HEK293T cells were transfected with the transfer genome plasmid for CMV-eGFP, CMV-hPGC-1α, and SYN-hPGC-1α, respectively. Representative Western blots of cell lysates for the V5 tag of hPGC-1α, hPGC-1α, and β-actin as loading control.
Fig. 1.
RVG-CMV lentiviral vector confers high transgene expression in neurons of hPGC-1α lentiviral-injected mice. (A–D) Representative images of the CA1 area of HIP for eGFP (green), NeuN (red), and GFAP (blue) from RVG-CMV-eGFP–injected wild-type mice showing clear colocalization of NeuN and eGFP and little or no colocalization of eGFP with GFAP. (E–H) Representative images of the CA1 area of HIP show low colocalization of microglia (Iba1-red) or astrocytes (GFAP-blue) with the transgene (eGFP-green) in RVG-CMV-eGFP–injected APP23 mouse brains. (I) Schematic of the genome plasmids used to generate the LV vectors. The upper construct represents the pRRL-sincppt-CMV-eGFP-WPRE and the lower one the pRRL-sincppt-CMV-hPGC-1α-WPRE lentiviral genome plasmids. (J) Anti-V5 immunohistochemistry in a LV-hPGC-1α–injected mouse 4.5 mo p.i. confirmed expression of the transgene in cortex and HIP. Tiled images were obtained at 10× magnification and generated by Image-Pro Plus 6 software. Inset shows a magnification of CA3 area. (K) Quantitative mRNA analysis for hPGC-1α showed increased expression in HIP (n = 6), parietal cortex (Pt Ctx; n = 7) and frontal cortex (Ft Ctx; n = 5) of LV-hPGC-1α–injected APP23 compared with the APP23/LV-eGFP mice 4 mo p.i. *P < 0.05, **P < 0.01, two-tailed Student’s t test. (Scale bars: 50 μm.)
The efficiency of the lentiviral vectors LV-eGFP and LV-hPGC-1α injected in the cortex and HIP of wild-type and APP23 mice was measured 4 mo after injection (p.i.). The expression of hPGC-1α protein in the brain of injected mice was evaluated by IHC using an antibody against the V5 tag, at the N terminus of the hPGC-1α construct (Fig. 1J). Moreover, hPGC-1α mRNA expression was confirmed by quantitative RT-PCR (qRT-PCR) analysis in the HIP, parietal cortex (Pt Ctx), and frontal cortex (Ft Ctx) of the injected APP23 mice (Fig. 1K).
hPGC-1α Gene Delivery Improves Spatial and Recognition Memory in APP23 Mice.
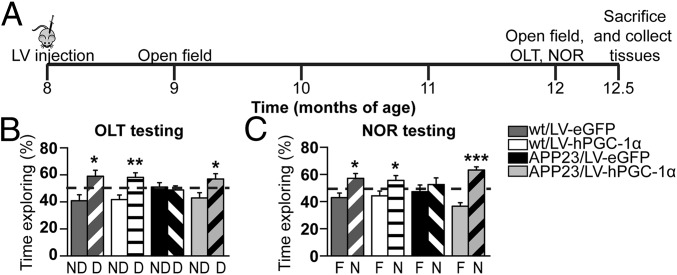
We next determined the therapeutic effects of long-term overexpression of hPGC-1α in the cortex and HIP of wild-type and APP23 mice, delivering it at the age of 8 mo and lasting for 4.5 mo (Fig. 2A). At 8 mo, female APP23 mice show the first rare amyloid deposits, representing the preclinical stage of the disease (12–14). To assess any adverse effects, we monitored several parameters after surgery, including body weight, mobility, and anxiety (Supporting Information and Fig. S2 A–C).
Fig. 2.
Cortical and hippocampal expression of hPGC-1α prevents memory decline in APP23 mice. (A) Schematic representation of the experimental procedure. Mice were injected at 8 mo of age, and behavioral tests were carried out 1 mo and 4 mo p.i., when tissues were harvested. (B) APP23/LV-hPGC-1α mice 4 mo after surgery had intact spatial memory assessed by object location task (OLT), whereas the APP23/LV-eGFP–injected mice showed memory deficits. The shaded columns show the displaced object (D) and the nonshaded the nondisplaced object (ND). (C) NOR testing session showing that the APP23/LV-hPGC-1α mice had recognition memory values similar to the wild-type levels, whereas the APP23/LV-eGFP were unable to discriminate between the novel (labeled N, shaded columns) and the familiar object (labeled F) (n = 8–10). Two-tailed Student’s t test, *P < 0.05, **P < 0.01; ***P < 0.001.
Fig. S2.
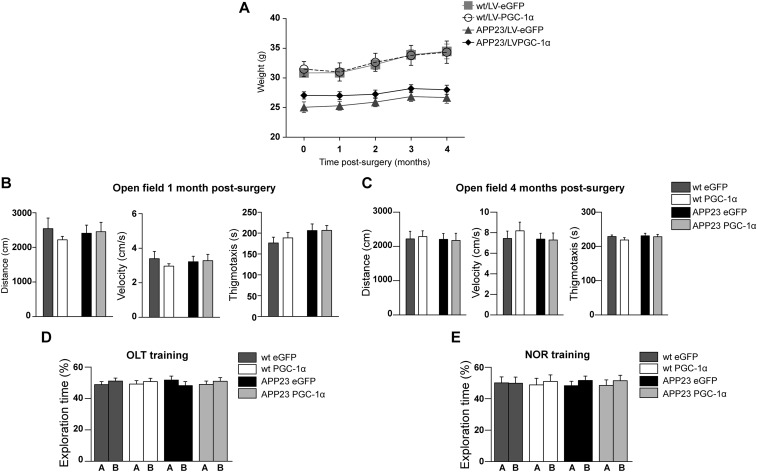
(A) Monthly weight monitoring showed no effect between the two viral vectors on body weight (two-way repeated-measures ANOVA F(1,37) = 0.753, P = 0.391, n = 9–11). (B) Open field performance 1 mo after surgery showing no difference between the four groups of mice (two-way ANOVA followed by Bonferroni post hoc test; Distance moved: Genotype F(1,37) = 0.0066, P = 0.9358, Treatment F(1,37) = 0.071, P = 0.7917; Velocity: Genotype F(1,37) = 0.0071, P = 0.9332, Treatment F(1,37) = 0.072, P = 0.7916; Thigmotaxis: Genotype F(1,37) = 2.902, P = 0.0968, Treatment F(1,37) = 0.2056, P = 0.6529; n = 9–11). (C) Open field performance 4 mo after surgery did not differ between the 4 groups. (two-way ANOVA followed by Bonferroni post hoc test; Distance moved: Genotype F(1,37) = 0.107, P = 0.652, Treatment F(1,37) = 0.01, P = 0.921; Velocity: Genotype F(1,37) = 0.444, P = 0.510, Treatment F(1,37) = 0.207, P = 0.652; Thigmotaxis: Genotype F(1,37) = 0.744, P = 0.395, Treatment F(1,37) = 0.855, P = 0.361; n = 9–11). (D) OLT training session showing no preference for object A or B. (E) Mice explored the two objects equally during the NOR training session.
To define whether chronic expression of LV-hPGC-1α in the cortex and HIP of APP23 and wild-type mice affected their memory, behavioral tests were carried out 4 mo p.i. Spatial memory was evaluated by object location task (OLT), based on the spontaneous tendency of rodents to spend more time exploring a relocated object (Fig. 2B and Fig. S2D). The APP23 mice (at 12 mo of age) that received the control vector displayed spatial memory deficits and were not able to discriminate between the displaced and the nondisplaced object (Fig. 2B). Conversely, APP23 animals injected with LV-hPGC-1α showed no deficits in spatial memory and performed as well as the two groups of wild-type mice, all preferring the displaced object (Fig. 2B). Following OLT, the mice were subjected to the novel object recognition test (NOR), which measures their ability to explore longer a novel object over a familiar one (Fig. 2C and Fig. S2E). The results of the NOR revealed that the APP23/LV-hPGC-1α mice were able to discriminate and explored for a longer time the novel object, whereas the APP23/LV-eGFP mice showed profound deficits (Fig. 2C). It is worth noting that the expression of hPGC-1α in the brain did not improve the performance of wild-type mice (Fig. 2C). These combined results demonstrate that lentiviral-mediated hPGC-1α expression prevented memory deficits in APP23 mice.
hPGC-1α Chronic Overexpression Reduces BACE1, Aβ Levels, and Plaque Load in APP23 Mice.
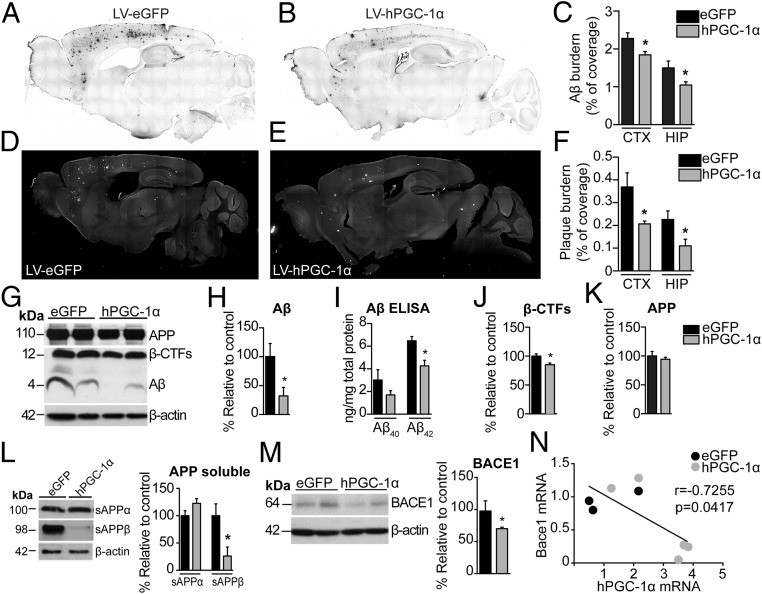
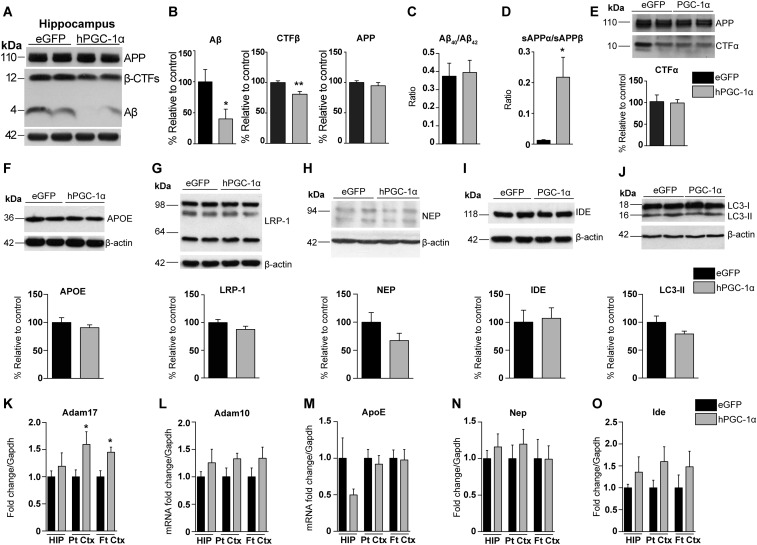
To quantify Αβ load by IHC, we used a monoclonal Aβ-specific antibody that does not cross-react with full-length APP or carboxy-terminus domains (CTFs) (15). Histopathological examination revealed significantly lower Αβ burden in cortex (19.1% reduction) and HIP (30% reduction) in APP23/LV-hPGC-1α mice compared with animals injected with the control vector (Fig. 3 A–C). Plaque burden was quantified after brain sections were stained with AmyloGlo, instead of the standard Thioflavin-S dye, because this interfered with eGFP detection. We observed that the area covered by amyloid plaques was decreased in the APP23/LV-hPGC-1α mice, both in the cortex and HIP compared with the APP23/LV-eGFP mice (43% and 51% decrease, respectively) (Fig. 3 D–F). Western blot analysis of brain homogenates confirmed the immunohistological results, showing reduced Aβ levels in the APP23/LV-hPGC-1α mice compared with APP23 mice treated with control vector (Fig. 3 G and H and Fig. S3 A and B). In addition, decreased ELISA values for Aβ40 and Aβ42 subtypes in the same samples corroborated these results (Fig. 3I), without changes in their ratio (Fig. S3C). Our previous in vitro studies demonstrated that increased PGC-1α expression reduces Bace1 transcription (7). In line with those in vitro results, the brain levels of β-CTF and sAPPβ, the main products of BACE1, were remarkably reduced in APP23 mice that received LV-hPGC-1α compared with APP23 injected with LV-eGFP (Fig. 3 J and L and Fig. S3 A and B), without changes in the expression of the precursor protein APP (Fig. 3K and Fig. S3 A and B). In complete agreement, the chronic expression of hPGC-1α in the brain of APP23 mice lowered BACE1 protein levels compared with control mice (Fig. 3M). Interestingly, an inverse correlation between hPGC-1α and Bace1 mRNA levels indicated lower Bace1 mRNA expression to be associated with higher PGC-1α levels (Fig. 3N; Pearson’s r = −0.7255, P < 0.05). Although no major changes were detected in sAPPα and αCTFs, the products of α-secretase cleavage, the ratio sAPPα/sAPPβ was found strongly increased, indicating a shifting in the balance toward α-secretase byLV-hPGC-1α delivery (Fig. S3 D and E). Furthermore, overexpression of hPGC-1α increased Adam17 mRNA levels but did not significantly affect Adam10 mRNA (Fig. S3 K and L). No significant alterations were observed in the Aβ clearance or degradation mechanisms (Fig. S3 F–J and M–O). Together, our combined data demonstrate that LV-hPGC-1α CNS transduction resulted in higher levels of human PGC-1α, triggering a robust reduction of Aβ production and plaque formation, however, not by affecting Aβ clearance or degradation.
Fig. 3.
Cortical and hippocampal sustained expression of hPGC-1α decreases amyloid plaque load in APP23 mice. (A and B) Representative images of anti-Aβ (MOAB-2) immunostained sections of APP23 injected with LV-eGFP and LV-hPGC-1α, respectively. (C) Quantification of percentage of Aβ burden from MOAB-2 staining revealed a significant decrease in Aβ load in LV-hPGC-1α/APP23 mice compared with LV-eGFP/APP23 (n = 9). (D and E) Representative sections stained with AmyloGlo and quantification of percentage of plaque burden (F) revealed a significant decrease in LV-hPGC-1α/APP23 mice (n = 9, seven sections per mouse). Tiled digital images of sections were obtained at 10× magnification using Image-Pro Plus 6 software. Representative Western blots for Aβ (G) and their quantification (H) and ELISA for Aβ40 and Aβ42 (I) in frontal cortex homogenates demonstrated decreased Aβ levels by hPGC-1α overexpression (n = 5). (J and K) Quantification from G showed reductions in β-CTFs levels, whereas full-length APP expression was unchanged in APP23/LV-PGC-1α (n = 5). (L) Representative Western blots for sAPPα and sAPPβ in cortices showing decrease in sAPPβ (n = 5 for each group). (M) Representative Western blot and quantification showed reduced BACE1 expression in the frontal cortex of LV-hPGC-1α/APP23 (n = 5), (N) Correlation analysis of BACE1 mRNA and hPGC-1α mRNA showing a statistically significant inverse correlation (Pearson’s r = −0.7255, P = 0.0417). *P < 0.05, two-tailed Student’s t test.
Fig. S3.
Effects of hPGC-1α overexpression on APP processing and Aβ clearance and degradation. (A and B) Representative Western blots for Aβ, β-CTFs, and APP from hippocampi (A) and their quantification (B) demonstrated that hPGC-1α overexpression decreased total Aβ and β-CTFs, whereas full-length APP expression was unchanged APP23/LV-PGC-1α (n = 5 for each group). (C) Ratio of Aβ40/Aβ42 from the ELISAs in frontal cortex homogenates showed no differences between groups. (D) Ratio analysis of sAPPα/sAPPβ revealed a shift toward the nonamyloidogenic pathway in LV-hPGC-1α/APP23 mice (n = 5). (E) Representative Western blot in frontal cortex homogenates with the R1(57) antibody that recognizes the C terminus of APP showed no differences in α-CTFs between the two groups. (F–I) Chronic overexpression of LV-hPGC-1α did not alter the expression of APOE and its receptor LRP-1 (F and G) or the Aβ-degrading enzymes neprilysin and IDE (H and I) (n = 5, two-tailed Student’s t test). APOE, apolipoprotein E; IDE, insulin-degrading enzyme; LRP-1, low-density lipoprotein receptor-related protein 1; NEP, neprilysin. (J) No changes were detected in autophagy by Western blotting for LC3 between LV-eGFP– and LV-PGC-1α–injected APP23 mice. (K) Increased Adam17 mRNA levels in the cortex of LV/hPGC-1α APP23 mice compared with APP23/LV-eGFP. Hippocampus (HIP; n = 6), parietal cortex (Pt Ctx; n = 7), and frontal cortex (Ft Ctx; n = 5). (L–O) The mRNA levels of Adam10, ApoE, Nep, and Ide remained largely unaffected by the hPGC-1α LV injection (n = 6 for HIP, n = 7 for Pt Ctx, and n = 5 for Ft Ctx, two-tailed Student’s t test, *P < 0.05, **P < 0.01).
hPGC-1α Attenuates Neuroinflammation in APP23 Mice.
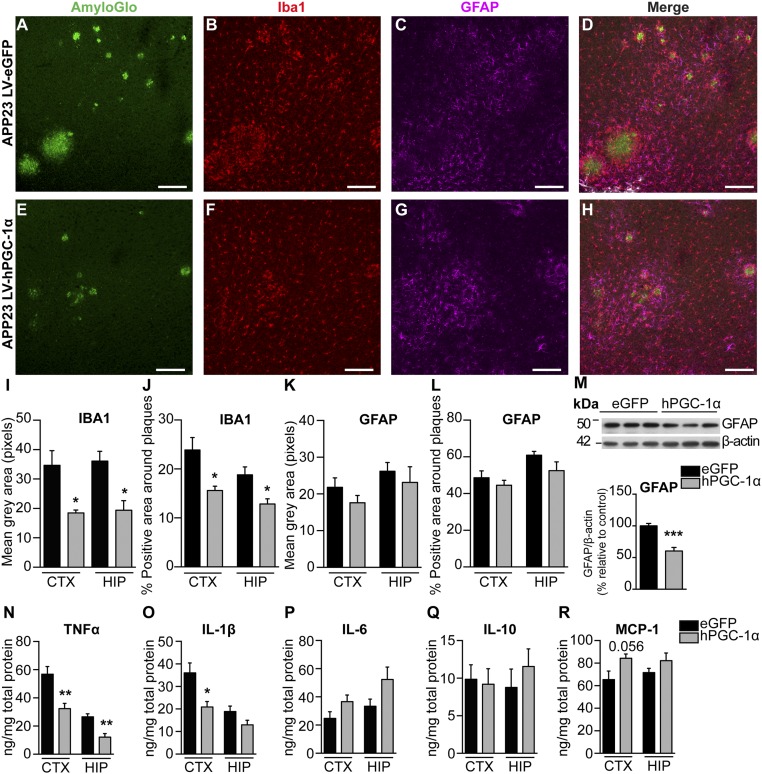
The APP23 mouse model of brain amyloidopathy exhibits a strong neuroinflammatory component (12–14). We quantified the density of microglia and astrocytes in areas surrounding amyloid plaques of similar size (Fig. 4 A–L). Microglial activation was detected by IHC for Iba-1 and found attenuated in APP23 injected with LV-hPGC-1α compared with animals injected with control vector (Fig. 4 B, D–F, and H–J). We did not observe major changes in astrocytosis surrounding the plaques, detected by GFAP staining (Fig. 4 C, D, G, H, K, and L), although total GFAP expression was reduced in hippocampal homogenates of APP23/LV-hPGC-1α mice (Fig. 4M). Importantly, the expression of the main proinflammatory cytokines TNF-α and IL-1β was significantly reduced in the APP23/LV-hPGC-1α mice compared with the APP23/LV-eGFP mice (Fig. 4 N and O), whereas no significant changes were observed for IL-6, IL-10, and MCP-1 (Fig. 4 P–R). In summary, hPGC-1α affects the activation of microglia, reducing their proinflammatory profile.
Fig. 4.
LV-hPGC-1α gene delivery in cortex and HIP of APP23 mice reduces neuroinflammation. (A–H) Representative cortical images from confocal imaging of triple staining for AmyloGlo (green), Iba1 (red), and GFAP (magenta) in LV-eGFP (A–D) and LV-hPGC-1α–injected APP23 mice (E–H); n = 5. (Scale bars: 125 μm.) Quantification of mean gray area (I) and percentage of coverage by microglial cells (J) showed a marked reduction of microglial activation in the APP23 mice LV-hPGC-1α (n = 5, four sections per mouse). GFAP-positive astrocytes surrounding the plaques were quantified as mean gray area (K) or percentage of coverage (L) (n = 5, four sections per mouse). (M) Representative Western blot in total hippocampal homogenates and quantification of GFAP (n = 5). (N–R) ELISAs for cytokines TNF-α (N), IL-1β (O), IL-6 (P), IL-10 (Q), and MCP-1 (R) in the frontal cortices and hippocampi (n = 5). *P < 0.05, **P < 0.01, ***P < 0.001, two-tailed Student’s t test.
hPGC-1α Prevents Neuronal Loss in the Hippocampus of APP23 Mice.
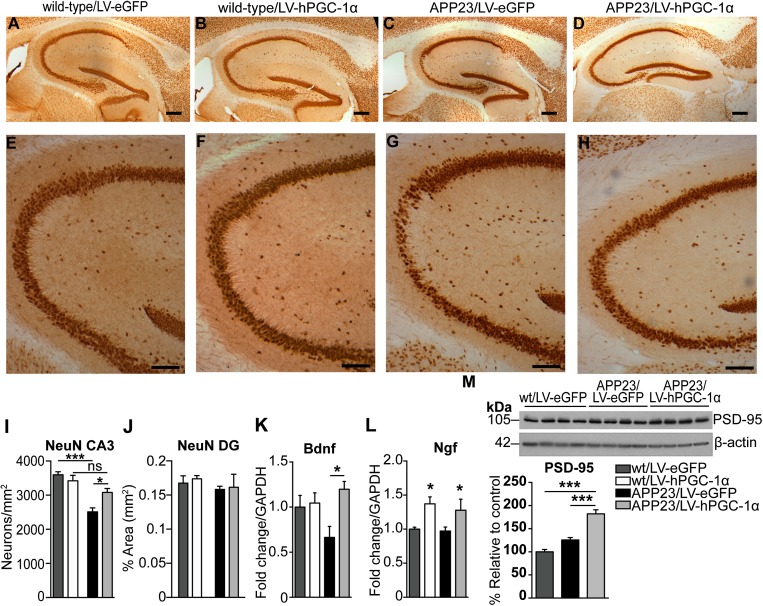
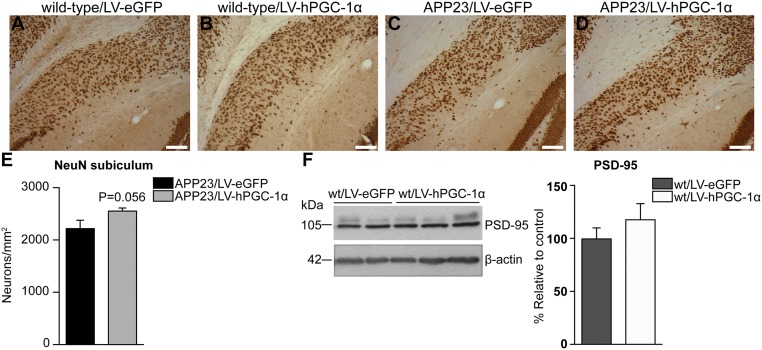
APP23 mice suffer neuronal loss in specified hippocampal areas at age 12 mo (16) and was confirmed by immunohistochemical analysis with NeuN in brains of APP23/LV-eGFP mice, showing a 30% reduction in neuronal number in the CA3, compared with wild-type/LV-eGFP mice (Fig. 5 A, C, E, G, I). Remarkably, in APP23 mice treated with LV-hPGC-1α, we observed a marked preservation of pyramidal neurons in the CA3 (Fig. 5 D, H, I), consistent with the absence of memory impairment described above. We found no significant changes in neuronal density in the dentate gyrus and subiculum in LV-hPGC-1α–injected mice (Fig. 5J and Fig. S4 A–E), suggesting that the neuroprotective effect was not linked to increased neurogenesis. In addition, PGC-1α gene delivery did not alter neuronal count in the brains of wild-type mice, indicating that the positive effect on neurons was associated with reduced amyloid load and pathology (Fig. 5 A, B, E, G, I). This conclusion was further supported by data showing increased mRNA expression of the neuroprotective factor (Fig. 5K) and the levels of the postsynaptic protein PSD-95 only in APP23/LV-hPGC-1α and not in wild-type mice (Fig. 5M and Fig. S4F). Interestingly, the expression of Ngf was found increased in both wild-type and APP23 mice overexpressing hPGC-1α (Fig. 5L).
Fig. 5.
Attenuation of neuronal loss in the CA3 area of APP23 mice by hPGC-1α gene delivery. (A–D) Representative pictures of NeuN staining in hippocampi of wild-type/LV-eGFP (A), wild-type/LV-hPGC-1α (B), APP23/LV-eGFP (C), and APP23/LV-hPGC-1α mice (D). (E–H) Higher magnification images of A–D illustrating the striking reduction in neuronal loss in the CA3 area in APP23 mice that received LV-hPGC-1α. (I) Quantification of neuronal numbers in the CA3 showing the neuroprotective effect of LV-hPGC1α injection in APP23 mice (n = 3–5). Two-way ANOVA test [Interaction F(1,13) = 9.275, P = 0.0094, Treatment F(1,13) = 2.544, P = 0.134, Genotype F(1,13) = 34.27, P < 0.0001]. (J) Quantification of neuronal density in the dentate gyrus (DG). (K) Bdnf mRNA detected by qRT-PCR was significantly increased in HIP of APP23/LV-hPGC-1α injected mice (n = 5). Two-way ANOVA test [Interaction F(1,16) = 0.299, P < 0.05, Treatment F(1,16) = 0.4178, P < 0.05, Genotype F(1,19) = 0.0407, P = 0.439]. (L) Ngf mRNA levels were significantly increased in both wild types and APP23 injected with LV-hPGC-1α. Two-way ANOVA test [Interaction F(1,18) = 0.0057, P = 0.092, Treatment F(1,18) = 0.628, P < 0.01, Genotype F(1,18) = 0.0197, P = 0.581], *P < 0.05, n = 5–6. (M) Representative Western blot and quantification for PSD-95 (n = 4), one-way ANOVA ***P < 0.001. (Scale bars: A–D, 0.250 mm; E–H, 0.1 mm.)
Fig. S4.
Neuronal cell density in subiculum of animals injected with LV-hPGC-1α or LV-eGFP. (A–D) Representative images of the subiculum where no changes were detected between LV-eGFP– (A, wild-type; C, APP23) and LV-hPGC-1α–injected mice (B, wild-type; D, APP23). (Scale bars: 0.1 mm.) (n = 3 for wild-type and n = 5 for APP23, six sections per mouse). (E) Quantification of NeuN+ cells in the subiculum of APP23 mice injected with LV-eGFP or LV-hPGC-1α showed no significant differences in the neuronal numbers (n = 5, six sections per mouse, two-tailed Student’s t test). (F) Western blot for PSD-95 in wild-type mice showed no changes between wt/LV-eGFP and wt/LV-hPGC-1α (two-tailed Student’s t test, n = 4).
Three weeks after injection (p.i.), we assessed the transduction efficiency of the virus in areas proximal and distal to the injection site in wild-type mice. Pseudotyping of the HIV-1–based lentiviral vectors with VSVG was not found to be transported to distant areas (Fig. S1 A–D). In addition, VSVG injections in the hippocampal formation preferentially transduced cells in the dentate gyrus (DG) (Fig. S1 B and D). RVG-CMV vector’s higher expression and transduction efficiency together with its ability to preferentially transduce pyramidal neurons (Fig. S1 E–M) was more relevant for our purpose, because the APP23 mice express hAPP in pyramidal neurons of cortical layers III-V and CA1-3 area in the HIP (12).
The gene delivery did not affect body weight, which was monitored monthly [F(1,37) = 0.753, P = 0.391, n = 9–11; Fig. S2A]. The performance of the mice in the open field evaluated at 1 and 4 mo p.i. showed no effect of the treatment or of the genotype on velocity or total distance moved (Fig. S2 B and C). Furthermore, thigmotaxis (proximity to walls), reflecting anxiety, was also evaluated in the open field and was observed not to be significantly affected (Fig. S2 B and C).
SI hPGC-1α Effect on Mitochondrial Markers in the Brains of APP23 Mice
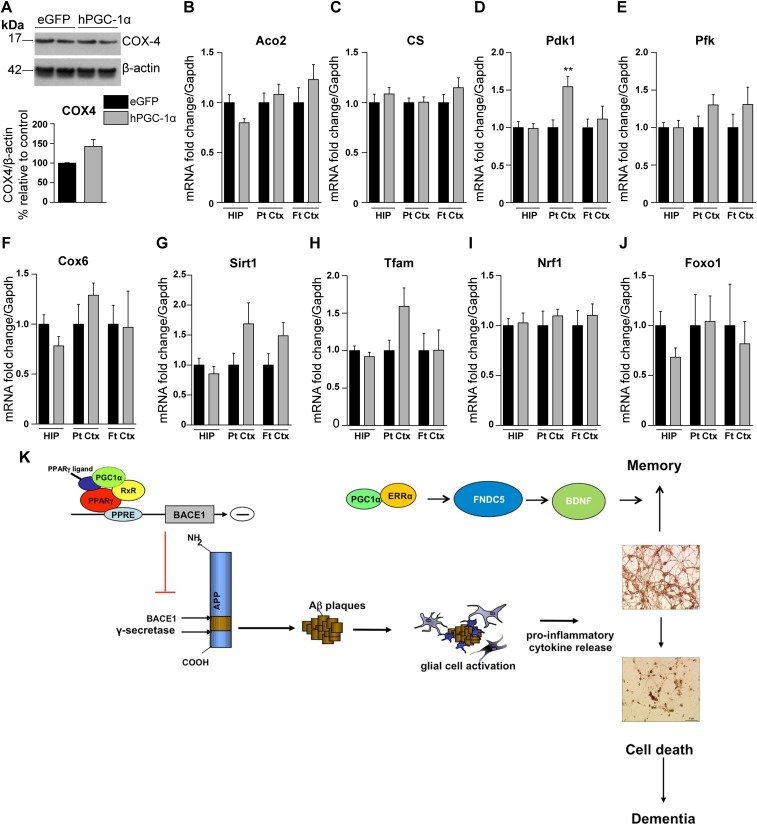
PGC-1α is the master regulator of mitochondrial biogenesis and regulates the level and activity of numerous mitochondrial proteins and enzymes that are essentially involved in major metabolic and respiratory pathways (3, 5). We observed a significant increase in the transcript levels of pyruvate dehydrogenase kinase-1 (Pdk1) in the parietal cortex of hPGC-1α–treated mice and increased levels of other mitochondrial markers, including COX4, sirtuin-1, and transcription factor A mitochondrial (Tfam), in the brains of APP23/LV-hPGC-1α–injected mice compared with control APP23/LV-eGFP mice (Fig. S5 A–J). Other mitochondrial markers were unaltered by the LV-mediated hPGC-1α vector injection. These results suggest that the beneficial effects of the intracerebral hPGC-1α gene delivery do not appear to be directly linked to major changes in mitochondrial function or biogenesis.
Fig. S5.
Quantification of the expression of mitochondrial markers in brains of APP23/LV-hPGC-1α mice compared with APP23/LV-eGFP. (A) Representative Western blot of COX-4 (two animals from each group shown here) and its quantification (n = 5, two-tailed Student’s t test). (B–F) The mRNA expression of the mitochondrial markers Aco2 (B), CS (C), Pfk (E), and Cox6 (F) appears to be unaltered. There was a significant increase of Pdk1 (D) in the parietal cortex, which was the area that had the highest expression of hPGC-1α (**P < 0.01, two-tailed Student’s t test). (G–J) qRT-PCR for Sirt1 (G), Tfam (H), Nrf1 (I), and Foxo1 (J) showed that LV-hPGC-1α did not change their expression. Hippocampus (HIP; n = 6), parietal cortex (Pt Ctx; n = 7), and frontal cortex (Ft Ctx; n = 5). Aco2, aconitase 2; Cox-4, cytochrome c oxidase subunit IV; Cox-6, cytochrome c oxidase subunit VI; CS, citrate synthase; Foxo1, forkhead box O1; Nrf1, nuclear respiratory factor 1; Pdk1, pyruvate dehydrogenase kinase; Pfk, phosphofructokinase; Sirt1, sirtuin 1; Tfam, transcription factor A mitochondrial. Data are shown as mean ± SEM, and all samples were run in duplicates. (K) Schematic model showing the mechanistic effects of PGC-1α gene therapy in AD, by affecting BACE1 transcription-leading to reduced Aβ generation and neuroinflammation and increasing the expression of neurotrophic growth factors.
Discussion
The present study shows that gene delivery of hPGC-1α in the brain of transgenic APP23 mice reduced amyloid deposition, improved memory, and prevented neuronal loss. Importantly, we describe a potential treatment that can preserve neuronal viability and improve memory in AD, corroborating other neuroprotective approaches such as gene therapy with growth factors. This approach was recently highlighted in AD patients treated with NGF gene delivery, which revealed increased axonal sprouting, cell hypertrophy, and activation of functional markers (17).
The observed PGC-1α–mediated positive effects, however, do not seem to involve alterations in neuronal proliferation, because the preservation of dentate gyrus integrity, an area directly involved in neurogenesis, remained unchanged by LV-hPGC-1α. Most interestingly, increased expression of neurotrophic factors NGF and BDNF was evident following LV-hPGC-1α gene therapy and both exert neuroprotective properties in AD (18, 19). In line with our findings was the report showing that exercise-induced BDNF expression was mediated by PGC-1α regulation of Fndc5 gene expression (20). Moreover, PPARγ and PPARα, the main transcription factors regulated by PGC-1α, induced the transcription of BDNF in cultured neurons and glial cells (21, 22). Combined, these data are fully consistent with a mechanism for the neuroprotective effects of hPGC-1α in APP23 mice mediated, at least partially, by increased transcription of specific growth factors (Fig. S5K). Consistent with our results, previous work demonstrated that PGC-1α knockout mice develop neurological abnormalities and show prominent neurodegeneration (23, 24).
In addition, our data indicate that the beneficial effects on memory and neurodegeneration are a consequence of the reduction in Aβ generation and the associated inflammatory response, because memory, BDNF levels, PSD95 expression, and neuronal numbers were not affected in wild-type mice that received the same LV-hPGC-1α treatment. Therefore, the therapeutic effect of PGC-1α required a proinflammatory state to be effective, in this case evidently caused by hAPP overexpression and Aβ production in the APP23 mice (Fig. S5K). Furthermore, because we found that hPGC-1α was mostly expressed in neurons, we presume that the antiinflammatory reaction observed by hPGC-1α delivery in the brain is secondary to the decrease on Aβ levels produced by neurons, because Aβ is able to induce a proinflammatory reaction in the brain (25). Our results do not support a noticeable involvement of enhanced mitochondrial function (Fig. S5) or the autophagy/lysosomal pathway in the neuroprotective effects of PGC-1α in APP23, as suggested in other neurological disease models, such as Huntington’s disease (26).
A recent study of a bigenic model obtained crossing the Tg19959 with PGC-1α transgenic mice reported reductions in the levels of Aβ40 by ELISA, whereas increased Congo red staining for aggregated Aβ. The results of this publication were obtained from a transgenic mouse overexpressing elevated levels of PGC-1α under a promoter not specific for a particular cell type and, consequently, the results do not necessarily have to coincide with our model, in which the gene is expressed for only 4 mo in certain brain areas (27). Indeed, sustained high overexpression of PGC-1α produced toxic effects in muscles and heart, caused or accompanied by extensive mitochondrial proliferation and by myopathy (28, 29). Extremely high levels of PGC-1α achieved with adenoviral vectors also resulted in deleterious effects in dopaminergic neurons, in susbtantia nigra (30, 31) as opposed to the striatum, where fourfold higher levels were not toxic, in mouse models of Huntington’s and Parkinson’s diseases (32, 33). The different outcomes in different studies must relate to the fact that dopaminergic neurons are more susceptible to degeneration from oxidative damage than other neuronal subtypes and suggest that selective delivery in specific brain regions is necessary to achieve beneficial effects. The lentiviral vector for delivery of hPGC-1α in our study was well tolerated, did not trigger adverse effects, and allowed sustained expression of the transgene for months. Successful proof-of-principle studies of gene therapy using similarly pseudotyped lentiviral vectors have been demonstrated in animal models of ALS (34, 35), spinal muscular atrophy (36), and spinal nerve injury (37). In addition, we have developed and tested a similar vector for dopamine replacement therapy in late stage Parkinson’s disease patients in a phase I/II clinical trial, showing long-term expression and improved motor behavior in treated patients (38). We believe, therefore, that future innovations in gene therapy provide hope and clinical potential also in Alzheimer’s dementia. Although this method of delivery is at this time invasive and, therefore, has some translational limitations, our data provide a proof of concept for future drug discovery programs aimed to induce the PGC-1α gene to target neurodegeneration.
Materials and Methods
Animals.
Eight-month-old female APP23 mice (Novartis) and wild-type littermates (C57BL/6) were used (12). The experiments were designed and approved in compliance with the UK Home Office.
Lentiviral Vectors and Injections.
Recombinant nonreplicative HIV-1–based LVs were produced based on methods described (39) (SI Materials and Methods).
Immunohistochemistry and Immunofluorescence.
Antibodies were incubated overnight at 4 °C (anti-Αβ MOAB-2 1:1,000, anti-V5 1:500, and anti-NeuN, 1:500) and subsequent developing steps were performed as described (14) (SI Materials and Methods). For immunofluorescent stainings, sections were incubated with AmyloGlo (Biosensis) and primary antibodies against eGFP (Abcam), Iba1 (Wako), GFAP (Invitrogen), and NeuN (Millipore) at 1:500 dilution and detected with secondary antibodies (AlexaFluor dyes; Invitrogen). Images were captured by using a Leica SP5 Confocal microscope.
Protein Analysis.
Western blot analysis was carried out as described (14) by using antibodies against Aβ (clone 6E10) and sAPPβ (Covance), BACE1 (Cell Signaling), PSD-95, IDE and LC3 (Abcam), COX-4 (from Kambiz Alavian, Imperial College London, London, UK), hPGC-1α and neprilysin (Santa Cruz) used at a 1:1,000 dilution, R1(57) (from P. Mehta, New York State Institute for Basic Research in Developmental Disabilities, Staten Island, NY) at a 1:2,000 dilution and 140 (from Jochen Walter, University Bonn, Bonn, Germany) against CT-of APP and APOE (Santa Cruz) at a 1:500 dilution, V5 (Invitrogen) at a 1:5,000, and LRP-1 (from Claus Pietrzik, University Mainz, Mainz, Germany) and β-actin (Abcam) at a 1:10,000 dilution. The intensity of the bands was quantified by densitometry using ImageJ software, and sample loading was normalized to β-actin. The levels of human Αβ40 and Aβ42 were determined by using a High Sensitivity Human Amyloid β40 and β42 ELISA kit (Millipore). For the mouse cytokines, we used kits from Preprotech.
RNA Extraction and qRT-PCR.
Tissues were lysed and homogenized in TRIzol reagent (Ambion), and total RNA was isolated by using the RNeasy mini kit (Qiagen). First-strand cDNA was generated by using Taqman reverse transcription reagents (Applied Biosystems) for Taqman Probes or QuantiTect Reverse Transcription kit (Qiagen) for custom-made primers (SI Materials and Methods). qPCR was performed by using TaqMan Universal PCR Master Mix or Quantifast SYBR green in a 7900HT real-time PCR system (Applied Biosystems). mRNA quantities were normalized to Gapdh after determination by the comparative Ct method.
Statistical Analysis.
The data were analyzed with GraphPad Prism version 6 and SPSS version 20 (IBM) by using two-tailed Student’s t test or Mann–Whitney test, two-way ANOVA followed by Bonferroni post hoc analysis and correlation analysis. Power analysis was performed by using GPower 3.0. Columns represent means ± SEM. Differences were considered significant for P < 0.5.
SI Materials and Methods
Animals.
APP23 mice express the hAPP cDNA carrying the Swedish mutation under the control of the neuronal-specific Thy1.2 promoter and are characterized by amyloid deposition, plaque formation, neuroinflammation, neuronal loss, and memory deficits (12, 13). All of the animals were kept in individually ventilated cages in a 12/12-h light/dark cycle with controlled temperature and humidity and food and water ad libitum.
Lentiviral Vectors.
The hPGC-1α complete coding sequences with GenBank accession no. AF186379 was kindly provided by A. Kralli (The Scripps Research Institute, La Jolla, California) and the HIV-1 packaging plasmids and pRR-sincppt-CMV-eGFP-WPRE were kindly provided by James Uney (University of Bristol, Bristol, UK). hPGC-1α was subcloned on the lentiviral transfer genome by removing the eGFP cDNA (Fig. 1I). All vectors carry the woodchuck hepatitis virus posttranscriptional regulatory element (WPRE).
Titration of LV Vectors.
Biological titer of LV vectors carrying the eGFP reporter gene was determined by flow cytometry as described (39). The copy numbers of the viral preparations were determined by using the Lenti-X qRT-PCR Titration kit (Clontech) using a Lenti-X RNA known copy number sample to generate a standard curve according to the manufacturer’s instructions. The biological titer of LV vectors containing hPGC-1α was extrapolated after calculating the titration ratio of the LV-eGFP (ratio = biological titer/qRT-PCR copies) and by presuming that the two viruses have the same titration ratio, the biological titer was calculated from the formula biological titer = titration ratio/qRT-PCR copies.
Stereotaxic Surgeries.
Animals were anesthetized (isoflurane 5%, 1 L/min O2) and positioned on a stereotactic frame (World Precision Instruments). Injections were performed bilaterally in the frontal cortex and HIP by using a 33-gauge blunt needle attached to a 5-mL Hamilton syringe (Hamilton Medical) at 0.2 μL/min (isoflurane 2%, 0.5 L/min O2 for maintenance of anesthesia). The frontal cortex and the HIP were injected with 2.5 μL and 1.5 μL of viral preparation, respectively (titer of 1 × 10⁹ TU/mL). Stereotactic coordinates were calculated from bregma [cortex: anterior-posterior (AP) +2.2 mm, medial-lateral (ML) ±1.8 mm, dorso-ventral (DV) −3 mm to −0.5 mm, five deposits 0.5 mm apart, 0.5 μL/deposit; HIP: anterior-posterior (AP) −2 mm, medio-lateral (ML) ±1.2 mm, dorso-ventral (DV) −1.5 mm to −1.1 mm, three deposits 0.2 mm apart, 0.5 μL per deposit].
Open Field.
Mice were allowed to freely explore a 45 × 45 cm arena for 5 min, and thigmotaxis, velocity, and total distance moved were assessed by using Ethovision XT version 9 software (Noldus).
OLT.
Hippocampal-dependent spatial memory of the mice was tested by using the OLT. This task can assess learning impairment that is attributed mainly to dysfunctional dorsal and CA1 area of the HIP (40).
NOR Test.
Recognition memory of the mice was tested by using the NOR test. Previous studies have shown that parahippocampal areas of the temporal lobe are involved and the hippocampal formation by using a long delay (24 h) between training and testing (41). Mice received 2 d of habituation in a 45 × 45 cm square arena, and on the third day, they were allowed to explore two identical objects made from large Lego bricks for 10 min (training trial) (Fig. S2E). They were returned to their home cage, and 24 h later, a different shape and color object replaced one of the objects and the mice were returned to the arena for 10 min (testing trial). The total time the animal spent exploring each object (characterized by active sniffing or chewing) was recorded by using EthoVision XT software (Noldus). The time spent on each object was then calculated as a percentage of total object exploration.
Tissue Processing.
Mice were deeply anesthetized with pentobarbitone and then transcardially perfused with 30 mL of ice-cold PBS. The brains were rapidly removed, and the right hemisphere was fixed in 4% (wt/vol) paraformaldehyde in PBS (0.1 M, pH 7.4) for 48 h, cryoprotected in 20% (wt/vol) sucrose in PBS (0.1 M, pH 7.4), and then sectioned at 35 μm by using a vibratome (Leica VT100S). The left hemispheres were dissected, snap frozen, and stored at −80 °C until used for biochemical analyses.
Immunohistochemistry and Immunofluorescence.
Sections were treated for 20 min with 0.6% H2O2 in TBS, permeabilized in TBS-Triton X-100 0.25% (TBS-Tx) for 30 min, and blocked for 1 h with 10% (vol/vol) FBS in TBS-Tx 0.1%. For Αβ staining, an additional step of antigen retrieval with 98% (vol/vol) formic acid was performed before permeabilization. Tiled digital images of sections were obtained at 10× magnification, using a Nikon Eclipse 50i microscope with QImaging Micropublisher 3.3 RTV digital camera, using Image-Pro Plus 6 software (Media Cybernetics). For fluorescent images, tiled digital images of sections were obtained at 10× magnification, using a Nikon Eclipse 80i microscope with QImaging Qi-Cam digital camera also using Image-Pro Plus 6 software (Media Cybernetics).
Image Analyses.
For assessing amyloid and plaque burden, the percentage of the area covered by Aβ or AmyloGlo staining was calculated by using the NIH ImageJ software (seven sections per animal, n = 9). To obtain measures of Aβ-associated microgliosis and astrocytosis, 50 μm2 and 100-μm2 diameter circles, respectively, were centered over plaques to define plaque domains and then superimposed on images of Iba1-stained microglia and GFAP-stained astrocytes. Fluorescent intensities were calculated within each plaque domain in at least three plaques per section and expressed as mean gray area (corresponding to mean pixel intensity, four sections per animal, n = 5). Additionally, the extent of plaque-associated microgliosis and astrocytosis was analyzed by thresholding the images and measuring the percentage of area occupied by Iba1- and GFAP-positive cell bodies and processes within individual plaque domains, serving as an indication of the number of cells bodies around the plaques (42). For neuronal cells quantifications, we measured the number of positive cells in three random squares 150 × 150 μm for subiculum, and 100 × 100 μm for CA3 and the area occupied by the dentage gyrus.
Western Blotting.
Mouse brain samples were homogenized in radioimmunoprecipitation assay buffer (1% Triton X-100, 1% sodium deoxycholate, 0.1% SDS, 150 mM NaCl, and 50 mM Tris⋅HCl, pH 7.2) supplemented with protease and phosphatase inhibitors (Roche).
Determination of Soluble-APP (sAPPα and sAPPβ) and APP CTFs.
To determine soluble APP and αCTFs in brain homogenates, 50 μg were pulled down overnight at 4 °C by using Sepharose Protein A (Zymed) and 140, a polyclonal antibody recognizing the CT-domain of APP (from Jochen Walter, University of Bonn, Bonn, Germany) to immunoprecipitate full-length APP. Samples were then spun down and pellets were then loaded in NuPage 4–12% Tris-glycine gels and transferred onto nitrocellulose membranes and incubated with R1-57 antibody for CTFs determination. Supernatants were run in 10% (wt/vol) SDS gels and incubated with 6E10 antibody at 1/1,000 (a monoclonal antibody recognizing amino acids 1–17 of human Aβ; Covance) for sAPPα and with an antibody against sAPPβ from Covance.
Primers Used in qRT-PCR.
Bace1 (QT00493948) Quantitect Primer assays from Qiagen; Adam10 (Mm00545742_m1), Adam17 (Mm00456428_m1), Bdnf (Mm432069_m1), Foxo1 (Mm00490672_m1), Gapdh (Mm99999915_g1), Ide (Mm00473077_m1), Mme/Nep (Mm00485028_m1), Nrf1 (00447996_m1), PPARGC1A/PGC-1A (Hs01016719_m1), Pdk1 (Mm00554306_m1), Sirt1 (Mm01168521_m1), Tfam (Mm00447485_m1), Taqman gene expression assays from Applied Biosystems; Aco2 (for: 5′-TGATGCAAACCCTGAGACC-3′, rev: 5′-GAGCCTCCAACTTGAACTTCT-3′), ApoE (for: 5′-CTGACAGGATGCCTAGCCG-3′,rev: 5′-CGCAGGTAATCCCAGAAGC-3′), Cox6 (for: 5′-TCATATTGCTGGCGCATTC-3′, rev: 5′-CCTTCCTCATCTCTTCGAAATC-3′), CS (for: 5′-CCAATCTGCACCCTATGTCTC-3′, rev: 5′-GTCCATGCAGTCCTCATAGATG-3′), Gapdh (for: 5′-ACCACAGTCCATGCCATCAC-3′, rev: 5′-TCCACCACCCTGTTGCTGTA-3′), Ngf (for: 5′-CCAGTGAAATTAGGCTCCCTG-3′, rev: 5′-CCTTGGCAAAACCTTTATTGGG-3′) and Pfk (for: 5′-AAGTCTGCCATCACCTGACC-3′, rev: 5′-TCCCACAAGACATACACATGG-3′), custom-made from Sigma-Aldrich UK.
Statistics.
All data were checked for normal distribution by using the Kolmogorov–Smirnov normality test, the Levene median test to ensure that variances are equal, and the Mauchly test of sphericity before performing the appropriate statistical analysis.
Acknowledgments
We thank Antonio Trabalza, James Hislop (University of Aberdeen), and Miriam Ries for technical advice; Prof. James Uney (University of Bristol) for the lentiviral vector constructs; Dr. Aikaterini Kralli for the PGC-1α cDNA plasmid (The Scripps Institute); Dr. Matthias Satufenbiel and Novartis for the APP23 line; and Prof. Fred Van Leuven (University of Leuven) for critical reading of the manuscript. This research was funded by Alzheimer’s research UK Grants ART-PG2009-5 and ARUK-ESG-2013-8 (to M.S.) and European Research Council Advanced Investigators Programme Grant 23314 (to N.D.M.).
Footnotes
The authors declare no conflict of interest.
This article is a PNAS Direct Submission.
This article contains supporting information online at www.pnas.org/lookup/suppl/doi:10.1073/pnas.1606171113/-/DCSupplemental.
References
- 1.Prince M, et al. 2015. World Alzheimer Report 2015, The Global Impact of Dementia: An analysis of prevalence, incidence, cost and trends. [Alzheimer's Disease International (ADI), London]
- 2.Galimberti D, Scarpini E. Alzheimer’s disease: From pathogenesis to disease-modifying approaches. CNS Neurol Disord Drug Targets. 2011;10(2):163–174. doi: 10.2174/187152711794480438. [DOI] [PubMed] [Google Scholar]
- 3.Vassar R. BACE1 inhibitor drugs in clinical trials for Alzheimer’s disease. Alzheimers Res Ther. 2014;6(9):89. doi: 10.1186/s13195-014-0089-7. [DOI] [PMC free article] [PubMed] [Google Scholar]
- 4.Puigserver P, Spiegelman BM. Peroxisome proliferator-activated receptor-gamma coactivator 1 alpha (PGC-1 alpha): Transcriptional coactivator and metabolic regulator. Endocr Rev. 2003;24(1):78–90. doi: 10.1210/er.2002-0012. [DOI] [PubMed] [Google Scholar]
- 5.Austin S, St-Pierre J. PGC1α and mitochondrial metabolism--emerging concepts and relevance in ageing and neurodegenerative disorders. J Cell Sci. 2012;125(Pt 21):4963–4971. doi: 10.1242/jcs.113662. [DOI] [PubMed] [Google Scholar]
- 6.Katsouri L, Blondrath K, Sastre M. Peroxisome proliferator-activated receptor-γ cofactors in neurodegeneration. IUBMB Life. 2012;64(12):958–964. doi: 10.1002/iub.1097. [DOI] [PubMed] [Google Scholar]
- 7.Katsouri L, Parr C, Bogdanovic N, Willem M, Sastre M. PPARγ co-activator-1α (PGC-1α) reduces amyloid-β generation through a PPARγ-dependent mechanism. J Alzheimers Dis. 2011;25(1):151–162. doi: 10.3233/JAD-2011-101356. [DOI] [PubMed] [Google Scholar]
- 8.Qin W, et al. PGC-1alpha expression decreases in the Alzheimer disease brain as a function of dementia. Arch Neurol. 2009;66(3):352–361. doi: 10.1001/archneurol.2008.588. [DOI] [PMC free article] [PubMed] [Google Scholar]
- 9.Gong B, et al. Nicotinamide riboside restores cognition through an upregulation of proliferator-activated receptor-γ coactivator 1α regulated β-secretase 1 degradation and mitochondrial gene expression in Alzheimer’s mouse models. Neurobiol Aging. 2013;34(6):1581–1588. doi: 10.1016/j.neurobiolaging.2012.12.005. [DOI] [PMC free article] [PubMed] [Google Scholar]
- 10.Karuppagounder SS, et al. Dietary supplementation with resveratrol reduces plaque pathology in a transgenic model of Alzheimer’s disease. Neurochem Int. 2009;54(2):111–118. doi: 10.1016/j.neuint.2008.10.008. [DOI] [PMC free article] [PubMed] [Google Scholar]
- 11.Mazarakis ND, et al. Rabies virus glycoprotein pseudotyping of lentiviral vectors enables retrograde axonal transport and access to the nervous system after peripheral delivery. Hum Mol Genet. 2001;10(19):2109–2121. doi: 10.1093/hmg/10.19.2109. [DOI] [PubMed] [Google Scholar]
- 12.Sturchler-Pierrat C, et al. Two amyloid precursor protein transgenic mouse models with Alzheimer disease-like pathology. Proc Natl Acad Sci USA. 1997;94(24):13287–13292. doi: 10.1073/pnas.94.24.13287. [DOI] [PMC free article] [PubMed] [Google Scholar]
- 13.Bondolfi L, et al. Amyloid-associated neuron loss and gliogenesis in the neocortex of amyloid precursor protein transgenic mice. J Neurosci. 2002;22(2):515–522. doi: 10.1523/JNEUROSCI.22-02-00515.2002. [DOI] [PMC free article] [PubMed] [Google Scholar]
- 14.Katsouri L, et al. Prazosin, an α(1)-adrenoceptor antagonist, prevents memory deterioration in the APP23 transgenic mouse model of Alzheimer’s disease. Neurobiol Aging. 2013;34(4):1105–1115. doi: 10.1016/j.neurobiolaging.2012.09.010. [DOI] [PubMed] [Google Scholar]
- 15.Youmans KL, et al. Intraneuronal Aβ detection in 5xFAD mice by a new Aβ-specific antibody. Mol Neurodegener. 2012;7(1):8. doi: 10.1186/1750-1326-7-8. [DOI] [PMC free article] [PubMed] [Google Scholar]
- 16.Calhoun ME, et al. Neuron loss in APP transgenic mice. Nature. 1998;395(6704):755–756. doi: 10.1038/27351. [DOI] [PubMed] [Google Scholar]
- 17.Tuszynski MH, et al. Nerve growth factor gene therapy: Activation of neuronal responses in Alzheimer disease. JAMA Neurol. 2015;72(10):1139–1147. doi: 10.1001/jamaneurol.2015.1807. [DOI] [PMC free article] [PubMed] [Google Scholar]
- 18.Aloe L, Rocco ML, Bianchi P, Manni L. Nerve growth factor: From the early discoveries to the potential clinical use. J Transl Med. 2012;10(1):239. doi: 10.1186/1479-5876-10-239. [DOI] [PMC free article] [PubMed] [Google Scholar]
- 19.Nagahara AH, et al. Early BDNF treatment ameliorates cell loss in the entorhinal cortex of APP transgenic mice. J Neurosci. 2013;33(39):15596–15602. doi: 10.1523/JNEUROSCI.5195-12.2013. [DOI] [PMC free article] [PubMed] [Google Scholar]
- 20.Wrann CD, et al. Exercise induces hippocampal BDNF through a PGC-1α/FNDC5 pathway. Cell Metab. 2013;18(5):649–659. doi: 10.1016/j.cmet.2013.09.008. [DOI] [PMC free article] [PubMed] [Google Scholar]
- 21.Kariharan T, et al. Central activation of PPAR-gamma ameliorates diabetes induced cognitive dysfunction and improves BDNF expression. Neurobiol Aging. 2015;36(3):1451–1461. doi: 10.1016/j.neurobiolaging.2014.09.028. [DOI] [PubMed] [Google Scholar]
- 22.Roy A, et al. HMG-CoA reductase inhibitors bind to PPARα to upregulate neurotrophin expression in the brain and improve memory in mice. Cell Metab. 2015;22(2):253–265. doi: 10.1016/j.cmet.2015.05.022. [DOI] [PMC free article] [PubMed] [Google Scholar]
- 23.Leone TC, et al. PGC-1alpha deficiency causes multi-system energy metabolic derangements: Muscle dysfunction, abnormal weight control and hepatic steatosis. PLoS Biol. 2005;3(4):e101. doi: 10.1371/journal.pbio.0030101. [DOI] [PMC free article] [PubMed] [Google Scholar]
- 24.Lin J, et al. Defects in adaptive energy metabolism with CNS-linked hyperactivity in PGC-1alpha null mice. Cell. 2004;119(1):121–135. doi: 10.1016/j.cell.2004.09.013. [DOI] [PubMed] [Google Scholar]
- 25.Sastre M, et al. Nonsteroidal anti-inflammatory drugs repress beta-secretase gene promoter activity by the activation of PPARgamma. Proc Natl Acad Sci USA. 2006;103(2):443–448. doi: 10.1073/pnas.0503839103. [DOI] [PMC free article] [PubMed] [Google Scholar]
- 26.Tsunemi T, et al. PGC-1α rescues Huntington’s disease proteotoxicity by preventing oxidative stress and promoting TFEB function. Sci Transl Med. 2012;4(142):142ra97. doi: 10.1126/scitranslmed.3003799. [DOI] [PMC free article] [PubMed] [Google Scholar]
- 27.Dumont M, et al. PGC-1α overexpression exacerbates β-amyloid and tau deposition in a transgenic mouse model of Alzheimer’s disease. FASEB J. 2014;28(4):1745–1755. doi: 10.1096/fj.13-236331. [DOI] [PMC free article] [PubMed] [Google Scholar]
- 28.Miura S, et al. Overexpression of peroxisome proliferator-activated receptor γ co-activator-1α leads to muscle atrophy with depletion of ATP. Am J Pathol. 2006;169(4):1129–1139. doi: 10.2353/ajpath.2006.060034. [DOI] [PMC free article] [PubMed] [Google Scholar]
- 29.Russell LK, et al. Cardiac-specific induction of the transcriptional coactivator peroxisome proliferator-activated receptor gamma coactivator-1alpha promotes mitochondrial biogenesis and reversible cardiomyopathy in a developmental stage-dependent manner. Circ Res. 2004;94(4):525–533. doi: 10.1161/01.RES.0000117088.36577.EB. [DOI] [PubMed] [Google Scholar]
- 30.Ciron C, Lengacher S, Dusonchet J, Aebischer P, Schneider BL. Sustained expression of PGC-1α in the rat nigrostriatal system selectively impairs dopaminergic function. Hum Mol Genet. 2012;21(8):1861–1876. doi: 10.1093/hmg/ddr618. [DOI] [PMC free article] [PubMed] [Google Scholar]
- 31.Clark J, et al. Pgc-1α overexpression downregulates Pitx3 and increases susceptibility to MPTP toxicity associated with decreased Bdnf. PLoS One. 2012;7(11):e48925. doi: 10.1371/journal.pone.0048925. [DOI] [PMC free article] [PubMed] [Google Scholar]
- 32.Cui L, et al. Transcriptional repression of PGC-1α by mutant huntingtin leads to mitochondrial dysfunction and neurodegeneration. Cell. 2006;127(1):59–69. doi: 10.1016/j.cell.2006.09.015. [DOI] [PubMed] [Google Scholar]
- 33.St-Pierre J, et al. Suppression of reactive oxygen species and neurodegeneration by the PGC-1 transcriptional coactivators. Cell. 2006;127(2):397–408. doi: 10.1016/j.cell.2006.09.024. [DOI] [PubMed] [Google Scholar]
- 34.Ralph GS, et al. Silencing mutant SOD1 using RNAi protects against neurodegeneration and extends survival in an ALS model. Nat Med. 2005;11(4):429–433. doi: 10.1038/nm1205. [DOI] [PubMed] [Google Scholar]
- 35.Azzouz M, et al. VEGF delivery with retrogradely transported lentivector prolongs survival in a mouse ALS model. Nature. 2004;429(6990):413–417. doi: 10.1038/nature02544. [DOI] [PubMed] [Google Scholar]
- 36.Azzouz M, et al. Lentivector-mediated SMN replacement in a mouse model of spinal muscular atrophy. J Clin Invest. 2004;114(12):1726–1731. doi: 10.1172/JCI22922. [DOI] [PMC free article] [PubMed] [Google Scholar]
- 37.Wong L-F, et al. Retinoic acid receptor beta2 promotes functional regeneration of sensory axons in the spinal cord. Nat Neurosci. 2006;9(2):243–250. doi: 10.1038/nn1622. [DOI] [PubMed] [Google Scholar]
- 38.Palfi S, et al. Long-term safety and tolerability of ProSavin, a lentiviral vector-based gene therapy for Parkinson’s disease: A dose escalation, open-label, phase 1/2 trial. Lancet. 2014;383(9923):1138–1146. doi: 10.1016/S0140-6736(13)61939-X. [DOI] [PubMed] [Google Scholar]
- 39.Eleftheriadou I, Trabalza A, Ellison S, Gharun K, Mazarakis N. Specific retrograde transduction of spinal motor neurons using lentiviral vectors targeted to presynaptic NMJ receptors. Mol Ther. 2014;22(7):1285–1298. doi: 10.1038/mt.2014.49. [DOI] [PMC free article] [PubMed] [Google Scholar]
- 40.Assini FL, Duzzioni M, Takahashi RN. Object location memory in mice: Pharmacological validation and further evidence of hippocampal CA1 participation. Behav Brain Res. 2009;204(1):206–211. doi: 10.1016/j.bbr.2009.06.005. [DOI] [PubMed] [Google Scholar]
- 41.Hammond RS, Tull LE, Stackman RW. On the delay-dependent involvement of the hippocampus in object recognition memory. Neurobiol Learn Mem. 2004;82(1):26–34. doi: 10.1016/j.nlm.2004.03.005. [DOI] [PubMed] [Google Scholar]
- 42.Rodriguez GA, Tai LM, LaDu MJ, Rebeck GW. Human APOE4 increases microglia reactivity at Aβ plaques in a mouse model of Aβ deposition. J Neuroinflammation. 2014;11(1):111. doi: 10.1186/1742-2094-11-111. [DOI] [PMC free article] [PubMed] [Google Scholar]


