Significance
Newly synthetized enzymes must fold correctly and associate with cofactors to reach their functional state. Mutations often interfere with the structural and functional maturation and lead to unstable proteins. Here we demonstrate that cofactor deprivation caused by vitamin B2 deficiency results in the destabilization of a significant fraction of flavin-containing enzymes, even if they have wild-type sequences. The accumulation of conditionally unstable proteins would overload cellular protein degradation systems; consequently, these proteins would contribute to amyloidogenesis and protein aggregation disorders. Because nutritional deficits often develop in aging organisms, this study provides an additional, protein stability-based explanation of the connection between vitamin supplies and healthy aging.
Keywords: apoprotein, ubiquitin ligase, protein aggregation
Abstract
Protein biogenesis is tightly linked to protein quality control (PQC). The role of PQC machinery in recognizing faulty polypeptides is becoming increasingly understood. Molecular chaperones and cytosolic and vacuolar degradation systems collaborate to detect, repair, or hydrolyze mutant, damaged, and mislocalized proteins. On the other hand, the contribution of PQC to cofactor binding-related enzyme maturation remains largely unexplored, although the loading of a cofactor represents an all-or-nothing transition in regard to the enzymatic function and thus must be surveyed carefully. Combining proteomics and biochemical analysis, we demonstrate here that cells are able to detect functionally immature wild-type enzymes. We show that PQC-dedicated ubiquitin ligase C-terminal Hsp70-interacting protein (CHIP) recognizes and marks for degradation not only a mutant protein but also its wild-type variant as long as the latter remains cofactor free. A distinct structural feature, the protruding C-terminal tail, which appears in both the mutant and wild-type polypeptides, contributes to recognition by CHIP. Our data suggest that relative insufficiency of apoprotein degradation caused by cofactor shortage can increase amyloidogenesis and aggravate protein aggregation disorders.
Protein quality control (PQC) machinery is composed of molecular chaperones and cytosolic and vacuolar degradation systems (1–3). Its impairment or relative insufficiency caused by substrate overload contributes significantly to the pathogenesis of a number of severe protein aggregation disorders, such as Parkinson’s and Alzheimer’s diseases (4–6). Therefore there is an urgent need to understand the function of PQC better, and significant advances have been made in this respect recently (7, 8).
PQC uses various strategies to recognize faulty and damaged proteins, and, apart from exposed hydrophobic patches, it has been difficult to identify structural features predictably determining the susceptibility of a protein to PQC recognition (9). Learning to recognize mutant polypeptides might have been a nontrivial evolutionary task, given that somatic mutations are sporadic and diverse. Cofactor-free apoproteins would be a more consistent set of structurally deficient polypeptides. Vitamins from food or symbiotic microorganisms are biotransformed by cells into organic cofactors that then associate with apoproteins, thus completing functional maturation of the respective enzymes. For example, riboflavin, also known as vitamin B2, is the precursor of flavin mononucleotide (FMN) and flavin adenine dinucleotide (FAD) cofactors, which define a small, but highly important flavoproteome encoded by ca. 100 genes in humans (10). Previous work with rats demonstrated that a riboflavin-deficient diet strongly destabilizes some of the mitochondrial flavoproteins, such as isovaleryl-CoA dehydrogenase and short-chain acyl-CoA dehydrogenase (11). More recently, cytosolic flavoprotein NAD(P)H:quinone oxidoreductase 1 (NQO1) was shown to unfold and become susceptible for degradation by 20S proteasome when cofactor free in vitro (12).
We were intrigued by the possibility that wild-type proteins can be recognized by the PQC depending on their functional maturity and based on minor structural deficits. We set out to determine how general the destabilization of the flavoproteome is when the cofactor precursor is lacking.
Results
Depletion of Riboflavin Destabilizes the Flavoproteome.
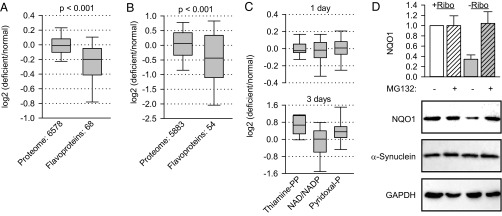
Murine melanoma cell line B16 was cultivated in riboflavin-free medium for 24 h followed by proteomics analysis. We were able to quantify 68 flavoproteins and found that their median abundance decreased by ca. 13% compared with the riboflavin-sufficient condition (Fig. 1A and Datasets S1 and S2). In contrast, the median abundance of the remaining proteome (6,578 proteins) did not change essentially, arguing against the general suppression of protein biosynthesis. The difference between the two sets turned out to be highly significant (Mann–Whitney test, P < 0.001) and likely arises from the selective degradation of flavoproteins unable to bind the required cofactors. Indeed, proteasome inhibition partially or fully rescued 8 of the 10 most strongly affected flavoproteins (Fig. S1A and Dataset S1). Thereby, four proteins reached quantities higher than seen in normal conditions. This increase must be caused by their high turn-over rate, because proteasome inhibition resulted in the accumulation of all four proteins in normal medium as well (Dataset S1). We repeated the analysis of the B16 melanoma proteome following 3 d of starvation in riboflavin-free medium. The average level of the flavoproteome (54 proteins) was reduced even more strongly, falling to 74% of the nonstarved control (Fig. 1B and Datasets S3 and S4). Again, the rest of the proteome (5,883 proteins) did not change. Several flavoproteins bind flavins covalently; the rest interact with flavins noncovalently, but strongly, showing dissociation constants between 10−7 and 10−10 M (13). High affinity implies that flavoproteins would not lose their cofactors readily and that when riboflavin supplies are reduced the apo state probably is populated mainly by newly synthesized proteins. Thus, a decrease of flavoproteome by 13% in 1 d might indicate highly efficient degradation of its newly synthesized fraction. Much higher degradation of flavoprotein would not occur when cells are starved longer because cells eventually stop proliferating (14), apparently reducing protein synthesis along with other metabolic adjustments. To test the specificity of the destabilization, we looked at additional classes of cofactor-containing enzymes. Enzymes relying on vitamins B1, B3, or B6 for their structural and functional integrity were not destabilized under riboflavin-free conditions (Fig. 1C). Enzymes containing thiamine or pyridoxal were up-regulated after longer starvation, probably as an adaptation to the metabolic stress imposed by the lack of riboflavin (Fig. 1C, Lower).
Fig. 1.
Depletion of riboflavin destabilizes the flavoproteome. (A and B) B16 murine melanoma cells were incubated in normal and riboflavin-deficient medium for 24 h (A) or 3 d (B). Then their proteomes were compared by quantitative mass spectrometry. Average changes from four experiments for each protein in the two groups are plotted. The significance of the difference between the medians of the two groups was assessed by Mann–Whitney test and is indicated. (C) Average changes in protein groups containing the indicated cofactors were determined after 1 d or 3 d. (D) Degradation of endogenous NQO1 in B16 cells upon riboflavin depletion (−Ribo) for 24 h (n = 3, mean ± SD). The stability of endogenous α-synuclein was analyzed. GAPDH was used as loading control.
Fig. S1.
Protein degradation in riboflavin-deficient medium. (A) The effect of proteasome inhibition by 5 μM MG132 (−Riboflavin + MG132) was analyzed for the 10 flavoproteins that were most affected by riboflavin depletion (−Riboflavin). Averages are from four independent experiments as quantified by label-free mass spectrometry. The amount of each protein in riboflavin-containing medium was set as 1. The gene names of the proteins are shown; the protein names can be found in Dataset S1. (B) The accumulation of transfected wild-type p53 in B16 cells (n = 3, mean ± SD) in normal (+Ribo) and riboflavin-deficient (−Ribo) medium was analyzed 24 h after transfection. The upper band (asterisk) was used for quantification. The amount of p53 in untreated cells was set as 1. GAPDH was used as lysate loading control.
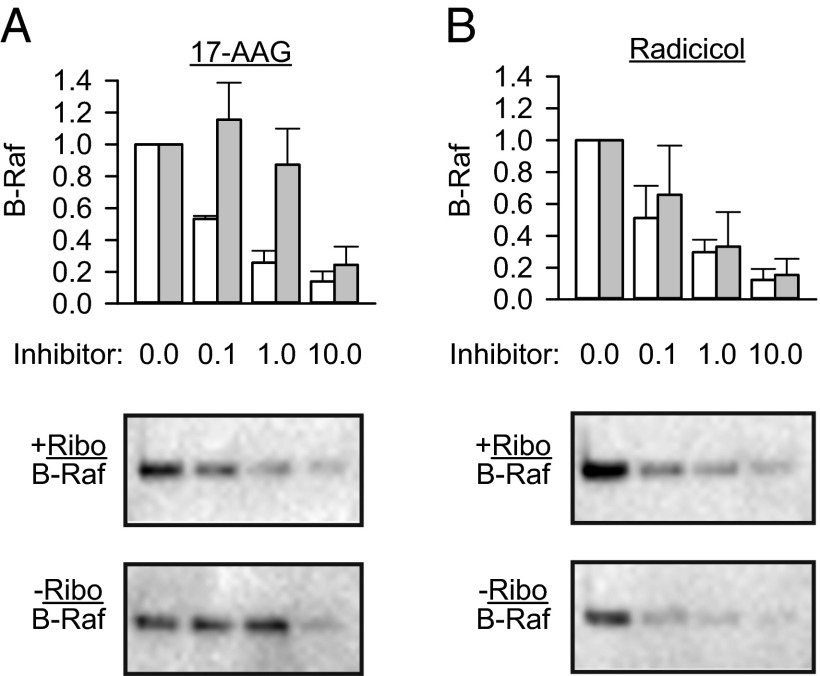
Next, we analyzed in detail the cellular destabilization of NQO1, one of the most affected flavoproteins according to the mass spectrometry data. Complementary to the previous report that the increased riboflavin concentration in medium correlates with the accumulation of NQO1 (12) and in agreement with our proteomics data, the steady-state levels of NQO1 dropped in cells cultured without riboflavin, and the inhibition of proteasome rescued the enzyme from degradation (Fig. 1D). The levels of α-synuclein remained unaffected (Fig. 1D). This result is important, indicating that the proposed function of NQO1 as an inhibitor of unselective degradation of disordered proteins (12) does not operate efficiently in our experimental system. Likewise, P53, another protein that might succumb to 20S hydrolysis in the absence of NQO1, was not degraded more under riboflavin-free conditions (Fig. S1B). To assess the functional consequences of riboflavin depletion, we exploited NQO1 metabolization of a number of chemotherapeutics, including a benzoquinone class of heat shock protein 90 (HSP90) inhibitors, such as 17-(allylamino)-17-demethoxygeldanamycin (17-AAG), into more active derivatives (15). HSP90, through association, protects a number of oncogenic kinases from degradation; consequently, HSP90 inhibition results in their degradation (16). We predicted that lack of riboflavin, by causing a decrease in NQO1 protein levels (Fig. 1D), should affect cellular sensitivity to 17-AAG treatment. We added increasing amounts of 17-AAG and measured the extent of degradation of one of the HSP90 substrates, the B-Raf V600E mutant (17). Indeed, higher concentrations of 17-AAG were needed to deplete the oncogene under riboflavin-free conditions (Fig. S2). The effectiveness of radicicol (18), another HSP90 inhibitor from a chemically unrelated class that is not metabolized by NQO1, remained unchanged (Fig. S2).
Fig. S2.
Riboflavin deficiency affects the function of NQO1. The efficiency of HSP90 inhibition by 17-AAG (A) or radicicol (B) in riboflavin-containing (+Ribo, white bars) and riboflavin-deficient (−Ribo, gray bars) medium was analyzed by measuring the degradation of the HSP90 client kinase B-Raf (V600E mutant) using Western blotting (n = 3, mean ± SD). The amount of B-Raf in untreated cells was set as 1. Western blotting results from one representative experiment are shown.
Cofactor-Free NQO1 Is Recognized by C-Terminal Hsp70-Interacting Protein.
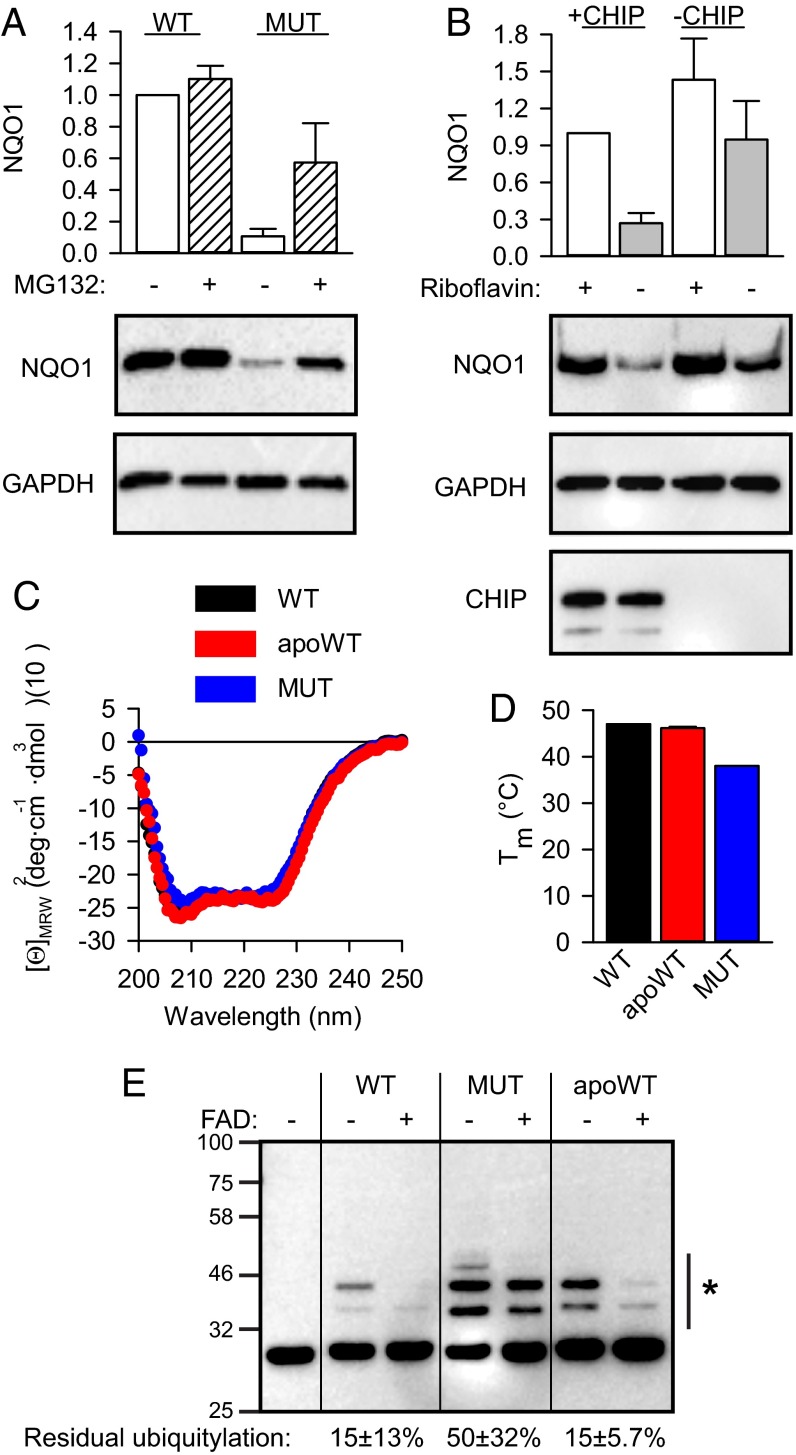
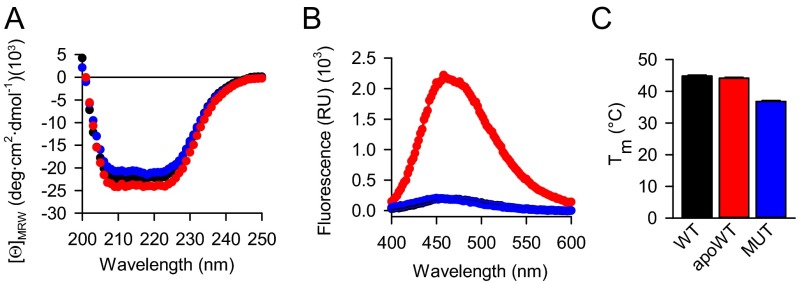
One allelic variant of NQO1, the proline187-to-serine mutant (P187S), has been associated with different forms of cancer (19). The mutant was shown to be unstable in cells (12, 20), at least partially because of polyubiquitylation by the ubiquitin ligase C-terminal Hsp70-interacting protein (CHIP) (21). We confirmed this destabilization by performing transient transfections of mutant NQO1 (Fig. 2A). Because the mutant is known to have reduced affinity for FAD [Kd of 64 nM vs. 427 nM for wild-type and mutant NQO1, respectively (22)], we were intrigued by the possibility that the mutant and the FAD-free wild-type proteins share apo-state–related structural features and thus might be recognized similarly by the cellular PQC machinery. To test whether CHIP can recognize apoNQO1, we prepared cells in which CHIP was deleted by means of CRISPR/Cas9 genome editing. Reintroduction of CHIP by transient transfection strongly sensitized wild-type NQO1 to riboflavin depletion (Fig. 2B). There was some reduction of NQO1 upon riboflavin depletion in CHIP-free conditions as well (Fig. 2B); this reduction might be attributed to the degradation of empty NQO1 by an additional mechanism. To analyze the recognition of mutant and wild-type apoNQO1, we set out to reconstitute this process in vitro using purified proteins (Fig. S3). Structurally, apoNQO1 and the cofactor-containing protein turned out to be similar. The mutant displayed a slightly increased hydrodynamic radius (Fig. S3A); however, CD spectroscopy revealed a secondary structure similar to that of the wild type (Fig. 2C), an observation in agreement with a recent report (23). Together with the lower melting temperature (Fig. 2D) and increased 8-anilino-1-naphthalene-sulfonic acid (ANS) dye binding (Fig. S3C), these results indicated that mutant NQO1 populates native-like forms lacking tight packing. Although ANS binding was increased for apoNQO1, its fluorescence maximum was shifted compared with that of the mutant, indicating a specific ANS–protein interaction (Fig. S3C). Indeed, ANS binding is a long-known property of cofactor-free proteins (24) and seems to occur in the cofactor pockets (25). Using purified components, we were able to reconstitute the direct ubiquitination of NQO1 by CHIP in vitro (Fig. 2E). As mutant NQO1, the wild-type apoprotein was recognized and ubiquitylated efficiently, and reloading of the enzyme with FAD rescued it from processing by CHIP (Fig. 2E). A higher than intracellular FAD concentration was needed for the latter effect (26), perhaps because loading flavoproteins with cofactors in vivo is an active and thus more efficient process (27). There was some recognition of wild-type NQO1 (as purified), in accordance with the incomplete loading of the cofactor on recombinant flavoproteins (28).
Fig. 2.
Cofactor-free NQO1 is recognized and ubiquitylated by CHIP. (A) The accumulation of transfected wild-type and P187S mutant (MUT) NQO1 in B16 cells (n = 3, mean ± SD). Hatched bars indicate samples treated with 5 μM MG132. (B) The accumulation of transfected wild-type NQO1 in CHIP-deficient B16 cells (n = 3, mean ± SD). Gray bars indicate cells cultivated in riboflavin-free medium for 24 h. +CHIP, reintroduction of CHIP by transient transfection. (C and D) Biophysical analyses of wild-type (black), apoprotein (apoWT, red), and P187S mutant (MUT, blue) NQO1. (C) CD spectroscopy. Average values from three independent measurements are plotted. (D) Average melting temperature (Tm) is plotted (n = 3, mean ± SD). (E) In vitro ubiquitylation assay of the indicated proteins by CHIP. Anti-NQO1 antibody was used to detect ubiquitylated species. The side bar with an asterisk indicates the bands used for quantification. Ubiquitylation without added FAD was set as 100%. Residual ubiquitylation in the presence of 250 μM FAD is indicated (n = 3, mean ± SD). Western blotting results from one representative experiment are shown.
Fig. S3.
Preparation of cofactor-free NQO1. (A) Gel filtration of wild-type NQO1 (black trace, covered by the red trace), apoprotein (red trace), and P187S mutant (blue trace). The maximum absorbance at 280 nm was set as 100. The absorbance of eluting proteins is shown. (B) Wild-type NQO1 (black trace), apoprotein (red trace), and the P187S mutant (blue trace) were processed, and the fluorescence of the released FAD was measured as detailed in SI Materials and Methods. FAD (1,000 nM) was included as positive control (green trace). (C) ANS binding of wild-type NQO1 (black trace), apoprotein (red trace), and the P187S mutant (blue trace). One representative of three independent measurements is plotted.
The C-Terminus Sensitizes NQO1 to Recognition by CHIP.
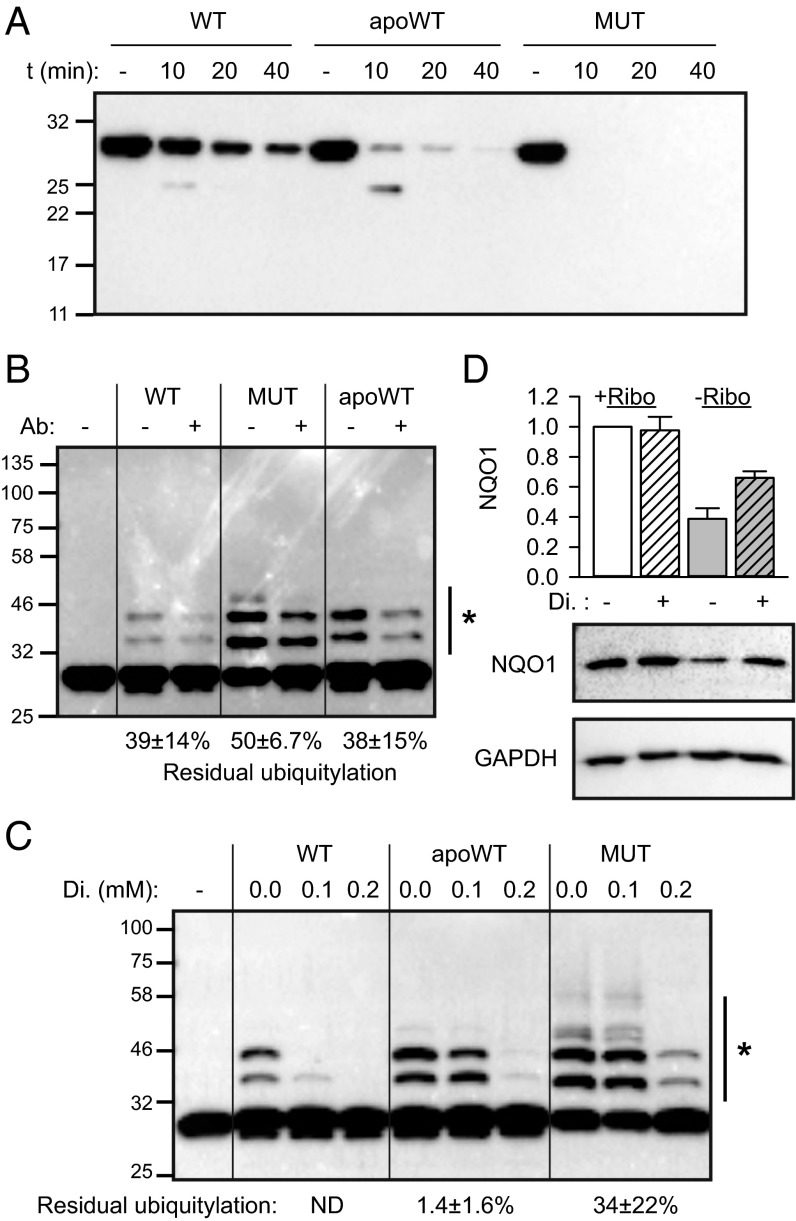
We wondered whether the FAD-free wild-type NQO1 and the mutant with reduced affinity for the cofactor are recognized through the same structural determinants. Recent analysis of the mutant NQO1 indicated that the C-terminal tail loses its proper association with the core domain, especially when the NADH-binding pocket is not occupied (22, 29). A protease sensitivity assay combined with Western blotting using a C-terminal tail-reacting antibody confirmed the rapid loss of the C-terminus by the mutant and the wild-type apoNQO1 (Fig. 3A). Because wild-type and apoNQO1 seem to be very similar structurally (Fig. 2C and Fig. S3A), the protease sensitivity indicates that the latter has higher dynamics of the C-terminus. For the cellular PQC machinery, the undocked tail might represent a signal of defectiveness, and CHIP is well-suited to recognize the protruding C termini (30, 31). Indeed, the recognition and ubiquitylation of apoNQO1 by CHIP were reduced by more than half in the presence of the C-terminal tail-reacting antibody (Fig. 3B). This antibody most probably recognizes and stabilizes the docked conformation of the last 12 amino acids of NQO1. In accordance with the more pronounced C-terminal destabilization of mutant NQO1 (Fig. 3A), the antibody was less efficient in protecting the mutant variant (Fig. 3B). The same mechanism could underlie the weaker rescue of mutant NQO1 by FAD (Fig. 2E) and is supported by a comparison of wild-type and mutant NQO1 in recent analyses (29). These analyses further demonstrated that dicoumarol, an inhibitor of NQO1, can lead to strong accumulation of mutant NQO1 and some accumulation of the wild-type protein under normal riboflavin concentrations in cell culture (29). Indeed, the crystal structure reveals van der Waals interactions between the inhibitor and phenylalanine236 of the C-terminal tail of NQO1 (32). If the wild-type apoprotein is recognized via the protruding C-terminus, then dicoumarol should protect it also. Both in vitro (Fig. 3C) and in vivo (Fig. 3D) assays confirmed this prediction.
Fig. 3.
The C-terminus sensitizes NQO1 to recognition by CHIP. (A) Hydrolysis of the protruding C-terminus of wild-type NQO1, apoNQO1 (apoWT), and the P187S mutant (MUT) using trypsin. Hydrolysis time (t) is indicated. Anti-NQO1 antibody recognizing the last 12 amino acids of the protein was used. One representative experiment of three is shown. (B) Residual ubiquitylation of different forms of NQO1 in the presence of the C-terminus of NQO1-recognizing antibody was analyzed and is indicated (n = 3, mean ± SD). The side bar with an asterisk indicates the bands used for quantification. Ubiquitylation without added antibody was set as 100%. (C) Residual ubiquitylation of different forms of NQO1 in the presence of the indicated concentrations of dicoumarol (Di.) was analyzed. The side bar with an asterisk indicates the bands used for quantification. Ubiquitylation without added dicoumarol was set as 100%; residual ubiquitylation at 0.2 mM dicoumarol is indicated (n = 3, mean ± SD). (D) Rescue of apoNQO1 in riboflavin-free medium (−Ribo) by dicoumarol (n = 3, mean ± SD). Hatched bars represent samples treated with 100 μM dicoumarol for 24 h.
Tail-Free NQO1 Escapes Cofactor-Dependent Recognition.
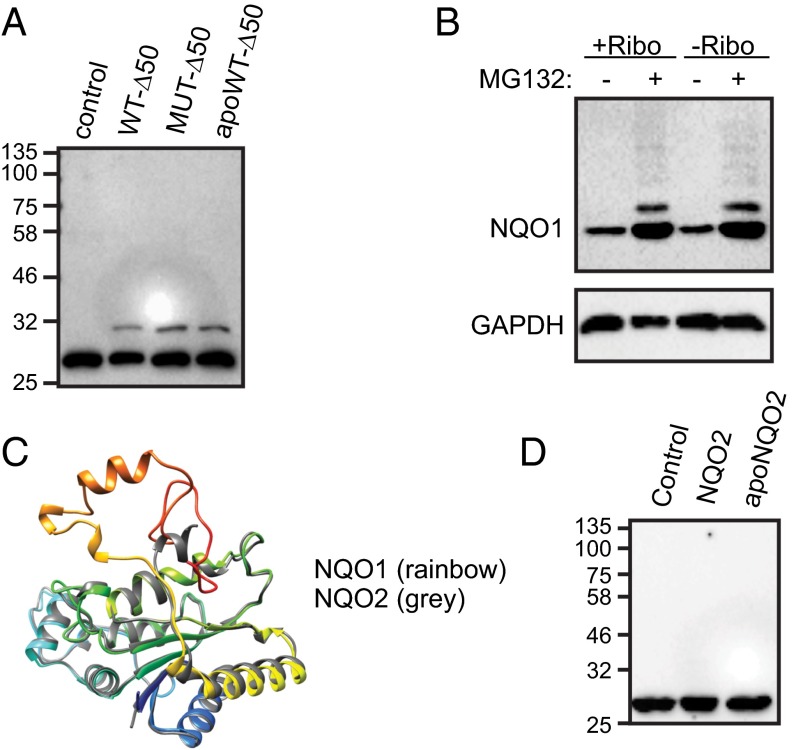
To investigate further the contribution of the C-terminal tail to the recognition of the cofactor-free state by PQC, we engineered and purified tail-truncated wild-type and mutant NQO1 (NQO1-Δ50) (Fig. S4). As expected, these variants showed greatly reduced ubiquitylation by CHIP in vitro (Fig. 4A). Furthermore, the wild-type tail-free variant of NQO1 became insensitive to riboflavin-dependent degradation in vivo (Fig. 4B, lanes 1 and 3). Because the loss of apo-state detection by PQC was complete, the result indicates that in cytosol not only CHIP but also additional cofactor-dependent degradation pathways did not operate upon apoNQO1 without C-terminal tail (Fig. 2B, lanes 3 and 4). Although we cannot exclude the possibility that the tail is used for both recognition and ubiquitin chain attachment, the accumulation of ubiquitin-conjugated NQO1-Δ50 upon proteasome inhibition indicates that other ubiquitylation sites are also available and functional (Fig. 4B). The in vitro melting stability of the apoNQO1-Δ50 (Fig. S4C) did not differ greatly from that of full-length apoNQO1, suggesting that additional cellular factors support efficient cofactor-independent degradation of the truncated enzyme.
Fig. S4.
Biophysical analyses of Δ50-NQO1 variants: wild-type Δ50-NQO1 (WT, black), apoprotein Δ50-NQO1 (apoWT, red), and Δ50-NQO1 P187S mutant (MUT, blue). (A) CD spectroscopy. Average values from three independent measurements are plotted. (B) ANS binding. One representative of three independent measurements is plotted. (C) Melting of the indicated protein was measured using a fluorescent melting assay. Average melting temperature is plotted (n = 3, mean ± SD).
Fig. 4.
Tail-free NQO1 and its paralogue NQO2 escape recognition by CHIP. (A) C-terminally truncated variants of NQO1 (wild-type, WT-Δ50; P187S mutant, MUT-Δ50; apoprotein, apoWT-Δ50) are not ubiquitylated by CHIP in vitro. One representative experiment of three is shown. (B) Stability of C-terminally truncated NQO1 in B16 cells in riboflavin-containing (+Ribo) and riboflavin-free (−Ribo) medium. Where indicated, cells were treated with 5 μM MG132 to inhibit proteasomal degradation. One representative experiment of three is shown. (C) Overlay of X-ray structures of human NQO1 [Protein Data Bank (PDB) ID code 1D4A] and NQO2 (PDB ID code 3FW1). (D) Lack of ubiquitylation of wild-type NQO2 and its apoform (apo-NQO2) by CHIP in vitro. One representative experiment of three is shown.
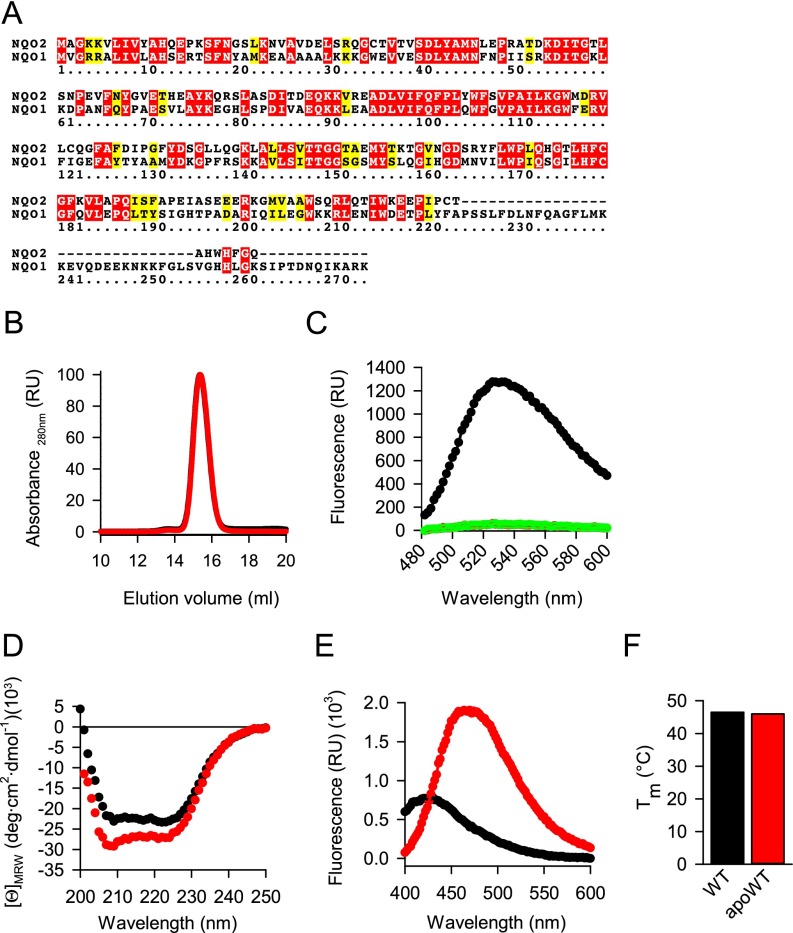
Nature evolved its own truncated form of NQO1, the paralogue protein NQO2 (33). With an rmsd of 0.73 Å over the shared similarity region of 219 Cα atoms (Fig. S5A), NQO2 is very similar to the NQO1 except that it lacks the C-terminal 43 amino acids (Fig. 4C). We purified recombinant NQO2, prepared its FAD-free form, and characterized them biophysically (Fig. S5 B–F). As predicted from the lack of the C-terminal tail, neither FAD-loaded nor apoNQO2 was recognized by CHIP (Fig. 4D). The C-terminal domain of NQO1 is involved in binding the adenosine and diphosphate moieties of the co-substrate NAD(P)H, which is not used by NQO2; instead, NQO2 uses dihydronicotinamide riboside (NRH) (33). One might speculate that NQO2 lost its C-terminal tail after it had switched to NRH, because this co-substrate does not need the C-terminal tail to stabilize its binding. Consequently, a different strategy must be used to detect and degrade FAD-free NQO2.
Fig. S5.
Preparation and characterization of cofactor-free NQO2. (A) Sequences of human NQO1 (UniProt ID 15559) and NQO2 (UniProt ID P16083) were aligned using the CLUSTALW algorithm. Identical amino acids are in red; similar amino acids are in yellow. (B) Gel filtration of wild-type NQO2 (black trace, covered by the red trace) and apoprotein (red trace). The maximum absorbance at 280 nm was set as 100. The absorbance of eluting proteins is shown. (C) Wild-type NQO2 (black trace) and apoprotein (red trace, covered by the green trace) were processed, and the fluorescence of the released FAD was measured as detailed in SI Materials and Methods. FAD (1,000 nM) was included as a positive control (green trace). (D–F) Biophysical analyses of wild-type NQO2 (black traces) and apoprotein NQO2 (apoWT; red traces). (D) CD spectroscopy. Average values from three independent measurements are plotted. (E) ANS binding. One representative of three independent measurements is plotted. (F) Melting of the indicated protein was measured using a fluorescent melting assay. The average melting temperature is plotted (n = 3, mean ± SD).
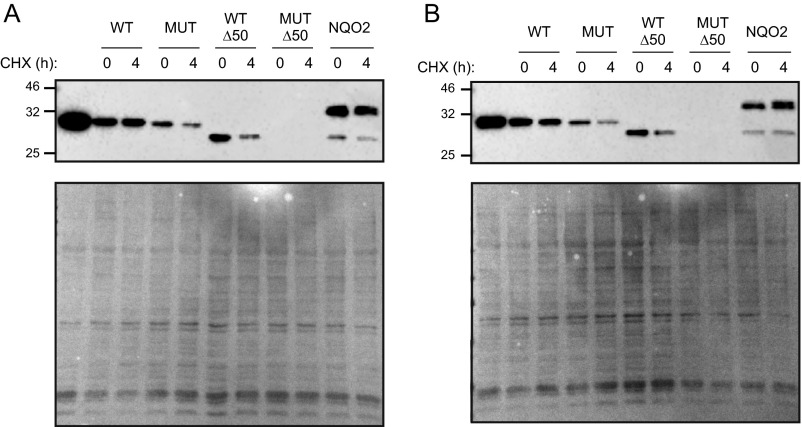
While comparing the stability of the above proteins in a cycloheximide chase assay, we observed that PQC degraded mutant and truncated proteins very early compared with the full-length apoNQO1 (Fig. S6). As soon as 4–8 h after transfection, protein levels of different NQO1 variants became very different. This finding suggests that different arms of PQC operate with different efficiency, giving apoproteins more time to find their cofactors.
Fig. S6.
Analysis of the in vivo stability of different flavoproteins by cycloheximide chase. HEK293T cells were electroporated with wild-type NQO1, the P187S mutant (MUT), Δ50-NQO1 (WTΔ50), or the Δ50-NQO1-P187S mutant (MUTΔ50), and NQO2 expression plasmids and were incubated in normal (A) or riboflavin-deficient (B) medium. Four hours later, half of the cells were collected and lysed; 1 mM cycloheximide (CHX) was added to the other half to stop protein synthesis for an additional 4 h. A portion of the wild-type NQO1-transfected cells was kept without cycloheximide to document the ongoing translation (first lanes in A and B). (Upper) Amounts of flavoproteins were determined using Western blotting. (Lower) Lysate loading was controlled by Ponceau staining. One representative of two experiments is shown.
Cofactor Depletion Exacerbates Enzyme Aggregation and Amyloidogenesis.
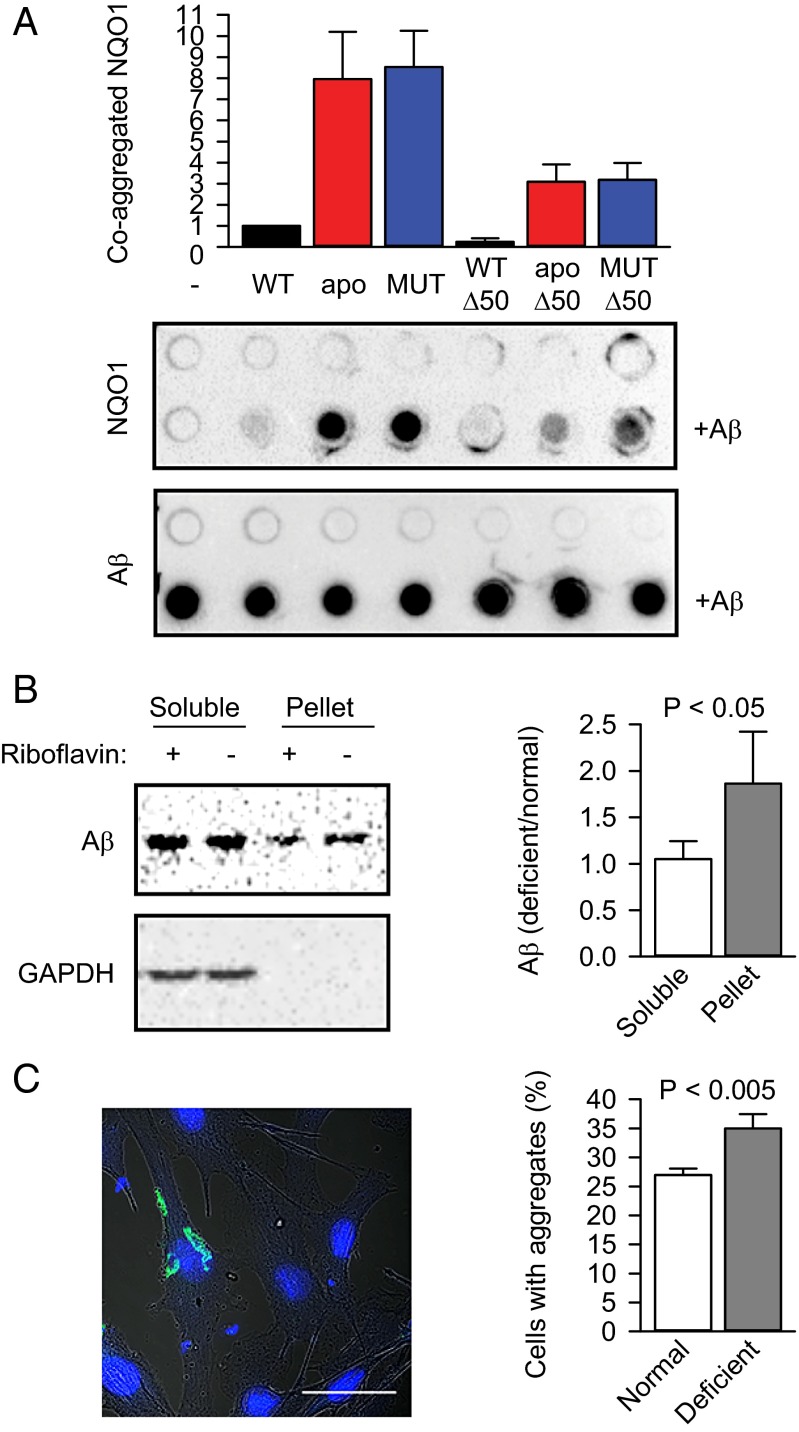
If not cleared by proteasomal or vacuolar degradation, mutant proteins accumulate and lead to cellular dysfunction and protein aggregation disorders (4–6). The coaggregation of metastable bystander proteins results in multifunctional defects (34, 35). Are apoproteins more vulnerable to aggregation as well? To initiate aggregation in vitro, we used amyloid-β peptide (Aβ1–42) from the amyloid precursor protein known to form amyloid plaques in Alzheimer’s patients (36). Different variants of NQO1 protein were incubated alone or together with Aβ1–42, and their coaggregation was analyzed by the filter trap assay. Alone, none of the proteins formed detectable aggregates (Fig. 5A, upper row on the upper filter). Excitingly, not only mutant, but also wild-type apoNQO1 was increasingly trapped in the aggregates (Fig. 5A). NQO1-Δ50 variants were less susceptible for coaggregation with the amyloid, suggesting that PQC does recognize the same structural features that facilitate protein misfolding (Fig. 5A). NQO2 coaggregation increased less in the absence of cofactor (Fig. S7A), however, the comparison with NQO1 must be done cautiously, because different antibodies were used to detect NQO1 and NQO2.
Fig. 5.
Cofactor depletion exacerbates protein aggregation and amyloidogenesis. (A) Coaggregation of NQO1 and its different variants with Aβ1–42 in vitro (n = 3, mean ± SD). apo, apoprotein; apo-Δ50, C-terminally truncated apoprotein; MUT, P187S mutant; MUT-Δ50, C-terminally truncated P187S mutant; WT-Δ50, C-terminally truncated wild-type NQO1. The amount of wild-type NQO1 that coaggregated with the amyloid (+Aβ) was set as 1. Proteins were detected using anti-NQO1 antibody (NQO1) or anti-amyloid antibody (Aβ). (B) The aggregation of transiently transfected Aβ-EGFP (Aβ) in B16 cells was measured using a sedimentation assay. The ratios of Aβ-EGFP in different fractions were normalized to the ratio of Aβ-EGFP in the lysate before ultracentrifugation and are plotted (n = 3, mean ± SD). The significance of the difference between the means was determined using a one-tailed t test and is indicated. (C) The aggregation of transiently transfected Aβ-EGFP in B16 cells was quantified microscopically. One typical cell with aggregated Aβ-EGFP is shown. (Scale bar: 50 μm.) The fractions of cells containing aggregates under normal and riboflavin-deficient conditions are plotted (n = 3, mean ± SD). The significance of the difference between the means was determined using a one-tailed t test and is indicated.
Fig. S7.
Cofactor depletion exacerbates protein aggregation and amyloidogenesis. (A) Coaggregation of NQO2 (WT) and its apo form (apo) with Aβ1–42 in vitro (n = 3, mean ± SD). The amount of wild-type NQO2 that coaggregated with the amyloid (+Aβ1–42) was set as 1. Proteins were detected using anti-NQO2 antibody (NQO2). (B) B16 cells in medium lacking riboflavin accumulate amyloid as detected with NIAD-4 dye (gray histogram). Cells cultured in normal medium were used as a control (transparent histogram). The average increase in median fluorescence is indicated (n = 3, mean ± SD). The histogram of one representative experiment of three is shown.
We used amyloid-β peptide Aβ1–42 fused to GFP (Aβ-EGFP) to test how riboflavin deficiency affects amyloidogenesis in vivo. Three days after transfection and upon riboflavin starvation, the lysates of the cells were prepared and fractionated into soluble and insoluble fractions. The comparison of starved cells with the cells from the normal conditions indicated that vitamin deficiency enhances aggregation (Fig. 5B). Similarly, when analyzed microscopically, the fraction of aggregate-containing cells was consistently and significantly higher in riboflavin-deficient conditions (Fig. 5C). Interestingly, we observed an increase in amyloid formation in cells upon riboflavin depletion even in the absence of exogenously introduced aggregation-prone protein (Fig. S7B).
Discussion
Metastability of the cellular proteome is a fundamental principle of cell architecture (37). Our study indicates that cofactor-free apoproteins constitute an additional set of potentially unstable proteins. Under cofactor shortage, the accumulation of structurally and functionally immature proteins could overload PQC, resulting in decreased clearance of misfolded polypeptides and increased aggregation. Nutritional deficits often develop in aging organisms due to gastrointestinal atrophy or atherosclerotic damage of the vasculature. Thus, the connection between vitamin supplies and healthy aging receives an additional, protein stability-based explanation with this study.
The cofactor-based wild-type protein stabilization shows structural parallels to pharmacologic chaperone (PC) action on mutant proteins. PCs are small molecules developed to bind specific target proteins so that those proteins can assume their correct and functional 3D structure (38, 39). A whole plethora of PCs has been developed and tested to stabilize mutant proteins underlying broad range of diseases, such as lysosomal storage disorders, cystic fibrosis, and various forms of amyloidosis. The use of high-dose vitamin therapy to treat genetic diseases and polymorphism, pioneered by Bruce Ames (40), underscores the overlapping principles of action between PCs and endogenous enzyme cofactors.
Recent investigations have demonstrated the broad variety of amyloidogenesis (41). One recent exciting example is the fibril-forming but SDS-soluble amyloid from RNA granules (42). It will be important to investigate whether apoproteins can form classical amyloid or instead populate softer conformations and thus contribute only partially to conventional amyloid formation.
Materials and Methods
CD Spectroscopy.
Far-UV CD spectra of proteins were recorded on a Jasco J-810 spectropolarimeter at 37 °C in PBS. Three different repeat scans were obtained for each sample (10 µM) and were subtracted from the buffer (PBS) baseline. Data were collected in a 1-mm path cell (Hellma Analytics) from 250 nm to 200 nm in 0.5-nm steps at 50 nm/min.
Fluorescent Melting Assay.
A fluorescence-based thermal melting assay was performed using a CFX96 Real-Time PCR cycler (Bio-Rad Laboratories). Purified recombinant proteins (10 µM) were mixed with SYPRO Orange dye (Sigma-Aldrich). Fluorescence change was measured while raising the temperature from 20 °C to 80 °C in 0.5-°C/15-s steps (excitation at 450–490 nm, detection at 515–530 nm). The apparent melting temperature values were determined by calculating the first derivative of the fluorescence signal.
ANS Binding.
ANS fluorescence at 20 µM was measured in the presence of 10 µM recombinant proteins at room temperature using Infinite M200 Pro Microplate Reader (Tecan) (excitation at 350 nm, emission scan from 400 nm to 600 nm). The background fluorescence of buffer was subtracted before the spectra were plotted.
In Vitro Ubiquitylation Assay.
In vitro ubiquitylation reactions were carried out in ubiquitylation buffer [50 mM Tris HCl (pH 7.5), 50 mM NaCl, 10 mM MgCl2, 2 mM DTT, and 2 mM ATP] and contained 2.5 µM substrate (NQO1 or NQO2 proteins), 100 nM UBE1 (E1 enzyme; Boston Biochem), 2 µM Ubc5 (E2 enzyme), 5 µM CHIP (E3 enzyme), and 100 mM Ubiquitin from bovine erythrocytes (Sigma-Aldrich). Reactions were incubated at 37 °C for 1 h and then were stopped by the addition of reducing SDS sample buffer and boiling samples at 95 °C for 5 min.
Protease Sensitivity Assay.
Recombinant proteins (30 µM) in PBS were subjected to limited proteolysis at 37 °C by the addition of sequencing-grade trypsin (Promega) to a final concentration of 2 ng/μL. Reactions were incubated for 10, 20, and 40 min and then were stopped by the addition of reducing SDS sample buffer and boiling at 95 °C for 5 min.
Coaggregation in Vitro.
Human amyloid β-peptide (Aβ1–42) (GenScript) at 10 µM was incubated with 5 µM of different recombinant proteins in 100 μL PBS at 37 °C shaking at 300 rpm for 1 h. Wild-type NQO1 was supplemented with 100 µM FAD during this incubation to keep the enzyme fully loaded with the cofactor. Then 100 μL of 100 mM DTT/0.1% SDS/PBS was added for 5 min, and the solution was applied to a cellulose acetate filter (Sartorius Biotech) presoaked in 0.1% SDS/PBS, by using a 96-well Dot Blot Hybridization Manifold (Scie-Plas). Bound aggregates were washed five times using 50 μL 0.1% SDS/PBS. Membrane blocking and protein detection with the corresponding antibodies were performed as described for immunoblotting.
Sedimentation Assay.
B16 cells were transfected with 30 µg Aβ-EGFP expression vector by electroporation at 270 V and 950 µF. After electroporation, cells were washed and incubated in normal medium overnight. Riboflavin deprivation and MG132 5-µM treatments were applied for 24 h. Proteasome inhibitor then was washed out, and riboflavin sufficiency or deficiency was continued for another 48 h (3 d in total). Cells were harvested and lysed in 300 µL lysis buffer [50 mM Tris HCl (pH 7.0), 150 mM NaCl, 2.5 mM MgCl2, and 0.5% Triton X-100]. Lysates were precleared at 21,380 × g for 5 min at 4 °C and then were fractionated into soluble and pellet fractions at 53,227 × g for 30 min at 4 °C.
Microscopy of Cellular Aggregates.
B16 cells (1.5 × 10⁶) were plated on a 10-cm dish. On the next day, they were transfected with 15 µg of Aβ-EGFP expression plasmid using polyethylenimine (PEI) (the ratio DNA:PEI was 1:3 using a 1 mg/mL PEI solution). Six hours later, the cells were trypsinized and replated on 12-well plates at 1.5 × 10⁵ cells per well on poly-l-lysine–coated cover glasses. After 4 h, the cells were washed thoroughly with PBS, and medium was changed to normal or riboflavin-deficient medium with 5 µM MG132. Twenty hours later, the reversible inhibitor was washed out, medium was exchanged several times, and cells were incubated in normal or riboflavin-deficient medium for 2 d. The cells were fixed for 1 h at room temperature with 4% paraformaldehyde/PBS, treated with 1 µg/mL DAPI for 3 min, and washed three times with PBS. The microscopy cover glasses were mounted with PBS, and cells were imaged using a Zeiss LSM 780 confocal microscope. At least 130 EGFP+ cells were counted per condition to determine the fraction of cells with aggregates. The images were analyzed using ImageJ (43).
For additional information see SI Materials and Methods.
SI Materials and Methods
Reagents, Plasmids, and Antibodies.
MG132, 17-AAG, and radicicol were from Enzo Life Sciences; all other chemicals were from Sigma-Aldrich unless otherwise indicated.
3xFLAG-NQO1, 3xFLAG-NQO2, and 3xFLAG-BRAF-V600E eukaryotic expression vectors were constructed by adding two additional FLAG tag sequences (DYKDHDGDYKDHDI) into pFLAG-NQO1 and pFLAG-NQO2 (both from GenScript) and pFLAG-BRAF (Addgene 40775, a gift from Dustin Maly, University of Washington, Seattle) plasmids. P53 and Aβ-EGFP mammalian expression vectors were purchased from GenScript. Site-directed mutagenesis was used to change proline187 into serine in NQO1 and valine600 into glutamate in BRAF. The same method was used to create terminally truncated NQO1 proteins by changing proline224 into a stop codon. The untagged human CHIP for mammalian expression was cloned into pCMV-10 vector (Sigma). His-NQO1 and His-NQO2 bacterial expression plasmids were constructed by cloning human NQO1 and NQO2 sequences fused N-terminally to a 6xHis tag into the vector pPROEX HTa (Invitrogen) between NcoI and NotI restriction sites. The same restriction sites in pPROEX HTa were used to clone human His-UbcH5a for bacterial expression. The pGST-CHIP bacterial expression plasmid was constructed by fusing human CHIP sequence C-terminally to a GST tag into pGEX-6P1 plasmid (GE Healthcare) between BamHI and XhoI restriction sites.
The following antibodies were used: Aβ (clone 6E10, BioLegend 80300; 1:1,000), CHIP (Sigma C9243; 1:1,000), FLAG (Sigma-Aldrich F1804; 1:1,000), GAPDH (Cell Signaling 2118; 1:1,000), GFP (Roche 11814460001; 1:1,000), NQO1 N-terminal (Abgent AJ1554a; 1:1,000), NQO1 C-terminal 12 amino acids SIPTDNQIKARK (Sigma N5288; 1:1,000), NQO2 (Santa Cruz Biotechnology sc-32942; 1:200), p53 (Santa Cruz Biotechnology sc-6243; 1:200), and α-synuclein (Santa Cruz Biotechnology sc-7011-R; 1:1,000).
Cell Culture, Transfection, and Immunoblotting.
The B16-F0 murine melanoma cell line (CRL-6322; ATCC) was cultured in DMEM supplemented with 10% (vol/vol) FBS, 2 mM l-glutamine, 100 IU/mL penicillin G, 100 μg/mL streptomycin sulfate, and nonessential amino acids (Gibco). B16 cells lacking CHIP were engineered using the CRISPR/Cas9 system according to the protocol in ref. 44. pSpCas9n(BB)-2A-GFP (PX461) and pSpCas9n(BB)-2A-Puro (PX462) plasmids were (Addgene 48140 and 48141), a gift from Feng Zhang, Broad Institute, Cambridge, MA.
Riboflavin-deficient medium was prepared omitting riboflavin from the usual DMEM mix. After pH adjustment to 7.5 and filtration, the medium was stored for several weeks at 4 °C. Before use, medium was supplemented with 10% (vol/vol) dialyzed FBS (Thermo Scientific) and 1 µM riboflavin as needed for comparison.
B16 cells were transfected with 15 µg NQO1 or CHIP expression vectors by electroporation in a 400-μL intracellular buffer (135 mM KCl, 0.2 mM CaCl2, 2 mM MgCl2, 5 mM EGTA, 10 mM Hepes, pH 7.5) freshly supplemented with 25% (vol/vol) FBS at 250 V and 950 µF using the Gene Pulser Xcell system (Bio-Rad Laboratories). After electroporation, cells were washed and recovered in normal medium for 4–5 h. Riboflavin deprivation and inhibitors were then applied as needed for 24 h.
For HSP90 inhibition assays, 106 B16 cells were plated on 10-cm dishes and 1 d later were transfected with 10 µg BRAF-V600E and 3 µg EGFP (Clontech) expression plasmids using polyethylenimine (PEI). The ratio of DNA to PEI was 1:3 using a 1 mg/mL PEI solution. Cells were trypsinized 6 h later, replated on 24-well plates in normal or riboflavin-free medium, and grown for 27 h; then 17-AAG and radicicol were added at different concentrations for an additional 14 h.
For immunoblotting, cells were harvested by trypsinization and lysed in lysis buffer [20 mM Hepes (pH 7.5), 0.5% IGEPAL CA-630, 100 mM KCl, 10 mM MgCl2, and 10% glycerol]. After reducing SDS sample buffer was added, lysates were resolved using 10% SDS/PAGE and transferred onto blotting membranes. Membranes were blocked with 5% skim milk solution, probed with the indicated antibodies, and developed using the ECL Prime Western Blotting Detection Reagent (GE Healthcare). Images were acquired with the ChemiDoc MP imaging system and were analyzed using Image Lab 5.0 software (both from Bio-Rad Laboratories). To ensure the linearity of signals, the “Highlight saturated pixels” function was activated.
Recombinant Protein Purification.
Human recombinant his-tagged NQO1 and NQO2 proteins were purified from Escherichia coli BL21 cells by affinity chromatography using 1-mL HisTrap HP columns (GE Healthcare). Eluted fractions containing the respective proteins were subjected to size-exclusion chromatography using a HiLoad Superdex 200 column (GE Healthcare) in PBS.
Cofactor-free proteins were prepared according to the methods in ref. 45 with small modifications. NQO1 and NQO2 proteins bound to the HisTrap column were unfolded using 20 mL denaturation buffer (2 M urea, 2 M KBr, 20 mM imidazole in PBS), allowed to refold in wash buffer (20 mM imidazole in PBS), eluted, and further purified as described above. Flavin content in proteins was measured by releasing the cofactors in a 5-μM protein solution with 0.2% SDS at room temperature for 5 min. Then the fluorescence of 10-fold–diluted samples was measured at room temperature (excitation at 450 nm, emission scan from 480 to 600 nm).
Human CHIP protein was purified from Escherichia coli BL21 cells using Glutathione Sepharose 4B (GE Healthcare). Sepharose-bound GST-CHIP was subjected to overnight treatment with PreScission protease, and the released tag-free protein was collected. Size-exclusion chromatography by means of a HiLoad Superdex 200 column was used to collect CHIP dimers. CHIP was kept in HSP70 buffer [25 mM Hepes KOH (pH 7.5), 150 mM KCl, 5 mM MgCl2, 5% glycerol, 1 mM DTT].
Human his-tagged UbcH5a protein was purified from E. coli BL21 cells using a 1-mL HisTrap column. The protein was eluted by applying an imidazole gradient. The respective fractions were subjected to size-exclusion chromatography using a HiLoad Superdex 200 column in PBS/1 mM DTT.
Analytical Gel Filtration.
One hundred micrograms of purified recombinant proteins (at 30 µM) was injected into a Superdex 200 10/300 GL column (GE Healthcare) pre-equilibrated with PBS and were eluted at 0.5 mL/min at 4 °C. Absorbance values recorded at 280 nm were normalized to the highest absorption value set as 100.
Mass Spectrometry.
Sample preparation.
Cells were lysed in 200 µL of lysis buffer (10% SDS, 150 mM NaCl, 100 mM Hepes, pH 7.6), and DNA was sheared by sonication for 5 s. Cell lysates were cleared by centrifugation (16,000 × g, 3 min). One hundred micrograms of total protein were diluted in 4% (wt/vol) SDS, 100 mM Hepes (pH 7.6), 150 mM NaCl, and 0.1 M DTT and were heated for 5 min at 95 °C. The lysates then were mixed with 200 µL 8 M urea and 50 mM Tris/HCl (pH 8.5) and were loaded onto spin filters with a 30-kDa cut off (Microcon). The filter-aided sample preparation protocol (FASP) was essentially followed (46). Proteins were digested overnight with sequencing-grade trypsin (Promega). According to the methods in ref. 47, acidified peptides (0.1% trifluoroacetic acid final concentration) were desalted with C18 StageTips and fractionated with strong cation exchange (SCX) StageTips. The C18 transelution fraction was combined with the first of six SXC fractions. Peptides were dried and resolved in 1% acetonitrile and 0.1% formic acid.
LC-MS/MS.
LC-MS/MS was performed on a Thermo Scientific Q Exactive Plus system equipped with an ultra-high performance liquid chromatography unit (Thermo Scientific Dionex Ultimate 3000) and a Nanospray Flex Ion Source (Thermo Scientific). Peptides were loaded on a C18 reversed-phase precolumn (Thermo Scientific) and separated on an in-house packed column [100 µm i.d., 30 cm length, 2.4 µm ReproSil C18 resin (Dr. Maisch GmbH)] using a gradient from mobile phase A (4% acetonitrile, 0.1% formic acid) to 30% mobile phase B (80% acetonitrile, 0.1% formic acid) for 60 min followed by a second step to 60% B for 30 min, with a flow rate of 300 nL/min. Mass spectrometry data were recorded in data-dependent mode selecting the 10 most abundant precursor ions for HCD fragmentation. The full mass spectrometry scan range was set to 300–2,000 m/z with a resolution of 70,000. Ions with a charge ≥2 were selected for MS/MS scan with a resolution of 17,500 and an isolation window of 2 m/z. Dynamic exclusion of selected ions was set to 30 s. Data were acquired using the Xcalibur software (Thermo Scientific). The LC unit was controlled by Chromeleon Xpress software.
Data analysis.
Mass spectrometry raw files were analyzed with Max Quant (version 1.5.2.8) (48). The spectra were searched against the UniProtKB mouse FASTA database (downloaded in June 2015; 76,086 entries) for protein identification with a false-discovery rate of 1%. Unidentified features were matched between runs in a time window of 2 min. Hits in three categories (false positives, identified only by site, and known contaminants) were excluded from further analysis. For label-free quantification, the minimum ratio count was set to 1. Bioinformatic data analysis was performed using Perseus 1.5.2.6. (coxdocs.org/doku.php?id=perseus:start). Label-free quantification (LFQ) intensity ratios were calculated to quantify changes in protein upon riboflavin starvation alone and in combination with MG132 treatment. The ratios were log2-transformed, and the mean values of at least three valid ratios per group were calculated. A Mann–Whitney test was performed to estimate the significance of the difference between medians of the flavoproteins and the rest of the quantified proteins. Data were visualized by a box plot with whiskers corresponding to the 5% and 95% quantiles, the box corresponding to the 25% and 75% quantile, and the median line.
Cycloheximide Chase Assay.
HEK293 cells were transfected with 30 µg NQO1 and NQO2 expression vectors by electroporation at 240 V and 950 µF. After electroporation, cells were washed and plated in normal or riboflavin-deficient medium. Four hours later, 1 mM cycloheximide was applied. Cells were harvested at 0 and 4 h upon cycloheximide addition, washed twice in ice-cold PBS, and lysed by adding boiling reducing SDS sample buffer.
Amyloid Detection in Vivo.
B16 cells incubated for 3 d in either normal or riboflavin-deficient medium were harvested and fixed with 4% formaldehyde solution at room temperature for 30 min. Cells were permeabilized with a solution of 0.5% Triton X-100, 3 mM EDTA, pH 8.0, at 4 °C for 30 min and subsequently were incubated in the presence of 10 µM NIAD-4 (49) (Cayman Chemical) at room temperature for 30 min. All solutions were prepared in PBS. Fluorescence intensities of individual cells were measured with an S3 Cell Sorter (Bio-Rad Laboratories). The data were analyzed using FCS Express 5 Flow package (De Novo Software).
Supplementary Material
Acknowledgments
We thank T. Schuster for cloning mammalian CHIP and bacterial His-UbcH5a expression vectors; R. van Haaren for cloning bacterial His-NQO1 and His-NQO2 expression vectors; N. Morgner for discussions; J. Meisterknecht for technical assistance; and J. Heidler for support in sample preparation for mass spectrometry. This work was supported by Cluster of Excellence “Macromolecular Complexes” 115 (W.-H.L., I.W., and R.M.V.), Landesoffensive zur Entwicklung Wissenschaftlich-ökonomischer Exzellenz (LOEWE) Grant Ub-Net (to A.M.-L. and R.M.V.), German Research Foundation Sonderforschungsbereich 815 Grant (to I.W.), and European Research Council Grant 311522-MetaMeta (to M.A., G.C., and R.M.V).
Footnotes
The authors declare no conflict of interest.
This article is a PNAS Direct Submission.
This article contains supporting information online at www.pnas.org/lookup/suppl/doi:10.1073/pnas.1611994113/-/DCSupplemental.
References
- 1.Hartl FU, Bracher A, Hayer-Hartl M. Molecular chaperones in protein folding and proteostasis. Nature. 2011;475(7356):324–332. doi: 10.1038/nature10317. [DOI] [PubMed] [Google Scholar]
- 2.Amm I, Sommer T, Wolf DH. Protein quality control and elimination of protein waste: The role of the ubiquitin-proteasome system. Biochim Biophys Acta. 2014;1843(1):182–196. doi: 10.1016/j.bbamcr.2013.06.031. [DOI] [PubMed] [Google Scholar]
- 3.Bento CF, et al. Mammalian autophagy: How does it work? Annu Rev Biochem. 2016;85:685–713. doi: 10.1146/annurev-biochem-060815-014556. [DOI] [PubMed] [Google Scholar]
- 4.Chiti F, Dobson CM. Protein misfolding, functional amyloid, and human disease. Annu Rev Biochem. 2006;75:333–366. doi: 10.1146/annurev.biochem.75.101304.123901. [DOI] [PubMed] [Google Scholar]
- 5.Powers ET, Morimoto RI, Dillin A, Kelly JW, Balch WE. Biological and chemical approaches to diseases of proteostasis deficiency. Annu Rev Biochem. 2009;78:959–991. doi: 10.1146/annurev.biochem.052308.114844. [DOI] [PubMed] [Google Scholar]
- 6.Hipp MS, Park S-H, Hartl FU. Proteostasis impairment in protein-misfolding and -aggregation diseases. Trends Cell Biol. 2014;24(9):506–514. doi: 10.1016/j.tcb.2014.05.003. [DOI] [PubMed] [Google Scholar]
- 7.Wolff S, Weissman JS, Dillin A. Differential scales of protein quality control. Cell. 2014;157(1):52–64. doi: 10.1016/j.cell.2014.03.007. [DOI] [PubMed] [Google Scholar]
- 8.Labbadia J, Morimoto RI. The biology of proteostasis in aging and disease. Annu Rev Biochem. 2015;84:435–464. doi: 10.1146/annurev-biochem-060614-033955. [DOI] [PMC free article] [PubMed] [Google Scholar]
- 9.Shao S, Hegde RS. Target selection during protein quality control. Trends Biochem Sci. 2016;41(2):124–137. doi: 10.1016/j.tibs.2015.10.007. [DOI] [PubMed] [Google Scholar]
- 10.Lienhart W-D, Gudipati V, Macheroux P. The human flavoproteome. Arch Biochem Biophys. 2013;535(2):150–162. doi: 10.1016/j.abb.2013.02.015. [DOI] [PMC free article] [PubMed] [Google Scholar]
- 11.Nagao M, Tanaka K. FAD-dependent regulation of transcription, translation, post-translational processing, and post-processing stability of various mitochondrial acyl-CoA dehydrogenases and of electron transfer flavoprotein and the site of holoenzyme formation. J Biol Chem. 1992;267(25):17925–17932. [PubMed] [Google Scholar]
- 12.Moscovitz O, et al. A mutually inhibitory feedback loop between the 20S proteasome and its regulator, NQO1. Mol Cell. 2012;47(1):76–86. doi: 10.1016/j.molcel.2012.05.049. [DOI] [PubMed] [Google Scholar]
- 13.Husain M, Massey V. Reversible resolution of flavoproteins into apoproteins and fee flavins. Methods Enzymol. 1978;53:429–437. doi: 10.1016/s0076-6879(78)53047-4. [DOI] [PubMed] [Google Scholar]
- 14.Manthey KC, Rodriguez-Melendez R, Hoi JT, Zempleni J. Riboflavin deficiency causes protein and DNA damage in HepG2 cells, triggering arrest in G1 phase of the cell cycle. J Nutr Biochem. 2006;17(4):250–256. doi: 10.1016/j.jnutbio.2005.05.004. [DOI] [PMC free article] [PubMed] [Google Scholar]
- 15.Kelland LR, Sharp SY, Rogers PM, Myers TG, Workman P. DT-Diaphorase expression and tumor cell sensitivity to 17-allylamino, 17-demethoxygeldanamycin, an inhibitor of heat shock protein 90. J Natl Cancer Inst. 1999;91(22):1940–1949. doi: 10.1093/jnci/91.22.1940. [DOI] [PubMed] [Google Scholar]
- 16.Travers J, Sharp S, Workman P. HSP90 inhibition: Two-pronged exploitation of cancer dependencies. Drug Discov Today. 2012;17(5-6):242–252. doi: 10.1016/j.drudis.2011.12.021. [DOI] [PubMed] [Google Scholar]
- 17.da Rocha Dias S, et al. Activated B-RAF is an Hsp90 client protein that is targeted by the anticancer drug 17-allylamino-17-demethoxygeldanamycin. Cancer Res. 2005;65(23):10686–10691. doi: 10.1158/0008-5472.CAN-05-2632. [DOI] [PubMed] [Google Scholar]
- 18.Taldone T, Sun W, Chiosis G. Discovery and development of heat shock protein 90 inhibitors. Bioorg Med Chem. 2009;17(6):2225–2235. doi: 10.1016/j.bmc.2008.10.087. [DOI] [PMC free article] [PubMed] [Google Scholar]
- 19.Lajin B, Alachkar A. The NQO1 polymorphism C609T (Pro187Ser) and cancer susceptibility: A comprehensive meta-analysis. Br J Cancer. 2013;109(5):1325–1337. doi: 10.1038/bjc.2013.357. [DOI] [PMC free article] [PubMed] [Google Scholar]
- 20.Siegel D, et al. Rapid polyubiquitination and proteasomal degradation of a mutant form of NAD(P)H:quinone oxidoreductase 1. Mol Pharmacol. 2001;59(2):263–268. doi: 10.1124/mol.59.2.263. [DOI] [PubMed] [Google Scholar]
- 21.Tsvetkov P, Adamovich Y, Elliott E, Shaul Y. E3 ligase STUB1/ChIP regulates NAD(P)H:quinone oxidoreductase 1 (NQO1) accumulation in aged brain, a process impaired in certain Alzheimer disease patients. J Biol Chem. 2011;286(11):8839–8845. doi: 10.1074/jbc.M110.193276. [DOI] [PMC free article] [PubMed] [Google Scholar]
- 22.Lienhart W-D, et al. Collapse of the native structure caused by a single amino acid exchange in human NAD(P)H:quinone oxidoreductase(1.) FEBS J. 2014;281(20):4691–4704. doi: 10.1111/febs.12975. [DOI] [PMC free article] [PubMed] [Google Scholar]
- 23.Pey AL, Megarity CF, Timson DJ. FAD binding overcomes defects in activity and stability displayed by cancer-associated variants of human NQO1. Biochim Biophys Acta. 2014;1842(11):2163–2173. doi: 10.1016/j.bbadis.2014.08.011. [DOI] [PubMed] [Google Scholar]
- 24.Stryer L. The interaction of a naphthalene dye with apomyoglobin and apohemoglobin. A fluorescent probe of non-polar binding sites. J Mol Biol. 1965;13(2):482–495. doi: 10.1016/s0022-2836(65)80111-5. [DOI] [PubMed] [Google Scholar]
- 25.Rosén C. Binding of fluorescent probe, 1-anilino-8-naphthalene sulfonate, to apo-horseradish peroxidase. FEBS Lett. 1970;6(3):158–160. doi: 10.1016/0014-5793(70)80046-1. [DOI] [PubMed] [Google Scholar]
- 26.Hühner J, Ingles-Prieto Á, Neusüß C, Lämmerhofer M, Janovjak H. Quantification of riboflavin, flavin mononucleotide, and flavin adenine dinucleotide in mammalian model cells by CE with LED-induced fluorescence detection. Electrophoresis. 2015;36(4):518–525. doi: 10.1002/elps.201400451. [DOI] [PubMed] [Google Scholar]
- 27.Giancaspero TA, et al. Remaining challenges in cellular flavin cofactor homeostasis and flavoprotein biogenesis. Front Chem. 2015;3:30. doi: 10.3389/fchem.2015.00030. [DOI] [PMC free article] [PubMed] [Google Scholar]
- 28.Zheng C, Zhao Z, Li Y, Wang L, Su Z. Effect of IPTG amount on apo- and holo- forms of glycerophosphate oxidase expressed in Escherichia coli. Protein Expr Purif. 2011;75(2):133–137. doi: 10.1016/j.pep.2010.08.009. [DOI] [PubMed] [Google Scholar]
- 29.Encarnación M-C, et al. Conformational dynamics is key to understanding loss-of-function of NQO1 cancer-associated polymorphisms and its correction by pharmacological ligands. Sci Rep. 2016;6:20331. doi: 10.1038/srep20331. [DOI] [PMC free article] [PubMed] [Google Scholar]
- 30.Zhang M, et al. Chaperoned ubiquitylation--crystal structures of the ChIP U box E3 ubiquitin ligase and a ChIP-Ubc13-Uev1a complex. Mol Cell. 2005;20(4):525–538. doi: 10.1016/j.molcel.2005.09.023. [DOI] [PubMed] [Google Scholar]
- 31.Wang L, et al. Molecular mechanism of the negative regulation of Smad1/5 protein by carboxyl terminus of Hsc70-interacting protein (ChIP) J Biol Chem. 2011;286(18):15883–15894. doi: 10.1074/jbc.M110.201814. [DOI] [PMC free article] [PubMed] [Google Scholar]
- 32.Asher G, Dym O, Tsvetkov P, Adler J, Shaul Y. The crystal structure of NAD(P)H quinone oxidoreductase 1 in complex with its potent inhibitor dicoumarol. Biochemistry. 2006;45(20):6372–6378. doi: 10.1021/bi0600087. [DOI] [PubMed] [Google Scholar]
- 33.Chen S, Wu K, Knox R. Structure-function studies of DT-diaphorase (NQO1) and NRH: Quinone oxidoreductase (NQO2) Free Radic Biol Med. 2000;29(3-4):276–284. doi: 10.1016/s0891-5849(00)00308-7. [DOI] [PubMed] [Google Scholar]
- 34.Gidalevitz T, Ben-Zvi A, Ho KH, Brignull HR, Morimoto RI. Progressive disruption of cellular protein folding in models of polyglutamine diseases. Science. 2006;311(5766):1471–1474. doi: 10.1126/science.1124514. [DOI] [PubMed] [Google Scholar]
- 35.Olzscha H, et al. Amyloid-like aggregates sequester numerous metastable proteins with essential cellular functions. Cell. 2011;144(1):67–78. doi: 10.1016/j.cell.2010.11.050. [DOI] [PubMed] [Google Scholar]
- 36.Goedert M. Neurodegeneration. Alzheimer’s and Parkinson’s diseases: The prion concept in relation to assembled Aβ, tau, and α-synuclein. Science. 2015;349(6248):1255555. doi: 10.1126/science.1255555. [DOI] [PubMed] [Google Scholar]
- 37.Vendruscolo M. Proteome folding and aggregation. Curr Opin Struct Biol. 2012;22(2):138–143. doi: 10.1016/j.sbi.2012.01.005. [DOI] [PubMed] [Google Scholar]
- 38.Cohen FE, Kelly JW. Therapeutic approaches to protein-misfolding diseases. Nature. 2003;426(6968):905–909. doi: 10.1038/nature02265. [DOI] [PubMed] [Google Scholar]
- 39.Convertino M, Das J, Dokholyan NV. Pharmacological chaperones: Design and development of new therapeutic strategies for the treatment of conformational diseases. ACS Chem Biol. 2016;11(6):1471–1489. doi: 10.1021/acschembio.6b00195. [DOI] [PubMed] [Google Scholar]
- 40.Ames BN, Elson-Schwab I, Silver EA. High-dose vitamin therapy stimulates variant enzymes with decreased coenzyme binding affinity (increased K(m)): Relevance to genetic disease and polymorphisms. Am J Clin Nutr. 2002;75(4):616–658. doi: 10.1093/ajcn/75.4.616. [DOI] [PubMed] [Google Scholar]
- 41.Aguzzi A, Altmeyer M. Phase separation: Linking cellular compartmentalization to disease. Trends Cell Biol. 2016;26(7):547–558. doi: 10.1016/j.tcb.2016.03.004. [DOI] [PubMed] [Google Scholar]
- 42.Kato M, et al. Cell-free formation of RNA granules: Low complexity sequence domains form dynamic fibers within hydrogels. Cell. 2012;149(4):753–767. doi: 10.1016/j.cell.2012.04.017. [DOI] [PMC free article] [PubMed] [Google Scholar]
- 43.Schneider CA, Rasband WS, Eliceiri KW. NIH Image to ImageJ: 25 years of image analysis. Nat Methods. 2012;9(7):671–675. doi: 10.1038/nmeth.2089. [DOI] [PMC free article] [PubMed] [Google Scholar]
- 44.Ran FA, et al. Genome engineering using the CRISPR-Cas9 system. Nat Protoc. 2013;8(11):2281–2308. doi: 10.1038/nprot.2013.143. [DOI] [PMC free article] [PubMed] [Google Scholar]
- 45.Hefti MH, Milder FJ, Boeren S, Vervoort J, van Berkel WJH. A His-tag based immobilization method for the preparation and reconstitution of apoflavoproteins. Biochim Biophys Acta. 2003;1619(2):139–143. doi: 10.1016/s0304-4165(02)00474-9. [DOI] [PubMed] [Google Scholar]
- 46.Wiśniewski JR, Zougman A, Nagaraj N, Mann M. Universal sample preparation method for proteome analysis. Nat Methods. 2009;6(5):359–362. doi: 10.1038/nmeth.1322. [DOI] [PubMed] [Google Scholar]
- 47.Kulak NA, Pichler G, Paron I, Nagaraj N, Mann M. Minimal, encapsulated proteomic-sample processing applied to copy-number estimation in eukaryotic cells. Nat Methods. 2014;11(3):319–324. doi: 10.1038/nmeth.2834. [DOI] [PubMed] [Google Scholar]
- 48.Cox J, Mann M. MaxQuant enables high peptide identification rates, individualized p.p.b.-range mass accuracies and proteome-wide protein quantification. Nat Biotechnol. 2008;26(12):1367–1372. doi: 10.1038/nbt.1511. [DOI] [PubMed] [Google Scholar]
- 49.Nesterov EE, et al. In vivo optical imaging of amyloid aggregates in brain: Design of fluorescent markers. Angew Chem Int Ed Engl. 2005;44(34):5452–5456. doi: 10.1002/anie.200500845. [DOI] [PubMed] [Google Scholar]
Associated Data
This section collects any data citations, data availability statements, or supplementary materials included in this article.


