Significance
One of the mechanisms of endocrine resistance in estrogen receptor α (ER)-positive (+) breast cancer is the cross-talk between the ER and growth factor receptor pathways leading to altered ER activity and a reprogrammed ER-dependent transcriptome. However, key mediators of this ER-dependent transcriptional reprogramming remain elusive. Here we demonstrate that forkhead box protein A1 (FOXA1) up-regulation via gene amplification or overexpression contributes to endocrine resistance and increased invasiveness phenotypes by altering the ER-dependent transcriptome. We further show that IL-8, one of the top altered FOXA1/ER effectors, plays a key role in mediating these phenotypes and is a potential target to treat ER+/FOXA1-high breast cancer. Our findings provoke a new interplay of FOXA1 in the ER transcriptional program in endocrine-resistant breast cancer.
Keywords: FOXA1, estrogen receptor, breast cancer, transcriptional reprogramming, endocrine resistance
Abstract
Forkhead box protein A1 (FOXA1) is a pioneer factor of estrogen receptor α (ER)–chromatin binding and function, yet its aberration in endocrine-resistant (Endo-R) breast cancer is unknown. Here, we report preclinical evidence for a role of FOXA1 in Endo-R breast cancer as well as evidence for its clinical significance. FOXA1 is gene-amplified and/or overexpressed in Endo-R derivatives of several breast cancer cell line models. Induced FOXA1 triggers oncogenic gene signatures and proteomic profiles highly associated with endocrine resistance. Integrated omics data reveal IL8 as one of the most perturbed genes regulated by FOXA1 and ER transcriptional reprogramming in Endo-R cells. IL-8 knockdown inhibits tamoxifen-resistant cell growth and invasion and partially attenuates the effect of overexpressed FOXA1. Our study highlights a role of FOXA1 via IL-8 signaling as a potential therapeutic target in FOXA1-overexpressing ER-positive tumors.
About 75% of breast cancers express estrogen receptor α (ER), which is a strong driver and therapeutic target for these ER-positive (+) tumors. Endocrine therapy with aromatase inhibitors lowers the level of estrogen; selective ER modulators such as tamoxifen (Tam) bind to and block ER, and down-regulators such as fulvestrant (Ful) bind to ER and induce its degradation. Endocrine therapy prolongs disease-free and overall survival when used in the adjuvant setting and can induce long-term remission in some patients in the metastatic setting. Despite the overall success of endocrine therapy, tumors in more than 50% of patients with metastatic disease fail to respond, and nearly all metastatic patients with initially responding tumors eventually experience tumor relapse and die from acquired resistance (1, 2). Although there are many causes for resistance, the most predominant mechanisms include altered ER signaling and interactions between ER, its coregulators, and various growth factor pathways. These alterations facilitate adaptation from ligand-dependent to ligand-independent ER activation, which is further triggered by cross-talk with growth factor receptor (GFR) signaling pathways (3–6). However, the key mediators of ER transcriptional reprogramming in promoting endocrine-resistant (Endo-R) breast cancer remain poorly understood.
Recently, a potential role of the forkhead box protein A1 (FOXA1) has been suggested in mediating endocrine resistance in breast cancer (7, 8). FOXA1 is termed a “pioneer factor” because it binds to highly compacted or “closed” chromatin via a domain similar to that of linker histones and, through its C-terminal domain, renders these genomic regions more accessible to other transcription factors, such as ER (9), progesterone receptor (PR) (10), and androgen receptor (AR) (11). As such, FOXA1 has a key role in demarcating the tissue-specific binding sites of these nuclear receptors (12). Together with ER, FOXA1 contributes to the pattern of gene transcription that induces luminal cell differentiation (13) and represses the basal phenotype (14). Like ER, FOXA1 is associated with luminal subtype and good prognosis in breast cancer (15, 16). However, FOXA1 and ER have also been found to be coexpressed at high levels in breast cancer metastases that are resistant to endocrine therapy (8), suggesting a continuing and potentially altered role of FOXA1 in ER+ metastatic and/or resistant disease. A recent study in endometrial cancer found increasing levels of FOXA1 in metastases, even though high levels of FOXA1 in primary tumors were associated with good outcome (17). At the molecular level, genome-wide mapping of cis-regulatory elements (cistromes) has shown that the FOXA1-binding motif is enriched in a distinct ER cistrome identified in ER+ primary tumors from patients who are likely to relapse, suggesting a functional link of FOXA1 with aggressive ER+ disease (8). These contradictory findings of the significance of FOXA1 in early and late tumor stages suggest a potentially dynamic perturbation of FOXA1 in disease progression. However, it remains unclear how FOXA1 is engaged in the ER transcriptional reprogramming in Endo-R breast cancer, and whether there is any aberration of FOXA1 that contributes to this process.
The aim of this study was to evaluate the role of FOXA1 in mediating endocrine resistance in ER+ breast cancer using a panel of Endo-R breast cancer cell line models, publicly deposited preclinical and clinical datasets, and functional studies. Our hypothesis was that increased expression of FOXA1 in breast tumors might contribute to endocrine resistance and tumor progression. We found that FOXA1 expression was increased in several different ER+ Endo-R derivative cell lines compared with their ER+ parental (P) cells. Induced overexpression of FOXA1 in the P cells elicited gene signatures and proteomic profiles associated with multiple oncogenic pathways as well as endocrine resistance. High levels of FOXA1 mRNA predicted poor outcome in patients with ER+ tumors receiving Tam. Integrative analysis of cistromic and RNA sequencing (seq) data suggested that IL-8 serves as an important mediator of the FOXA1/ER transcriptional reprogramming to promote Endo-R cell growth and invasion. We propose that targeting IL-8 signaling is a promising strategy to treat ER+ tumors with high levels of FOXA1.
Results
FOXA1 Gene Amplification Is Associated with Tam Resistance in ER+ Breast Cancer Preclinical Models.
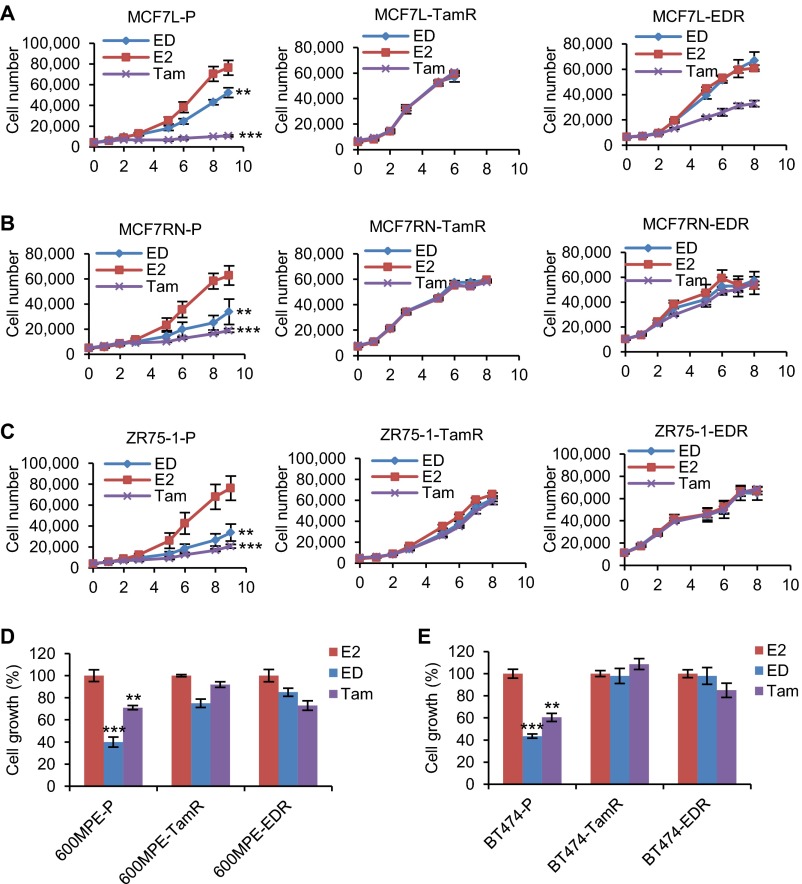
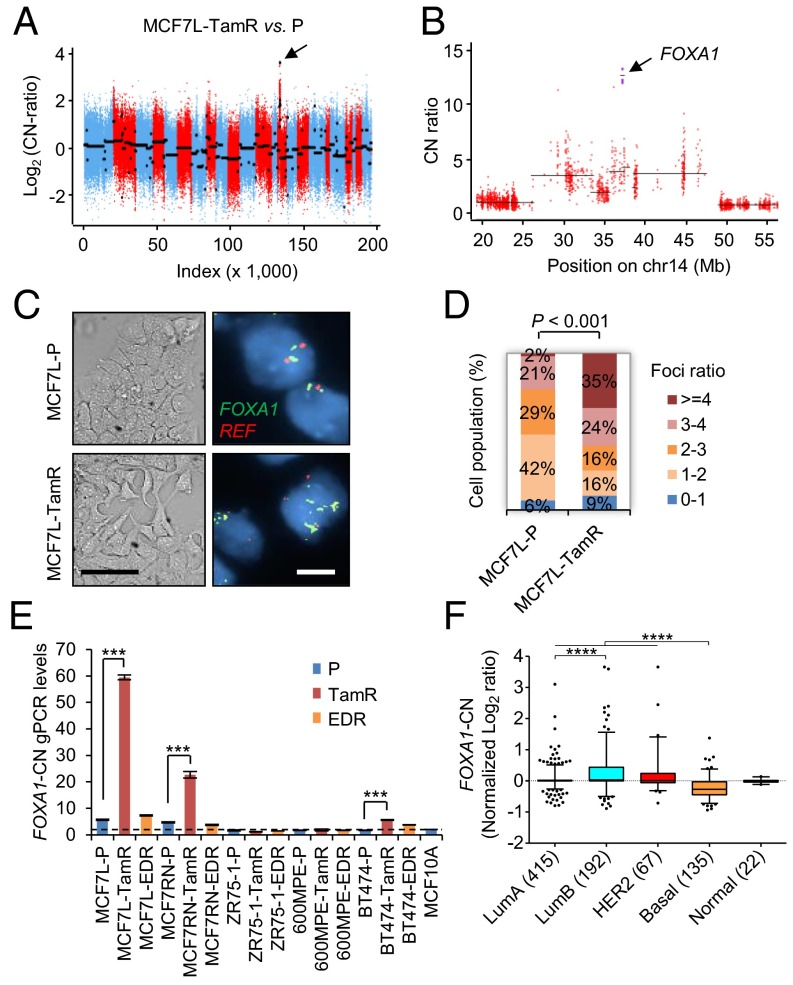
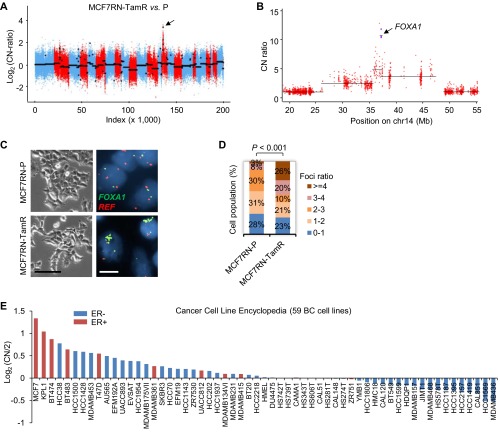
Five established Endo-R cell models showed a stable phenotype of sustained cell growth in the presence of estrogen deprivation (ED) or Tam (Fig. S1). Two MCF7 Endo-R cell models were independently developed from the ER+ breast cancer MCF7- L (18) and RN (19) lines. Using whole-exome-seq, we found that the genomic region (14q21.1) encompassing only the FOXA1 gene had the highest focal amplification ratio in Tam-resistant (TamR) derivatives compared with P cells in both MCF7-L and RN models [log2 copy number (CN) ratio of 3.7 and 3.4 in Fig. 1 A and B and Fig. S2 A and B, respectively]. This FOXA1 gene amplification was found only in the MCF7-L/RN TamR but not the ED-resistant (EDR) derivative. Furthermore, at a single cell level there was a highly enriched cell population with FOXA1 amplification (FOXA1 vs. reference foci ratio ≥4) revealed by FISH in the MCF7-L/RN TamR compared with P cells (Fig. 1 C and D and Fig. S2 C and D). Even in the MCF7-L/RN P cells, we found a mixed cell population with over 50% of cells showing a ratio >2, suggesting some level of FOXA1 CN gain (CNG) preexisting in the P cells before developing endocrine resistance. FOXA1 gene amplification was also validated using a genomic PCR (gPCR) assay (Fig. 1E). The FOXA1-CN in MCF7-L/RN P cells was higher than that in the normal mammary epithelial MCF10A cells. In fact, MCF7 cells had the highest FOXA1-CN among a panel of 59 breast cancer cell lines [data from the Cancer Cell Line Encyclopedia (20)] (Fig. S2E). Two other cell lines, KPL1 and BT474, also showed high FOXA1-CN. In our gPCR assay, we also observed a relatively modest but significant FOXA1-CN increase in TamR but not EDR derivatives of the BT474 model. FOXA1 amplification was not found in two other ER+ Endo-R models (ZR75-1 and 600MPE).
Fig. S1.
Cell growth of multiple Endo-R cell models. (A–E) Prestarved cells cultured with PRF medium and 5% CS-FBS were treated with E2 (control), ED, or Tam for indicated days. Cell numbers were either counted by an in situ cytometer (Celigo) or quantified with a colorimetric assay. **P < 0.01, ***P < 0.001, unpaired two-sided t test for all of the comparisons between E2-treated and antiestrogen-treated cells.
Fig. 1.
FOXA1 gene amplification in preclinical ER+ Endo-R cell models. (A) Overall CN across the genome for MCF7L-TamR related to P cells. Log2(CN ratio) is shown on the vertical axis. Each point represents the log-transformed CN ratio for each targeted exon, ordered by genomic coordinates and colored by chromosome using red and blue for subsequent chromosomes. Black lines show inferred segments. The arrows point to the segment with the highest focal amplification exons. (B) Zoom into the 60-Mb region containing FOXA1 in A. CN ratios for the four FOXA1-targeted exons are shown as purple squares, and the remaining targeted exons are red circles. The segment containing FOXA1 contains just the four targeted exons corresponding to FOXA1. (C) Representative images of bright-field and the FOXA1-FISH of MCF7L-P and TamR cells show the enrichment of gene amplification in MCF7L-TamR vs. P cells. Green and red signals indicate the locations where FOXA1 and chromosome 14 centromere reference (REF) probes were hybridized, respectively. [Scale bar, 100 μm (bright field) and 20 μm (FISH).] (D) Stacked bar chart summarizes the percentage of cells (n = 65) with FOXA1/REF foci ratio within indicated ranges. (E) Normalized FOXA1-CN values from multiple Endo-R cells were calculated from the results of a real-time gPCR assay. The normal diploid MCF10A cell line was used as the normalization control (CN = 2, marked by a dashed line). (F) Box-whisker plots show the FOXA1-CN across the five molecular subtypes of breast cancer (n = 831) in the TCGA dataset (24).
Fig. S2.
FOXA1 amplification and CN in breast cancer cell lines. (A) Overall CN across the genome for MCF7RN-TamR related to P cells. Log2(CN ratio) is shown on the vertical axis. Each point represents the log-transformed CN ratio for each targeted exon, ordered by genomic coordinates and colored by chromosome using red and blue for subsequent chromosomes. Black lines show inferred segments. The arrows point to the segment with the highest focal amplification exons. (B) Zoom into the 60-Mb region containing FOXA1 in A. CN ratios for the four FOXA1-targeted exons are shown as purple squares, and the remaining targeted exons are red circles. The segment containing FOXA1 contains just the four targeted exons corresponding to FOXA1. (C) Representative images of bright field and FOXA1-FISH in MCF7RN-P and TamR cells. [Scale bar, 100 μm (bright field) and 20 μm (FISH)]. (D) Stacked bar chart summarizes the percentage of cells (n = 65) with FOXA1/REF foci ratio within indicated ranges. (E) Normalized FOXA1-CN [log2(CN/2)] across a panel of breast cancer cell lines (n = 59) from the Cancer Cell Line Encyclopedia (20). Base line (y axis at 0) indicates the CN of 2. ER+ cell lines are in red.
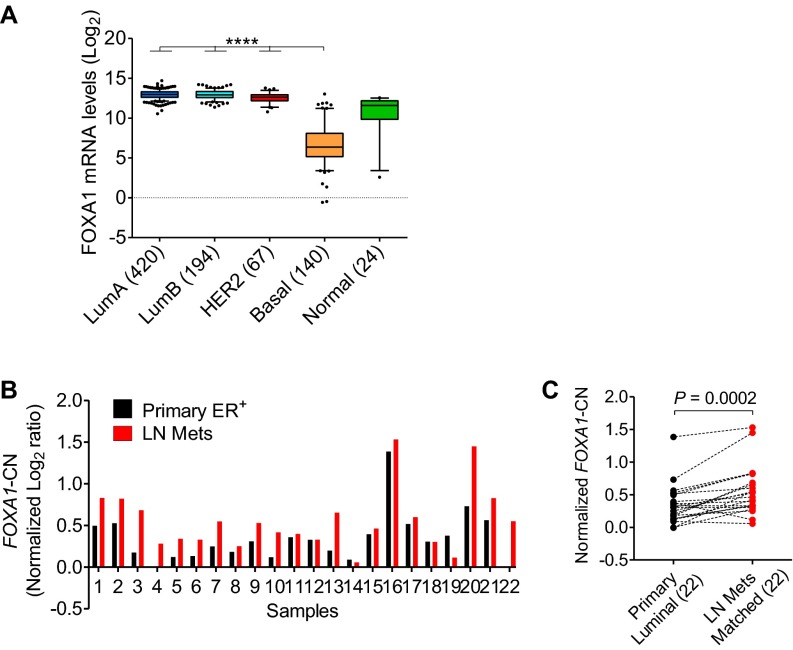
Amplification of the genomic region encompassing the FOXA1 gene has been reported in primary and metastatic tumors of esophagus, lung, thyroid, and prostate (21–23). We analyzed the updated Cancer Genome Atlas (TCGA) breast cancer dataset (n = 1,105) for CN changes (24, 25). Although FOXA1 gene amplification was found only in 2% of all cases, 20% of tumors had FOXA1-CN alterations including both CNG and amplification. The FOXA1-CN was higher in luminal and human epidermal growth factor receptor 2 (HER2)-enriched subtypes than in the basal subtype (Fig. 1F), which correlates with the expression pattern of FOXA1 mRNA across the subtypes (Fig. S3A). There were more tumors in the luminal B (42%) with FOXA1-CNG and amplification than in the luminal A (14%) subtype, suggesting an association of increased FOXA1-CN with poor clinical outcome. In partial support of this, we found that FOXA1-CN was significantly higher in lymph-node metastases compared with the matched primary ER+ luminal tumors (n = 22) in a Gene Expression Omnibus (GEO) dataset (accession no. GSE56765) (26) (Fig. S3 B and C). Altogether, our preclinical data and the clinical evidence support a hypothesis that high levels of FOXA1-CN in aggressive luminal tumors favor the outgrowth of Endo-R tumors through a subclonal selection or enrichment in response to endocrine therapy.
Fig. S3.
FOXA1 mRNA and CN values in breast tumors. (A) Box-whisker plots show the FOXA1 mRNA levels (log2) across the five molecular subtypes of breast cancer (n = 845) in the TCGA dataset (24). ****P < 0.0001, Bonferroni post hoc test (multiple testing corrected). (B) FOXA1-CN was derived from a study of whole-genome array-based comparative genomic hybridization (GEO accession no. GSE56765) (26). (C) FOXA1-CN was compared between primary breast luminal tumors (n = 22) and their matched lymph-node metastases (from B), using the two-tailed paired t test.
FOXA1 Is Overexpressed in Endo-R Derivatives and Is Essential for Both P and Endo-R Cell Growth in Multiple Preclinical Cell Models.
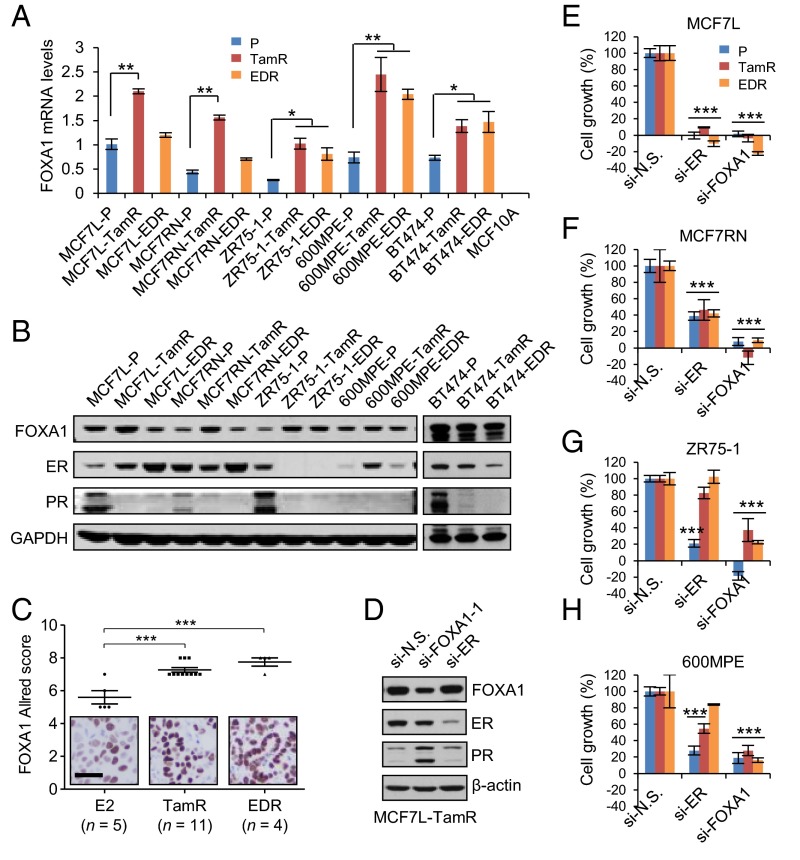
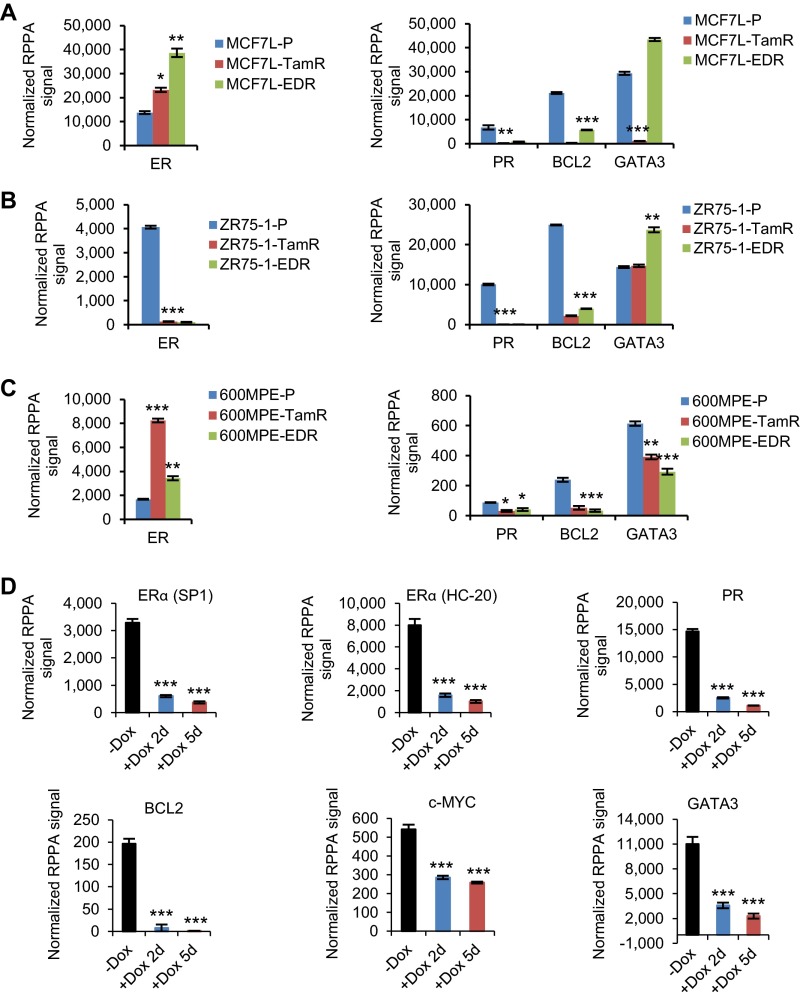
Although FOXA1 amplification/CNG was seen only in MCF7-L/RN and BT474 TamR derivatives, FOXA1 mRNA levels were higher in the TamR derivatives than in the P cells of all five models (MCF7-L/RN, BT474, ZR75-1, and 600MPE) measured by quantitative reverse-transcription (qRT)-PCR (Fig. 2A). Similarly, increased FOXA1 mRNA was also observed in the EDR derivatives of ZR75-1, 600MPE, and BT474 models. Increased FOXA1 protein levels measured by Western blot were observed in the Endo-R derivatives compared with their P cells in all five models (Fig. 2B). ER protein was retained in all but one of the Endo-R cell lines compared with P cells; the ZR75-1 Endo-R model had no detectable ER. Protein levels of classical ER-regulated genes such as PGR and BCL2, as well as GATA3 (encoding GATA-binding protein 3), which also regulates ER expression (27), were down-regulated in most of these Endo-R derivatives compared with P cells (Fig. 2B and Fig. S4 A–C), suggesting a continuous blockade of the classical ER transcriptional program that is also seen in our previously reported Endo-R xenograft mouse model (5). Importantly, high FOXA1 protein levels were also observed by immunohistochemistry (IHC) in acquired Endo-R MCF7L xenograft tumors in vivo compared with estrogen-treated controls (Fig. 2C).
Fig. 2.
Increased FOXA1 expression in multiple Endo-R cell models. (A) FOXA1 mRNA levels determined by qRT-PCR across various Endo-R cell models. The amount of FOXA1 mRNA from MCF7L-P cells was set as normalization control (= 1). (B) FOXA1, ER, and PR protein expression using selected antibodies in Western blot analysis across various Endo-R cell models. GAPDH was used as a loading control. (C) Scatter dot plots of FOXA1 Allred score in MCF7L Endo-R xenograft tumors measured by IHC. Xenograft tumors in ovariectomized nude mice with estrogen pellets (E2), or without E2 but treated with Tam or without Tam (ED), were harvested when the tumor volume reached 1,000 mm3. Data are represented as mean ± SEM (n > 5 in each group). ***P < 0.001, Bonferroni post hoc test (multiple testing-corrected). (D) Western blots showing the protein levels of FOXA1 and ER in MCF7L-TamR cells with gene knockdown. (E–H) Cell growth within a 6-d period after siRNA knockdown of nonspecific (N.S.) target, ER, or FOXA1 in MCF7L, MCF7RN, ZR75-1, and 600MPE Endo-R cell models. Cell growth in N.S. knockdown was used as normalization control (100%). Data represent means ± SEM, *P < 0.05, **P < 0.01, ***P < 0.001, two-sided t test for all comparisons between N.S. and ER/FOXA1 knockdown.
Fig. S4.
Protein expression of ER and its classical regulated genes. (A–C) Bar charts show the protein levels measured by RPPA assays using cell lysates from three Endo-R cell models. (D) Bar charts show the protein levels in MCF7L/FOXA1 cells ± Dox for 2 or 5 d. Protein levels were presented as means ± SEM from biologically triplicated samples with triplicated loading dots in the array (n = 9). *P < 0.05, **P < 0.01, ***P < 0.001, unpaired two-sided t test to compare the expression between P and Endo-R cells, and between +Dox and −Dox cells.
To determine the role of ER and FOXA1 in endocrine resistance, we evaluated cell growth of various P and Endo-R derivatives in response to two validated siRNAs targeting ER and FOXA1 (Fig. 2D). Knocking down ER in the MCF7-L/RN models significantly inhibited both P and Endo-R cell growth (Fig. 2 E and F). Both ZR75-1-P and 600MPE-P cells were also sensitive to ER knockdown; however, cell growth was affected to a lesser extent by ER knockdown in their Endo-R derivatives (Fig. 2 G and H). However, FOXA1 knockdown substantially inhibited the growth of P and Endo-R derivatives of all preclinical models, suggesting an important role of FOXA1 on breast cancer cell growth even in the setting of endocrine resistance and even in resistant cells that are not affected by ER knockdown.
FOXA1 Overexpression Elicits an Endo-R Gene Signature and Predicts Poor Outcome in Patients with ER+ Tumors.
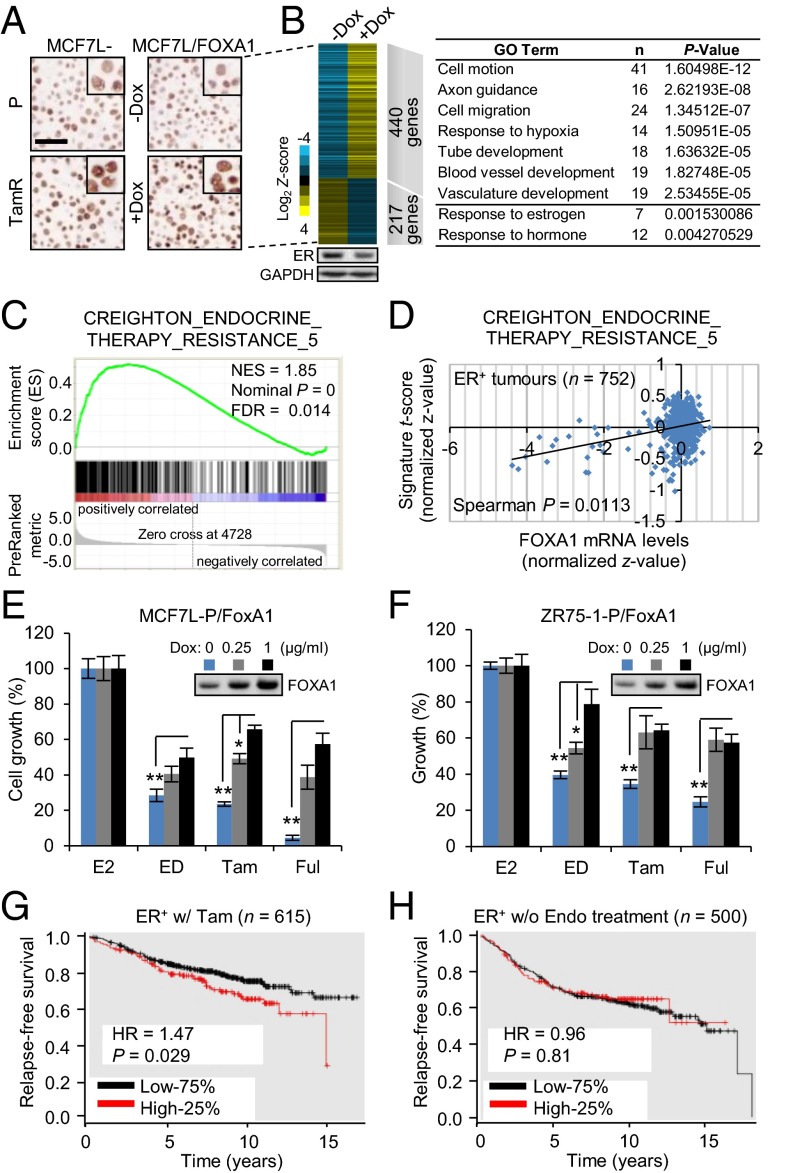
To better understand the role of increased FOXA1 in Endo-R cells, we established a stable MCF7L/FOXA1 cell model with doxycycline (Dox)-inducible FOXA1 overexpression. The extent of FOXA1 overexpression in the MCF7L/FOXA1 cells after Dox induction vs. without Dox was comparable to that observed in the MCF7L-TamR vs. P cells (Fig. 3A). RNA-seq analysis revealed a total of 440 genes up-regulated and 217 genes down-regulated [|Gfold| (28) >1.5, false discovery rate (FDR) <0.05] in +Dox vs. −Dox cells (Fig. 3B). Functional annotation of these up-regulated genes in the Database for Annotation, Visualization and Integrated Discovery (DAVID) (29) showed a robust enrichment of Gene Ontology (GO) terms that included “cell motion and migration,” “response to hypoxia,” and “blood vessel development” (P < 0.001). Interestingly, within the down-regulated genes, the most enriched GO term was “response to estrogen” (P = 0.0015), suggesting a reduction of ligand-dependent classic ER transcriptional activity in this model, which could be partially due to the modest decrease of ER expression itself (Fig. 3B, Lower). We further used Gene Set Enrichment Analysis (GSEA) (30) to interrogate the oncogenic gene signatures from MSigDB (31). The MCF7L/FOXA1 gene expression profile was highly correlated to the gene sets enriched in MCF7 cells overexpressing ligand-activated epidermal GFR or constitutively active MEK1, or in epithelial cell lines overexpressing an oncogenic KRAS, suggesting that FOXA1 overexpression enhances GFR downstream signaling. In addition, this FOXA1-induced transcriptomic profile was significantly enriched for the gene set that was up-regulated in the MCF7 xenograft tumors that acquired resistance to multiple endocrine therapies from our previously published study (3) (Fig. 3C). These data suggest that increased FOXA1 potentially drives a transcriptional program associated with high GFR signaling that contributes to tumor aggressiveness and endocrine resistance.
Fig. 3.
FOXA1 overexpression is associated with endocrine resistance and poor clinical outcome. (A) FOXA1 IHC of MCF7L-P and TamR, and MCF7L/FOXA1 ± Dox cells. (Scale bar, 100 µm.) (B) Heat map of differentially expressed genes (|Gfold| >1.5) after FOXA1 overexpression in MCF7L/FOXA1 cells. The levels of ER protein in ± Dox cells are shown at the bottom panel. DAVID functional annotation shows the enriched GO terms for the genes up- or down-regulated upon FOXA1 overexpression. (C) GSEA shows the correlation of the gene expression profile of MCF7L/FOXA1 cells with a gene set derived from the Endo-R xenograft tumors (3). (D) Spearman correlation of FOXA1 mRNA levels and the signature scores of the Endo-R gene set in ER+ breast tumors (n = 752). (E and F) Cell growth was measured in MCF7L/FOXA1 and ZR75-1/FOXA1 cells with 0, 0.25, or 1 µg/mL Dox in presence of E2 or various endocrine therapies. E2-treated cells were used as normalization controls for anti-estrogen groups (ED, Tam, and Ful). The induced FOXA1 proteins are shown by Western blots. Data represent means ± SEM, *P < 0.05, **P < 0.01, two-sided t test for all indicated comparisons. (G) Kaplan–Meier plots show RFS in ER+ patients receiving Tam but without chemotherapy (n = 615), who were stratified by FOXA1 mRNA levels at the top quartile (25%) vs. the rest (75%). (H) Same analysis in ER+ patients without endocrine treatment (n = 500). P value was calculated by using the log-rank test. Analysis was performed using an online tool and resource at kmplot.com/analysis (33).
Because differentially expressed genes from our FOXA1-overexpressing MCF7L/FOXA1 preclinical cell model were enriched for genes in our previously described signature from Endo-R xenograft models (3), we asked whether FOXA1 levels were correlated with the endocrine resistance signature score in clinical samples. Indeed, high FOXA1 mRNA levels in 752 ER+ tumors (32) were positively correlated with the Endo-R gene signature (Fig. 3D, Spearman correlation, r = 0.083, P = 0.011). Next, we tested the endocrine response in our Dox-induced FOXA1-overexpressing MCF7L and ZR75-1 cell models. The highest levels of FOXA1 induced endocrine resistance in both cell models (Fig. 3 E and F). Specifically, increased FOXA1 expression was significantly associated with decreased endocrine sensitivity to Tam in MCF7L/FOXA1 cells and to ED in ZR75-1/FOXA1 cells, in a FOXA1 level-dependent manner. The role of FOXA1 expression levels in treatment response was also reflected in clinical samples. In a metaanalysis of published datasets (kmplot.com) (33), we found that the top quartile of FOXA1 mRNA levels was associated with poor relapse-free survival (RFS) in patients with ER+ tumors receiving Tam (n = 615, P = 0.029), but not in patients without endocrine therapy (n = 500, P = 0.81) (Fig. 3 G and H). Collectively, these data suggest that high FOXA1 expression is functionally, biologically, and clinically associated with endocrine resistance.
Proteomic Profiles Perturbed by FOXA1 Overexpression Are Associated with Multiple Oncogenic Pathways.
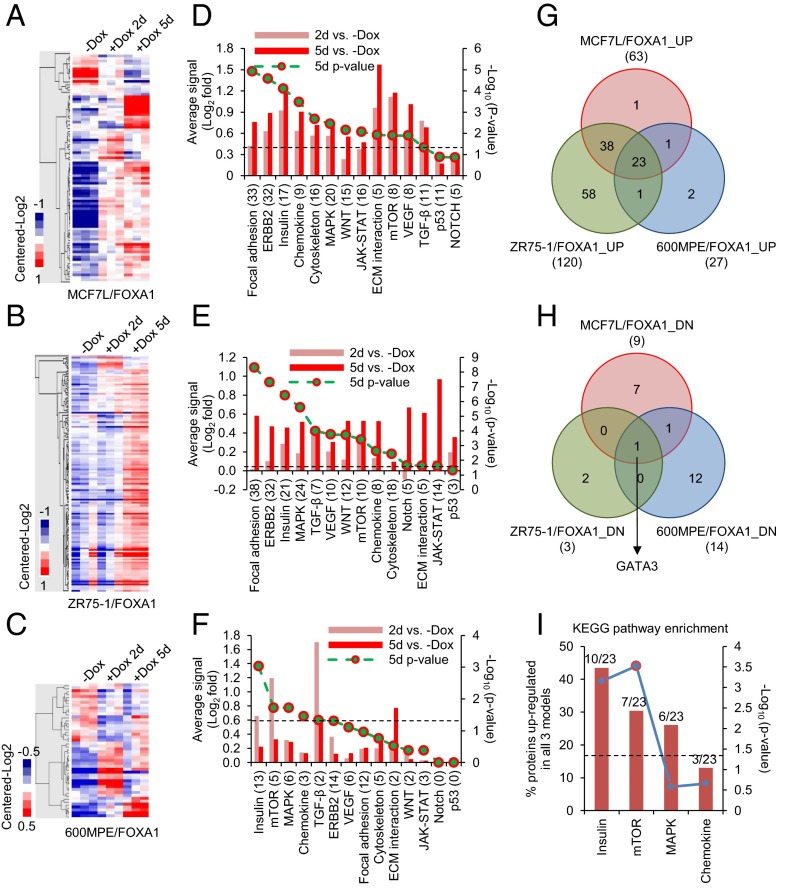
Because of the clinical evidence for the potential role of FOXA1 in mediating endocrine resistance, we wanted to further dissect its downstream signaling pathways. For this, we applied reverse-phase protein arrays (RPPA) to determine the proteomic changes in our FOXA1-overexpressing ER+ cell models, using a total of 204 validated antibodies. Proteins differentially expressed between +Dox (at day 2 or 5) and −Dox samples were identified (Dataset S1, one-way ANOVA, P < 0.05) and visualized in heat maps following hierarchical clustering (Fig. 4 A–C). Consistent with the RNA-seq data, the protein levels of ER and the products of its classically regulated genes (e.g., PGR, BCL2, and MYC) were decreased in the MCF7L/FOXA1 +Dox cells (Fig. S4D). Assigning the total proteins assessed by RPPA into Kyoto Encyclopedia of Genes and Genomes (KEGG) (34) -defined cancer pathways, we tracked the pathway activation status by comparing the averaged signals within each pathway between −/+ Dox samples. We found that the GFR pathways of focal adhesion, ERBB2, and insulin were overactivated in both the MCF7L/FOXA1 +Dox and ZR75-1/FOXA1 +Dox cells (Fig. 4 D and E, P < 0.001). The NOTCH pathway, which previously has been shown to be overactivated in Endo-R breast cancer cells (35), did not seem significantly perturbed by FOXA1 overexpression in our cell models, possibly due to the low number of representative pathway proteins in this RPPA assay. The decreased ER and increased GFR downstream signaling in the MCF7L/FOXA1 +Dox cells was further confirmed by Western blot showing a FOXA1-dependent effect (Fig. S5A). The 600MPE/FOXA1 +Dox cells showed less enhanced GFR signaling, possibly due to an endogenously hyperactivated mitogen-activated protein kinase (MAPK) pathway caused by a KRAS mutation in this line (36) (Fig. 4F). Overall, there were 23 commonly up-regulated and 1 down-regulated (GATA3) proteins across all three cell models upon FOXA1 overexpression (Fig. 4 G and H). The significantly enriched insulin and mechanistic target of rapamycin (mTOR) pathways represented by the 23 commonly up-regulated proteins (Fig. 4I), together with the commonly decreased luminal lineage marker and reciprocal ER regulator GATA3 (27), further support the role of increased FOXA1 in augmenting GFRs and suppressing the classical ER signaling in ER+ breast cancer.
Fig. 4.
FOXA1 overexpression in ER+ breast cancer cell lines induces proteomic perturbations in multiple oncogenic signaling pathways. Heat maps of RPPA data representing differentially expressed proteins (one-way ANOVA, P < 0.05) in MCF7L/FOXA1 (A), ZR75-1/FOXA1 (B), and 600MPE/FOXA1 (C) cells upon Dox addition for 2 or 5 d. (D–F) Signaling perturbations by FOXA1 overexpression in 14 cancer-related KEGG pathways were evaluated in these cell models of A, B, and C, by averaging the expression levels of proteins available from RPPA (numbers in parentheses) within the same pathway, followed by subtraction of basal levels in −Dox cells. A paired one-sided t test was applied and the P value was plotted as minus log10-transformed. The perturbations in pathways with P < 0.05 (P = 0.05 is marked by a dashed line) were statistically significant. Venn diagrams showing the overlapping proteins up- (G) or down-regulated (H) across all three cell models upon FOXA1 overexpression (day 5 of +Dox vs. −Dox, P < 0.05). (I) Enriched KEGG pathways represented by the commonly up-regulated proteins in all three cell models. Significance in enrichment was calculated by Fisher’s exact test (P = 0.05 is marked by a dashed line).
Fig. S5.
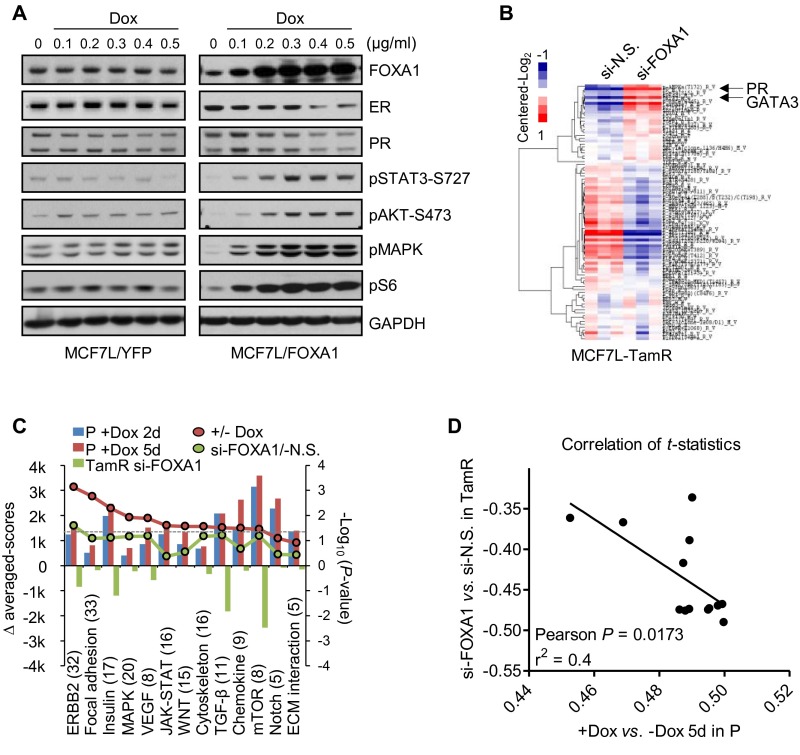
Inverse correlation of proteomic profiles by FOXA1 alteration in MCF7L-P and TamR cells. (A) MCF7L cells with inducible YFP control or FOXA1 overexpression were harvested for protein lysates after 3-d incubation under different doses of Dox. Western blotting was performed using the indicated antibodies. (B) Heat map of the 89 clustered proteins measured by RPPA that were differentially expressed (one-way ANOVA, P < 0.05) in the MCF7L-TamR cells with FOXA1 vs. N.S. (control) knockdown. Arrows indicate the proteins PR and GATA3. (C) Overall comparison of proteomic changes in signaling pathways between the MCF7L/FOXA1 ± Dox cells and the MCF7L-TamR/si-FOXA1 cells. Proteins were assigned to 13 cancer-related pathways defined by KEGG (34). The protein signals in each pathway (protein number in parentheses) were averaged and subtracted by those from the controls, representing the pathway perturbations scaled by the left y axis. A paired one-sided t test was applied to assess pathway perturbations in MCF7L/FOXA1 cells with FOXA1 overexpression and in MCF7L-TamR cells with FOXA1 knockdown. The minus log10-transformed P value was scaled by the right y axis. The gray dashed line marks the P value at 0.05. (D) Pearson correlation was used to assess the concordance of pathway proteomic changes (represented by t statistics) between MCF7L-P and TamR cells with the corresponding FOXA1 manipulations (overexpression in P and knockdown in TamR cells).
We also performed RPPA analysis in the MCF7L-TamR cells with FOXA1 knockdown. Interestingly, the level of proteins related to the classical ER pathway such as PR and GATA3, which was decreased in TamR vs. P cells, was restored by FOXA1 knockdown (Fig. S5B). Furthermore, FOXA1 knockdown in MCF7L-TamR cells suppressed the oncogenic pathways (e.g., ERBB2 and insulin receptor) that otherwise were enhanced in FOXA1-overexpressing P cells (Fig. S5C). The overall proteomic changes in the P cells with FOXA1 overexpression were inversely correlated to the changes in the TamR cells with FOXA1 knockdown (Fig. S5D, Pearson correlation, r = −0.645, P = 0.017). Together with previous transcriptomic data, these findings point to a dominant role of increased FOXA1 in augmenting oncogenic signaling pathways in endocrine resistance, resulting in an inhibitory effect on ER expression and classic ER transcriptional activity.
An Integrative Approach Identifies IL8 As One of the Most Perturbed Genes Regulated by FOXA1 in Endo-R Cells.
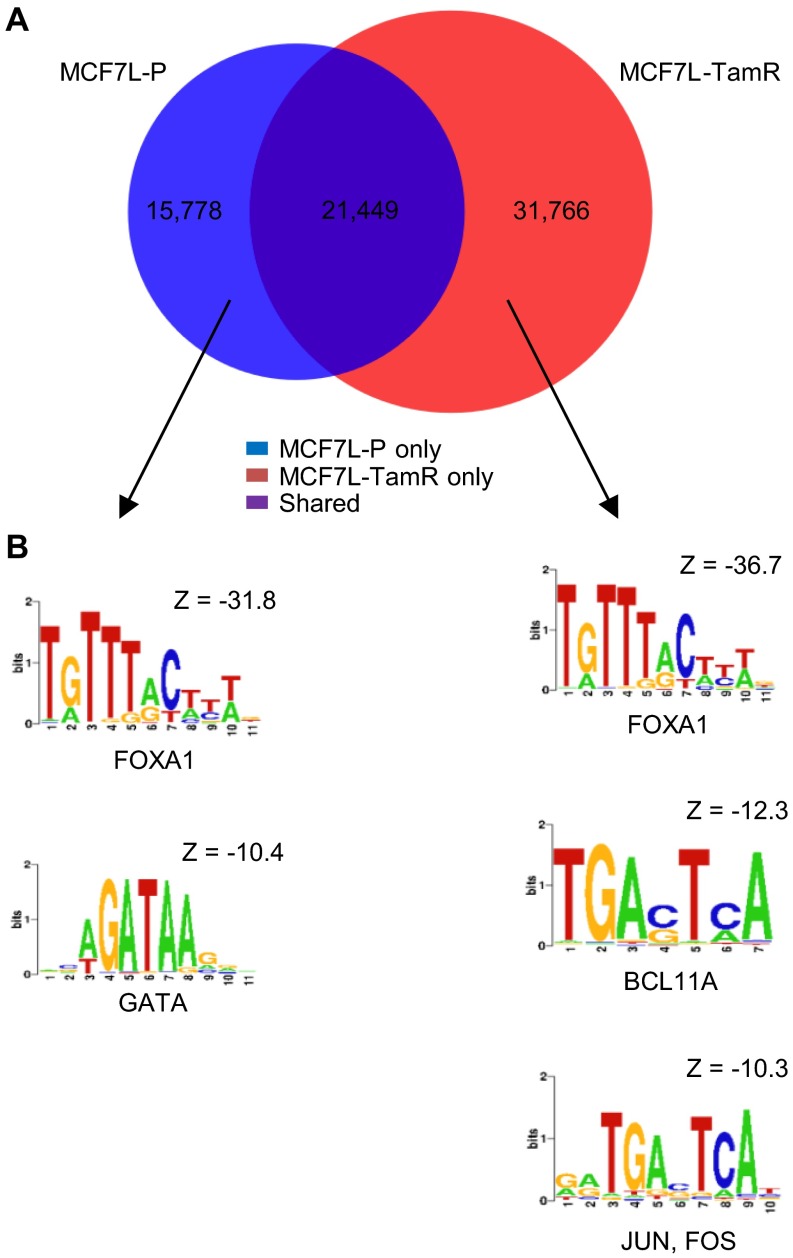
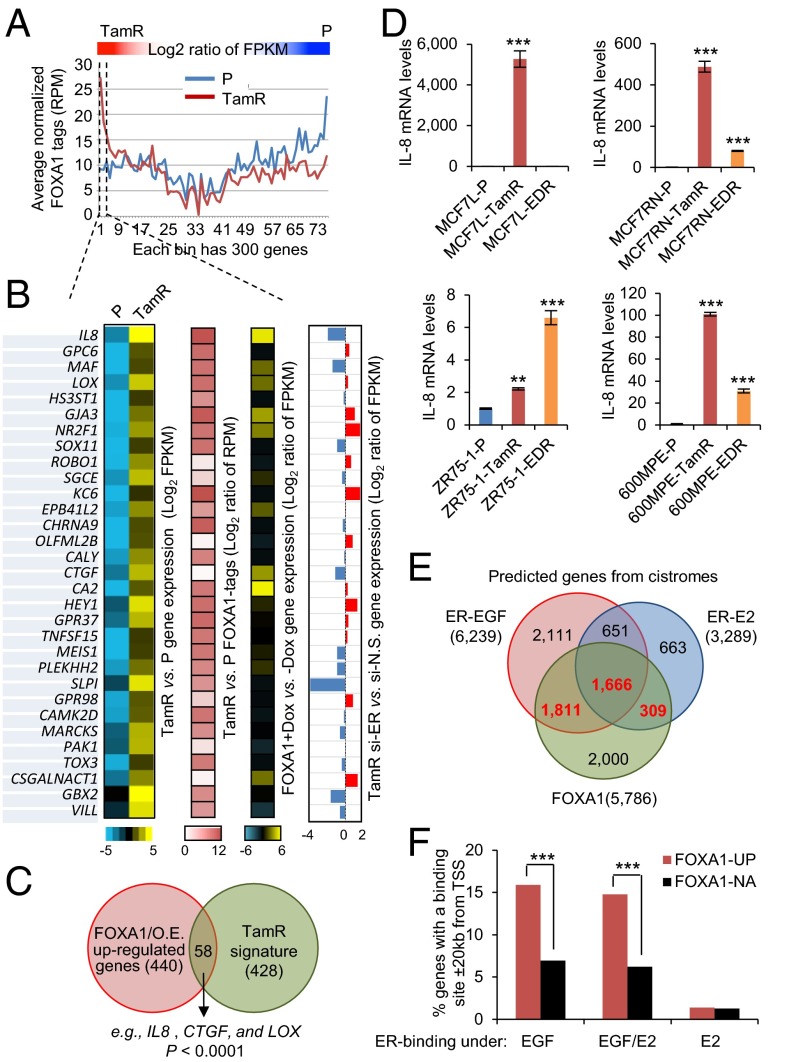
To further investigate the direct impact of FOXA1 on gene expression, we performed FOXA1 genome-wide chromatin immunoprecipitation followed by high-throughput seq (ChIP-seq) in MCF7L-P and TamR cells. A total of 37,227 and 53,215 FOXA1 binding events were found in MCF7L-P and TamR cells, respectively (Fig. S6). Among these binding events, there were 21,449 shared FOXA1 binding events, which accounted for 58% and 40% of total binding events in P and TamR cells, respectively. Within the distinct binding events in P and TamR cells, the highest enrichment was the FOXA1 motif, followed by the GATA motif in P cells, and the BCL11A and JUN/FOS motifs in TamR cells, suggesting significant FOXA1–chromatin binding in both P and TamR cells, albeit on different sites. In parallel with the cistromic profiling, we also obtained the transcriptomic profiles of both MCF7L-P and TamR cells using RNA-seq. In an effort to identify the downstream signaling associated with FOXA1 in endocrine resistance, we integrated the RNA-seq transcriptomic data with the FOXA1 ChIP-seq data described above. The genes preferentially expressed in either TamR or P cells tended to have more FOXA1 binding events (tags) represented by reads per million per nucleotide (RPM), supporting the notion that FOXA1 is indeed important for defining the distinct gene patterns in both TamR and P cells (Fig. 5A).
Fig. S6.
Cistromic profiling of FOXA1 in MCF7L-P and TamR cells. (A) Venn diagram showing the overlap of FOXA1 binding events between MCF7L-P and TamR cells. (B) Enriched motifs in the differential FOXA1 binding events in MCF7L-P and TamR cells.
Fig. 5.
Integrative analysis revealed IL8 as a target of increased FOXA1 in ER transcriptional reprogramming. (A) Integrated RNA-seq and FOXA1 ChIP-seq data in MCF7L-P and TamR cells. Genes aligned in RNA-seq were calculated for their expression log2 ratio of fragments per kilobase of transcript per million mapped reads (FPKM) in TamR vs. P cells, by which the genes were sorted in a descending order. FOXA1 binding events (tags) within ± 20 kb of each gene’s TSS were counted and represented by average normalized RPM for every 300 consecutive genes along the order of sorted genes from RNA-seq. These FOXA1 tags were plotted separately for P (in blue) and TamR (in red) cells. (B) Heat maps of genes with high expression [log2(FPKM)] and with enriched FOXA1 binding (log2 ratio of RPM) in TamR vs. P cells. Heat maps of the expression in these genes (log2 ratio of FPKM) in MCF7L/FOXA1 +Dox vs. −Dox cells and in TamR cells with si-ER vs. si-N.S. knockdown are also shown. (C) Venn diagram showing the overlap genes, including IL8, CTGF, and LOX, between the FOXA1-overexpression (O.E.) up-regulated genes and the MCF7L-TamR signature genes. P value was calculated by Fisher’s exact test. (D) IL-8 gene expression measured by qRT-PCR in four Endo-R cell models. Data represent means ± SEM, *P < 0.05, **P < 0.01, ***P < 0.001, two-sided t test for all comparisons between Endo-R and P cells. (E) Venn diagram showing the overlap among the predicted genes with the binding of FOXA1 and EGF/E2-stimulated ER within ± 20 kb of TSS in MCF7 cells. The gene sets with highlighted numbers (in red) were used for the following analysis. (F) The genes induced (UP) or not altered (NA) by FOXA1 overexpression were intersected with the FOXA1 and ER cistromes. Gene enrichment within the FOXA1-UP gene set for the genes associated with FOXA1 binding and ER binding induced only by EGF, E2, or both was compared with the enrichment within the FOXA1-NA gene set. ***P < 0.001, Fisher’s exact test.
Next, we focused on the top genes that are highly expressed in MCF7L-TamR compared with P cells and that also carry the most abundant FOXA1 tags (RPM) in TamR cells around their gene regions (log2 ratio >0.5) (Fig. 5B). The enriched GO terms within these top genes include “blood vessel development” (IL8, CTGF, LOX, ROBO1, HEY1, and GBX2) and “cell migration” (IL8, CTGF, ROBO1, GBX2, and NR2F1), reminiscent of the GO terms enriched in the FOXA1-overexpressing MCF7L-P cells. Indeed, 50% of these genes (e.g., IL8, CTGF, and LOX) were highly up-regulated in MCF7L/FOXA1 +Dox vs. −Dox cells (log2 ratio >0.5), suggesting FOXA1-dependent regulation. Furthermore, we found that there was a significant overlap between the genes highly represented in MCF7L/FOXA1 +Dox cells (n = 440, Gfold >1.5, FDR <0.05) and the TamR signature genes (n = 428, |log2-ratio| >1.5, FDR <0.05) (Fig. 5C, Fisher’s exact test, P < 0.0001). These genes included IL8, CTGF, and LOX, further suggesting that they may play a role in the FOXA1-dependent mechanism of Tam resistance. Finally, we found that about 50% of genes (including IL8, CTGF, and GBX2) highly expressed in TamR cells with enhanced FOXA1 binding sites were repressed by ER knockdown in TamR cells, suggesting that at least some of the genes regulated by increased FOXA1 are also dependent on ER.
We verified the robust increase in mRNA levels of IL8, the gene at the top of the list, in our two independent TamR cell models from the MCF7 line (L and RN) by qRT-PCR (Fig. 5D). In addition, significantly increased IL-8 expression was also found in both 600MPE and ZR75-1 Endo-R cell derivatives compared with their P cells, although the magnitude was much smaller in ZR75-1 Endo-R cells. Because ER expression is maintained in these Endo-R cells, except the ZR75-1 model, we postulated that the robust up-regulation of IL-8 might need both ER and FOXA1. It has been reported that the FOXA1-mediated reprogramming of ER binding is associated with the differential ER-binding program in ER+ tumors from patients with poor outcome (8). We hypothesized that increased FOXA1 may contribute to ER transcriptional reprogramming in our Endo-R cells. To better appreciate the impact of increased FOXA1 on transcriptional switching of ER from a ligand-dependent to a growth factor-induced and ligand-independent program, we further integrated our RNA-seq data of FOXA1-overexpressing MCF7L/FOXA1 cells with the existing FOXA1 cistrome (7) as well as the ER cistrome induced by estrogen (E2) or epidermal growth factor (EGF) (37) in MCF7 cells. As shown in Fig. 5E, there were overlapping as well as distinct subsets among the genes predicted from the FOXA1 and ER cistromes [genes with FOXA1/ER binding sites ±20 kb of their transcription start sites (TSS)]. We intersected the up-regulated (UP) or not-altered (NA) genes induced by FOXA1 in our MCF7L/FOXA1 cells and the list of genes putatively associated with the FOXA1 cistrome and the ER cistrome induced by EGF, E2, or both. We found that the FOXA1-UP genes were highly enriched for the genes associated with FOXA1 binding and ER binding induced by EGF but not by E2 (Fig. 5F, Fisher’s exact test, P < 0.001). Notably, IL8 and CTGF were found again among the genes with both FOXA1 binding and EGF-induced ER binding, suggesting that the gene regulation by increased FOXA1 involves a growth factor-stimulated ER-dependent process. These data suggest that high levels of FOXA1 may coordinate in the ER transcriptional reprogramming toward a more growth factor-induced cistromic profile, leading to endocrine resistance by a mechanism similar to that we had previously reported in an ER/HER2-positive MCF7 cell model (38, 39).
Increased FOXA1, Together with ER, Coregulates IL-8 Expression.
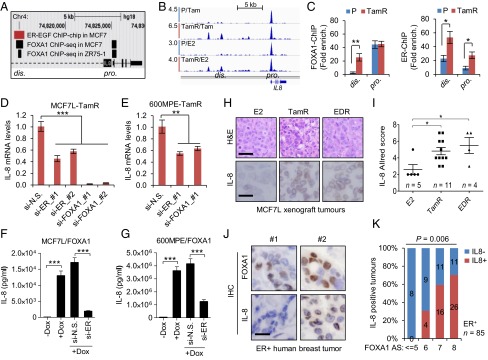
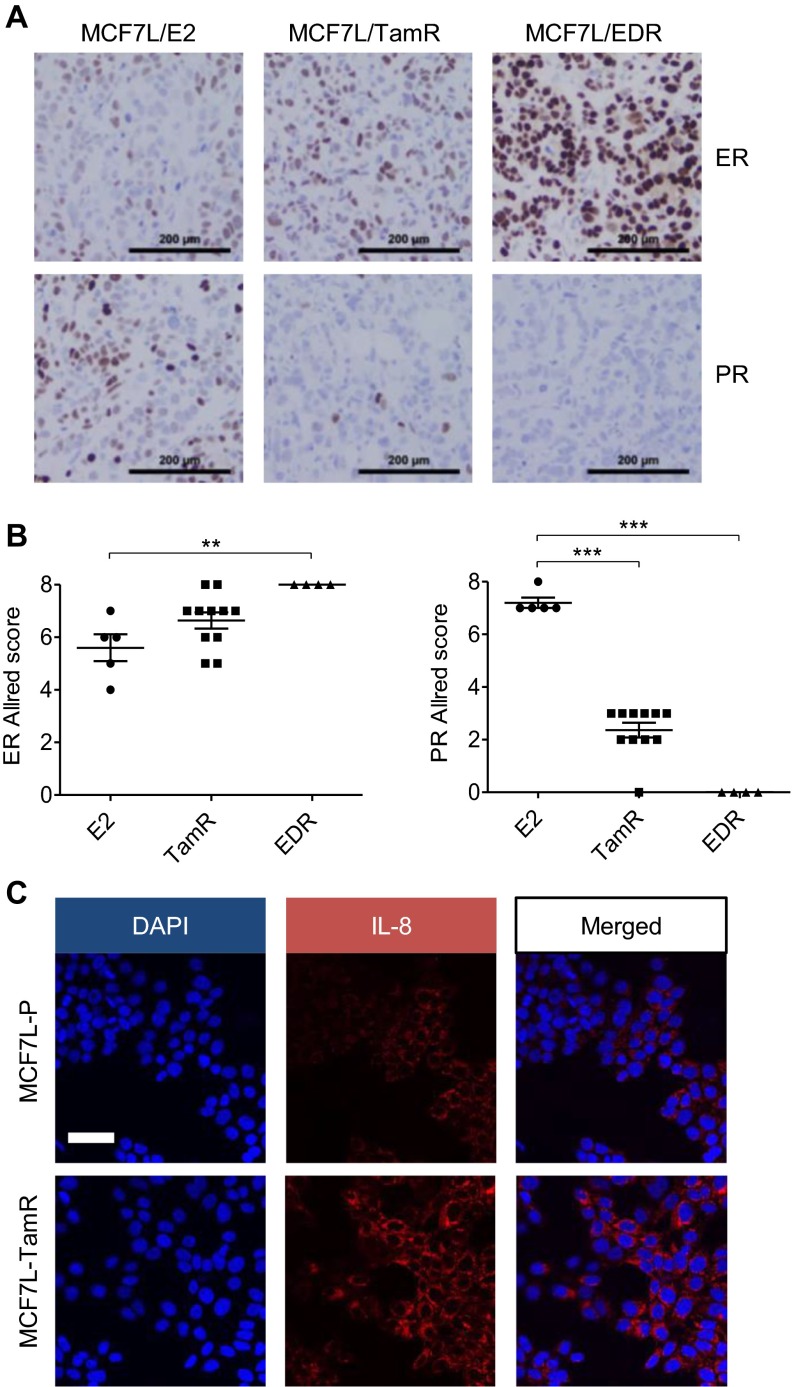
Next, we investigated the regulation of IL-8. Previous cistromic data in MCF7 cells (7, 37) revealed that there were two FOXA1 binding sites at the distal (dis.) and proximal (pro.) regions upstream of the IL8 TSS, and one EGF-stimulated ER binding site at the dis. region (Fig. 6A). Our FOXA1 ChIP-seq data showed that the FOXA1 binding at the dis. region of IL8 in MCF7L-TamR cells was enhanced compared with that in MCF7L-P cells upon either Tam or E2 treatment (Fig. 6B). Using ChIP followed by qPCR, we verified the enhancement of FOXA1 binding at the dis. region in MCF7L-TamR cells (Fig. 6C). Furthermore, there was an enhanced recruitment of ER at the dis. region in MCF7L-TamR cells, the same region where ER binding was previously shown in MCF7 cells treated by EGF (37) or a mitogenic mixture (8) in the absence of the E2 ligand. The ER binding at the pro. region was also enhanced in TamR vs. P cells in this ChIP-qPCR assay. These data suggest that ER can regulate IL-8 in a ligand-independent manner in the context of high GFR signaling associated with endocrine resistance. IL-8 mRNA levels in the two TamR cell models (MCF7L and 600MPE) were reduced by either ER or FOXA1 knockdown (Fig. 6 D and E), with the strongest reduction in the MCF7L-TamR cells from knockdown of FOXA1, suggesting that these binding events are also biologically relevant. In parallel, secretory IL-8 protein was dramatically induced by FOXA1 overexpression in MCF7L-P cells; the increased IL-8 by FOXA1 was substantially reduced by simultaneous ER knockdown (Fig. 6F). This phenomenon could be recapitulated in a second 600MPE/FOXA1 cell model (Fig. 6G), supporting the notion that high levels of FOXA1 and ER might coregulate IL-8 expression. In line with the increased FOXA1 and ER protein levels in our MCF7L Endo-R xenograft tumors (Fig. 2C and Fig. S7 A and B), IL-8 expression was also up-regulated in both TamR and EDR tumors in this xenograft model (Fig. 6 H and I). Moreover, we measured FOXA1 and IL-8 protein levels in a tissue microarray composed of primary ER+ tumor specimens (n = 85) archived in our tumor bank. FOXA1 staining was localized mainly in nuclei, whereas IL-8 staining was mainly in paranuclear regions of cancer cells (Fig. 6J). Paranuclear staining of IL-8 was also seen both in MCF7L-TamR xenograft tumors and in TamR cells in vitro (Fig. S7C). The proportion of IL-8 positive tumors gradually increased with increasing FOXA1 in these ER+ human primary breast tumors (Fig. 6K, Fisher’s exact test, P = 0.006), consistent with the notion that FOXA1 regulates IL-8.
Fig. 6.
Increased FOXA1 and ER regulate IL-8 expression in ER+ breast cancer. (A) Schematic diagram of ER and FOXA1 binding within the IL8 gene locus as defined by EGF-stimulated ER ChIP-on-chip (37) and FOXA1 ChIP-sEq. (7) in MCF7 cells. (B) Snapshot of FOXA1 continuous peaks from ChIP-seq data showing the binding pattern upstream of the IL8 gene TSS in MCF7L-P and MCF7L-TamR cells treated with Tam or E2. (C) FOXA1-ChIP (Left) and ER-ChIP (Right) followed by qPCR of binding regions in MCF7L-P and TamR cells. Quantification of amplified binding regions was calculated as fold enrichment by normalizing to an intergenic sequence as a negative control. (D and E) Measurement of IL-8 mRNA by qRT-PCR in MCF7L-TamR and 600MPE-TamR cells with either ER or FOXA1 knockdown. N.S., nonspecific; #1 and #2, two different siRNA sequences. (F and G) ELISA of IL-8 protein in culture media of MCF7L/FOXA1 and 600MPE/FOXA1 cells −/+Dox in the absence/presence of ER knockdown. (H) Representative H&E staining and IL-8 IHC images from E2-treated and Endo-R MCF7L xenograft tumors. (Scale bars, 100 μm and 50 μm, respectively.) (I) Scatter dot plots of IL-8 Allred score in H. Data represent means ± SEM, *P < 0.05, **P < 0.01, ***P < 0.001, two-sided t test for indicated comparisons. (J) Representative IHC images from two ER+ tumors showing low (#1) vs. high (#2) FOXA1 and the negative vs. positive IL-8 staining, respectively. (Scale bar, 50 μm.) (K) Proportions of positive vs. negative IL-8 tumors within the groups of tumors showing the same FOXA1 Allred score (AS). Correlation of IL-8 positivity and FOXA1-AS was evaluated by Fisher’s exact test.
Fig. S7.
Altered ER, PR, and IL-8 protein levels in Endo-R models. (A) Representative ER and PR IHC images from E2-treated and Endo-R MCF7L xenograft tumors. (Scale bar, 200 μm.) (B) Scatter dot plots of ER and PR Allred score in A. Data represent means ± SEM **P < 0.01, ***P < 0.001, two-sided t test for indicated comparisons. (C) MCF7L-P and TamR cells were processed for IL-8 immunofluorescence staining. DAPI was used for nucleus counterstaining. (Scale bar, 100 μm.)
IL-8 Mediates the Effect of Augmented FOXA1 on Cell Growth, Invasion, and Endocrine Resistance.
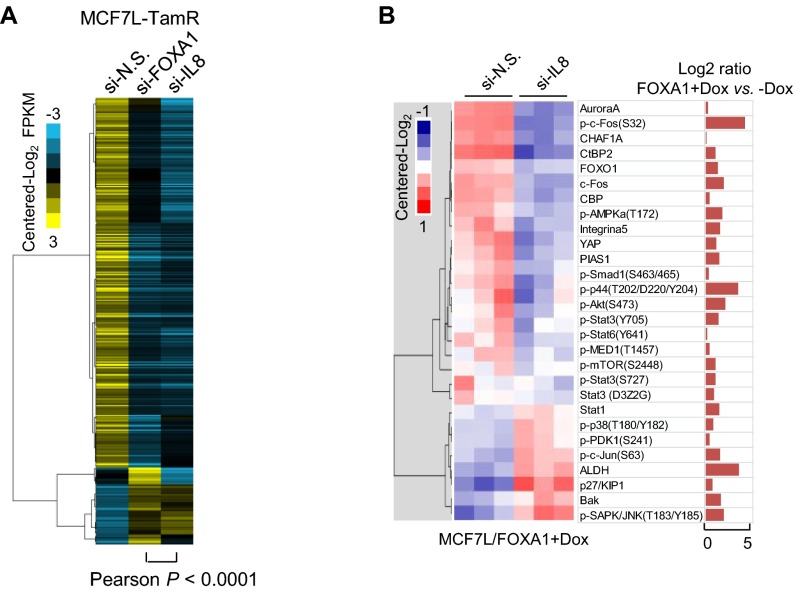
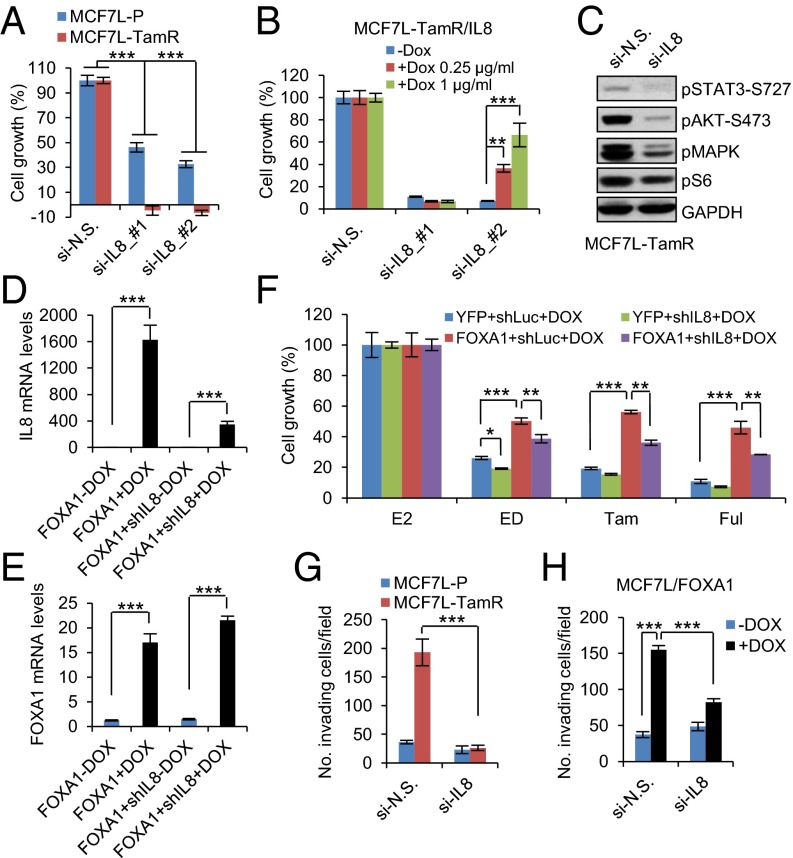
To evaluate the role of IL-8 as a downstream effector of increased FOXA1 in endocrine resistance, we obtained the transcriptomic profiles of MCF7L-TamR cells with FOXA1 or IL-8 knockdown by using RNA-seq. Comparing the genes differentially expressed in TamR cells upon FOXA1 knockdown (|Gfold| >0.5), we found a striking similarity in the expression patterns of these same genes in TamR cells upon IL-8 knockdown (Fig. S8A), suggesting a crucial role of IL-8 in the gene expression perturbations induced by FOXA1 in Endo-R cells. Like FOXA1 knockdown, IL-8 knockdown potently inhibited cell growth in both MCF7L-P and TamR cells, with a greater growth inhibitory effect in TamR than in P cells (Fig. 7A, two-way ANOVA interaction test, P < 0.001). This knockdown effect was rescued by coexpression of an IL-8 cDNA with the IL-8 siRNA sequences (#2) targeting the 3′-UTR region of the IL8 gene, but not with the other siRNA (#1) targeting the coding region of IL-8 (Fig. 7B). Because FOXA1 knockdown in MCF7L-TamR cells suppressed multiple oncogenic pathways that otherwise were up-regulated in FOXA1-overexpressing P cells (Fig. S5C), we asked whether IL-8 knockdown in TamR cells leads to a similar change in signaling. Indeed, the activated signaling of multiple GFR downstream pathways (e.g., pAKT, pMAPK, and pS6) in TamR cells was reduced by IL-8 knockdown (Fig. 7C).
Fig. S8.
Altered transcriptome and proteome upon FOXA1 or IL-8 perturbation. (A) Heat map of the expression of differentially expressed genes (|Gfold| >0.5) in the MCF7L-TamR cells with FOXA1 knockdown, aligned with the expression of the same genes in the MCF7L-TamR cells with IL-8 knockdown. Pearson correlation analysis was performed for the altered expression levels of genes upon FOXA1 knockdown vs. the altered levels of the same genes upon IL-8 knockdown in MCF7L-TamR cells. (B) Heat map of partial RPPA data (centered log2) of the MCF7L/FOXA1 +Dox cells with siRNA knockdown of N.S. or IL-8. Proteins were chosen based on the previous RPPA data showing the high expression levels in MCF7L/FOXA1 +Dox vs. −Dox cells (log2 ratio >0, Right).
Fig. 7.
IL-8 mediates the effect of FOXA1 on cell growth and invasion in endocrine resistance. (A) Cell growth within 5 d in MCF7L-P and TamR cells with IL-8 knockdown by two different sequences. N.S. knockdown was used as normalization control. (B) A stable MCF7L-TamR/IL-8 cell line was established to express Dox-inducible IL-8, encoded by an IL8 cDNA without 3′-UTR sequence. Two different IL8 siRNA sequences, targeting either the IL8 coding DNA sequence (#1) or the 3′-UTR region (#2), were transiently transfected into MCF7L-TamR/IL-8 cells ± Dox at two different doses. A 6-d cell growth measurement was performed using methylene blue staining. Cell growth under N.S. knockdown was used as the normalization control. (C) Western blots of GFR downstream signaling mediators in MCF7L-TamR cells with siRNA knockdown of N.S. or IL-8. (D and E) Measurement of IL-8 and FOXA1 mRNA by qRT-PCR in MCF7L cell lines with inducible FOXA1 overexpression, or concomitant IL-8 knockdown under ± Dox. (F) Cell growth within 7 d in four MCF7L lines with Dox induction (0.5 μg/mL), treated with E2 (as control) or antiestrogen (ED, Tam, or Ful). Cell growth in the E2 group was set as 100%. (G) Cell invasion measurement in MCF7L-P and TamR cells transfected with N.S. or IL-8–targeting siRNAs. Cells were seeded onto Matrigel-coated, 24-well Transwell plates and cultured for 48 h. The invading cells were counted under a microscope for a total of nine random fields. Data are presented as mean number of cells per field. (H) Cell invasion measurement for MCF7L/FOXA1 cells ± Dox with siRNA knockdown of N.S. or IL-8. Cell invasiveness was evaluated as above. Data represent means ± SEM, *P < 0.05, **P < 0.01, ***P < 0.001, two-sided t test for indicated comparisons.
To further investigate the relationship of IL-8 and FOXA1 in endocrine response, we established a series of inducible MCF7L cell lines with overexpression of YFP (control) or FOXA1 combined with concomitant knockdown of luciferase (control) or IL-8 upon induction by Dox. As a result, the increased IL-8 upon FOXA1 induction was substantially reduced by coexpression of IL8-shRNA (Fig. 7D). In contrast, FOXA1 induction was not altered by IL-8 knockdown (Fig. 7E). Without Dox, all of the MCF7L stable lines showed similar sensitivity to endocrine treatment (data not shown). With Dox, IL-8 knockdown alone increased endocrine sensitivity in the ED group (Fig. 7F). Conversely, FOXA1 overexpression alone decreased the endocrine sensitivity to all of the antiestrogen therapies. Importantly, the reduced endocrine sensitivity by overexpressing FOXA1 could be partially reversed by concomitant IL-8 knockdown, suggesting that IL-8 is indeed one of the key downstream mediators of FOXA1 in conferring endocrine resistance. Finally, we used RPPA to measure the signaling changes upon concomitant FOXA1 overexpression and IL-8 knockdown. Among the proteins up-regulated by FOXA1 overexpression in MCF7L/FOXA1 cells, over 70% exhibited reduced expression upon concomitant IL-8 knockdown (Fig. S8B), including the phosphorylated proteins of multiple GFR downstream pathways, such as AKT (pAKT), JNK (pc-Fos), MAPK (pMAPK), JAK-STAT (pSTAT3/6), and mTOR (pmTOR). These data suggest that the contribution of IL-8 to FOXA1-induced endocrine resistance is partially mediated by GFR downstream signaling enhanced by high FOXA1 expression.
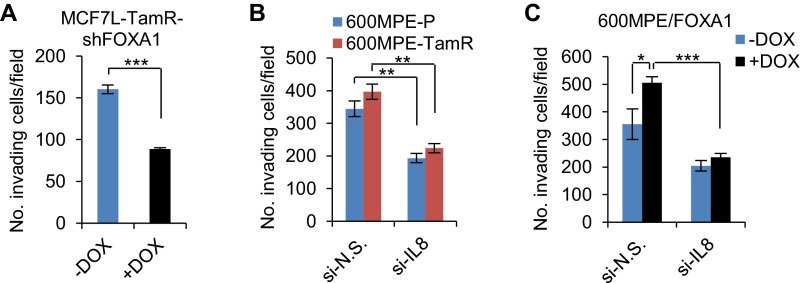
Because deregulated IL-8 signaling also contributes to cancer cell migration, invasion, and metastasis (40, 41), we next evaluated the role of IL-8 in cell invasiveness. We found that IL-8 knockdown significantly reduced cell invasion in MCF7L-TamR, but not MCFL-P, cells, which are much less invasive at baseline (Fig. 7G). The invasiveness of MCF7L-TamR cells was also reduced by FOXA1 knockdown (Fig. S9A). Both 600MPE-P and TamR cells showed stronger invasiveness, possibly due to the constitutively activated RAS/RAF/MAPK pathway. IL-8 knockdown partially mitigated the invasiveness of both 600MPE-P and TamR cells (Fig. S9B). In parallel, FOXA1 overexpression in both MCF7L-P and 600MPE-P cells enhanced cell invasion, which was abrogated by IL-8 knockdown (Fig. 7H and Fig. S9C). These findings support a role for IL-8 in mediating cell invasion in both TamR and FOXA1-overexpressing P cells.
Fig. S9.
Cell invasion upon FOXA1 or IL-8 knockdown. (A) Cell invasion measurement in MCF7L-TamR cells with inducible FOXA1 knockdown. Cells at the same number were seeded onto Matrigel-coated 24-well Transwell plates for 48 h. Invading cells were stained and counted under a microscope. (B) Cell invasion in 600MPE-P and TamR cells transfected with N.S. or IL-8-targeting siRNAs. (C) Cell invasion in 600MPE/FOXA1 cells ± Dox with siRNA knockdown of N.S. or IL-8. Data are presented as means ± SEM of invading cells per field from a total of nine random observed fields. *P < 0.05, **P < 0.01, ***P < 0.001, two-sided t test for indicated comparisons.
Discussion
In characterizing our breast cancer Endo-R cell models to obtain clues for potential mechanisms of endocrine resistance in patients, we discovered gene amplification of the ER pioneer factor FOXA1 in two independently derived TamR lines of MCF7 cells, and we found FOXA1 overexpression without amplification in several other cell lines resistant to Tam or to ED. Recent studies have unveiled gain-of-function mutations in ESR1, the gene encoding ER, in 15–20% of metastatic ER+ Endo-R tumors (42–45). Genomic amplification or overexpression of FOXA1 may be another mechanism modulating ER activity to promote tumor aggressiveness and endocrine resistance. We observed FOXA1-CNG and amplification in 20% of the TCGA breast tumors, with a broader FOXA1-CNG distribution in the luminal B subtype. In a recent study reporting genomic profiling of clinical samples, about one-third (7/20) of the ER+ residual disease showed CN changes after 6 mo of neoadjuvant anastrozole or Ful treatment (46). Interestingly, compared with the baseline tumors, focal amplicons involving the FOXA1 or ESR1 gene appeared in two separate cases in the anastrozole arm, supporting clonal selection by the treatment in a subgroup of patients as a mechanism to compensate or overcome the inhibition of the clinical target/pathway. These data provide evidence for the clinical relevance of our findings in the Endo-R cell line models and further suggest that the genetic alterations in the ER pathway (e.g., FOXA1 and ESR1) might drive the outgrowth of rare cell populations within primary tumors that could contribute to acquired endocrine resistance.
In addition to gene amplification, we found that increased FOXA1 expression occurred at the mRNA and protein levels in other Endo-R cell models in which amplification was not evident. The epigenetic and posttranscriptional regulation of FOXA1 expression in breast and bladder cancer reported by others (47, 48) might also apply in endocrine resistance. In addition, a recent study of molecular profiles of invasive lobular carcinoma identified a cluster of FOXA1 activating mutations that associated with its expression and activity in promoting DNA demethylation of its binding sites (49). The chromatin binding affinity and activity of FOXA1 can also be modulated by a set of breast cancer risk-associated SNPs (50). Collectively, we speculate that there are multiple mechanisms by which FOXA1 activity can be up-regulated in the setting of endocrine resistance. In this study, we showed that FOXA1 overexpression in ER+ breast cancer cells activated multiple oncogenic pathways, leading to endocrine resistance and enhanced cell invasion. Conversely, knockdown of FOXA1 in TamR cells suppressed the corresponding oncogenic/GFR downstream signaling, leading to decreased cell growth in Endo-R cell lines. Similarly, high levels of FOXA1 have been shown to increase the growth of prostate cancer cells and xenograft tumors and to correlate with poor prognosis in prostate cancer patients (21, 51). In breast cancer, high levels of FOXA1 have generally been regarded as a marker of good prognosis (15). As a luminal lineage determinant, FOXA1 promotes the differentiation of normal mammary epithelial cells. Likewise, in cancer cells, it may endorse a classic transcriptional program of hormone receptors such as ER, resulting in a more differentiated and endocrine-sensitive phenotype.
Previous studies from our group and others have shown that during ER+ disease progression, including under chronic Tam treatment, ER switches from ligand (E2)-dependent to ligand-independent or Tam-agonistic signaling and a transcriptional program consistent with GFR downstream activation, leading to endocrine resistance (4, 5, 8, 37). We report here that increased levels of FOXA1 coordinate at least partly with ER in this transcriptional reprogramming, leading to perturbed gene signatures and signaling pathways associated with endocrine resistance. As such, our data support a role for FOXA1 overexpression in more aggressive ER+ tumors, which is in line with the findings of high levels of FOXA1 in both breast and prostate cancer metastases (8, 52). Moreover, we showed that the perturbed genes in FOXA1-overexpressing MCF7L-P cells were enriched for the predicted genes identified by FOXA1 and EGF-induced ER cistromes, which conforms to a study in MCF7 cells showing a rapid redistribution of ER binding mediated by FOXA1 in response to a combination of mitogens (8). As such, increased levels of FOXA1 can drive ER transcriptional reprogramming and endocrine resistance. Strong evidence also comes from prostate cancer, where increased FOXA1 in androgen-responsive prostate cancer cells facilitates AR-chromatin binding at new regions and promotes castration-resistant and androgen-independent cell growth (53). Furthermore, our current study revealed that the distinct cistrome of FOXA1 in MCF7L-TamR cells was enriched for the BCL11A and JUN/FOS motifs. Of note, we have previously shown in our Endo-R xenograft tumors the increased activity of AP-1 (54), the transcription factor binding to the JUN/FOS motif. Further, in a more recent study integrating the expression data from our Endo-R xenograft models with the previously reported growth factor-dependent ER cistrome, and using functional AP-1 blockade, we identified AP-1 as a key determinant of endocrine resistance by shifting the ER transcriptional program (55). Altogether, our results suggest complex interplays between AP-1, ER, and FOXA1 in endocrine resistance and in the associated genome-wide transcriptional reprogramming. Importantly, however, in our Endo-R cell models, we found that not all Endo-R cells with increased FOXA1 maintained ER expression, and that even in those maintaining ER not all of the transcriptional reprogram is influenced by knockdown of ER. These findings suggest that both ER-dependent and ER-independent (i.e., through other transcription factors) mechanisms may underlie the impact of increased FOXA1 on endocrine resistance, as has also been suggested in prostate cancer androgen-deprivation resistant models (56). In the context of this study, the role of FOXA1 in mediating AP-1–dependent gene expression in an ER-dependent or -independent manner is an open question and warrants further study.
How exactly does FOXA1 at high expression levels induce endocrine resistance? Interestingly, through an integrated cistromic and transcriptomic approach and functional studies, we identified IL8 among the most perturbed genes regulated by FOXA1 in an ER-dependent manner in TamR cells. Substantial evidence indicates that increased IL-8 levels, through direct effects on both tumor cells and tumor microenvironment, promote survival of tumor-initiating cells (57), tumor invasion and metastases (40), and therapy resistance (41). However, in ER+ breast cancer, the role of IL-8 remains to be determined. It has been reported that an inflammatory gene signature identified in ER+ breast tumors is associated with poor response to an aromatase inhibitor (58). We find that IL-8 mediates, at least partially, the effect of increased FOXA1 on cell growth and invasion in our Endo-R cells. IL-8 knockdown effectively inhibited Endo-R cell growth and invasion, supporting the potential of IL-8 as both therapeutic target and biomarker in treating Endo-R tumors with high levels of FOXA1 and IL-8.
Collectively, we report FOXA1 gene amplification and/or overexpression in Endo-R cell line models. Subclonal evolution and FOXA1/ER transcriptional reprogramming may coexist as the underlying mechanism of endocrine resistance. IL-8 signaling is one of the components embedded in the FOXA1/ER transcriptional reprogramming and provides a potential therapeutic target for ER+ tumors with increased FOXA1.
Materials and Methods
The Endo-R derivatives were developed from P cells of MCF7L from M. Lippman (Sylvester Comprehensive Cancer Center, Miami, FL), 600MPE (J.W.G.), ZR75-1 (American Type Culture Collection), and BT474 (AstraZeneca), using the method we previously reported (59). The MCF7RN Endo-R cell model was kindly provided by R. Nicholson and J. Gee, Cardiff University, Cardiff, UK. All of the cells were authenticated and the P cells were maintained in RPMI/1640 (MCF7, ZR75-1) or DMEM/high-glucose (600MPE, BT474), supplemented with 10% (vol/vol) heat-inactivated FBS and 1% (vol/vol) penicillin/streptomycin/glutamine (PSG). The Endo-R cells were kept in phenol-red free (PRF) medium supplemented with 10% (vol/vol) heat-inactivated charcoal-stripped (CS)-FBS and 1% (vol/vol) PSG, with (for TamR) or without (for EDR) the addition of 100 nM 4-OH-Tam (H7904; Sigma). The Dox-inducible FOXA1-overexpressing cell lines were established using a lentiviral cDNA delivery system from X. Pan, (Novartis, Cambridge, MA) and maintained by 200 μg/mL Geneticin (Invitrogen). The Dox-inducible shIL-8 knockdown cell lines were established using the pINDUCER system (60). Exome-seq and CN analysis, FISH and gPCR assay, Western blotting, animal studies, RNA interference, cell growth assay, RNA-seq and gene expression analysis, Kaplan–Meier curves, RPPA and signaling pathway analysis, integrated ChIP-seq and RNA-seq data analysis, qRT-PCR, integrative cistromes analysis, ChIP-qPCR, ELISA, IHC, immunofluorescence staining, and cell invasion assay are described in SI Materials and Methods. Statistical analysis of in vitro assays was based on at least triplicated data using R software (v2.13.0) or GraphPad Prism (v5.04). All experiments were repeated at least three times. Quantitative data are shown as mean ± SEM from triplicates or quadruplicates. Significant difference (P < 0.05) was determined by ANOVA or Bonferroni post hoc tests (multiple testing corrected).
Animal care and animal experiments from this study were in accordance with and approved by the Baylor College of Medicine Institutional Animal Care and Use Committee.
SI Materials and Methods
Exome-seq and CN Analysis.
Exome libraries of MCF7(L/RN)-P and -TamR cell line genomic DNAs were generated using the Agilent SureSelect XT kit and Agilent Automation Systems NGS system per the manufacturer’s instructions. Five hundred nanograms of sample libraries were hybridized to the Agilent Biotinylated SureSelect v4 Exome + UTR Capture Library at 65 °C for 72 h following the manufacturer’s protocol. The targeted exon fragments were captured on Dynabeads MyOne Strepavidin T1 (Invitrogen), washed, eluted, and enriched by amplification with Agilent postcapture primer and an indexed primer for multiplexing 12 additional cycles. After purification of the PCR products with AMPure XP beads, the quality and quantity of the resulting exome libraries were analyzed using an Agilent Bioanalyzer High Sensitivity chip.
CN aberrations were quantified and reported for each gene as the segmented normalized log2-transformed exon coverage ratios between TamR and P cells using the previously described method (61). We identified segments as focal if they contained 10 or fewer consensus coding sequence gene annotations. To identify a gene as gained or lost we first considered the segmented data, requiring a CN gain (CNG) or loss of 30% (ratio ≥1.3 or ≤0.7) to call the gene as gained or lost. We called a gene as having a CNG or loss if its coding region overlapped a segment that was gained or lost. We did not require the overlap to have any minimum size. In practice, the gained segments overlapping FOXA1 all contained FOXA1 entirely. FOXA1-CN data from the TCGA ER+ tumors were acquired from the GISTIC2 analyzed data of Affymetrix 6.0 SNP arrays (24, 25), where FOXA1-CNG was defined as log2(CN/2) > 0.1.
FISH.
Four-micrometer-thick formalin-fixed and paraffin-embedded cell pellet sections were baked at 56 °C, dehydrated, and air-dried before pretreatment. In an effort to increase the intensity of the hybridization signals, we chose two BAC clones (RP11-356O9 and CTD-2386P23) to cover the FOXA1 gene at chromosome 14q21.1 and an additional two BAC clones (RP11-314P15 and CTD-2595D15) to target a nonrelevant reference region (REF) at chromosome 14q12. BAC clones RP11-314P15 and RP11-356O9 were obtained from the BAC-PAC Resource at Children’s Hospital Oakland Research Institute. BAC clones CTD-2595D15 and CTD-2386P23 were obtained from Life Technologies. A nick translation kit (Abbott Molecular) was used to make the FOXA1 and REF probes labeled with Spectrum Green and Red dUTPs, respectively. The labeled probes were air-dried, followed by reconstitution in nuclease-free water and hybridization buffer (Abbott Molecular). After denaturation, hybridization was performed at 37 °C for 16 h in a Thermo Hybrite (Abbott Molecular). Hybridized slides were then washed in 2× SSC buffer with 0.3% (vol/vol) IGEPAL (Sigma) once at 70 °C for 2 min, and twice at room temperature for 1 min. Slides were counterstained in Vectashield mounting media with DAPI (Vector Laboratories) and then imaged using an Olympus BX51 microscope. Individual images were captured using a Leica Imaging system running CytoVision (v7.4). A minimum of 50 individual cell nuclei per specimen were counted for both green (FOXA1) and red (REF) foci. A FOXA1:REF ratio was then generated and categorized to scales of 0–1, 1–2, 2–3, 3–4, and ≥4.
gPCR Assay.
DNA was extracted from asynchronous cells using the Wizard Genomic DNA Purification Kit (Promega). FOXA1-CN was measured using the qBiomarker CN PCR assay (Qiagen). Briefly, in parallel to FOXA1 PCR assay, a multicopy reference CN PCR assay (Mref) was applied to provide normalization for DNA input. Real-time PCR was used to determine the CN status of a particular sample using the ΔΔCT method by comparing the test sample (cancer cells) with a reference genome (MCF10A, diploid cell control).
Western Blotting.
This assay was performed as described previously (62). Primary antibodies used in this study are ER (ab9269) and FOXA1 (ab23738) from Abcam; PR (sc-7208) from Santa Cruz Biotechnology; phosphorylated (p) STAT3-S727 (cs9134), pAKT-S473 (cs9271), pMAPK-T202/Y204 (cs9101), pS6-S235/236 (cs2211); and β-actin (cs4970), and GAPDH (cs2118) from Cell Signaling Technology. All Western blots shown for each protein across samples were from the same gel with the same exposure.
Animal Studies.
Animal care and animal experiments from this study were in accordance with and approved by the Baylor College of Medicine Institutional Animal Care and Use Committee. We used the archived formalin-fixed and paraffin-embedded xenograft tumors of MCF7L Endo-R in vivo model derived from our previously published study (59).
RNA Interference.
Cells were transfected with si-FOXA1_ #1 (HSS104880) or #2 (HSS179280) (Invitrogen), si-ER_#1 (VHS40912) or #2 (VHS40913) (Invitrogen), or si-IL8_#1 (SI02654827) or #2 (SI02654834) (Qiagen). The siRNA controls were the siRNA against luciferase (Invitrogen) or the AllStars Negative Control siRNA (Qiagen), with no homology to any known mammalian gene. Transfection was performed using RNAiMAX (Invitrogen) according to the manufacturer’s instructions. Cell lysates were collected at 72 h after transfection for Western blotting. Transfection efficiency was comparable between MCF7L-P and TamR, as shown by the protein reduction in Western blots.
Cell Growth Assay.
Cells were pretreated in PRF medium with 5% CS-FBS and −/+ Dox for 48 h and then split and grown in a 96-well plate with 2,000 cells per well for an additional 48 h before treatment. Culture media with drugs were replaced every 3 d for a total of 4∼6 d. Cell numbers were quantified by an in situ cell cytometer (Celigo; Nexcelom Bioscience) or by colorimetric methylene blue staining (62). Cell growth under E2 was set as the normalization control. All of the antiestrogen treatments (ED, Tam, and Ful) were in the absence of E2. The relative cell growth was determined by (OD at dayn − OD at day0)Treatment/(OD at dayn − OD at day0)E2 × 100%.
RNA-seq and Gene Expression Analysis.
Total RNA was isolated using an RNeasy Mini Kit (Qiagen). For samples from the MCF7L-P and MCF7L-TamR cells, the RNA-seq libraries were prepared using the TruSeq RNA Sample Preparation Kit (Illumina) and the Agilent Automation NGS system according to manufacturers’ instructions. Samples were sequenced on an Illumina HiSeq with paired-end 100-bp reads. Analysis was performed with the ALEXA-seq software package as previously described (63). Briefly, this approach comprised (i) creation of a database of expression and alternative expression sequence “features” (genes, transcripts, exons, junctions, boundaries, introns, and intergenic sequences) based on Ensembl (53_36o) gene models; (ii) alignment of short paired-end sequence reads to these features using BWA (0.5.8a) and BLAST (2.2.18); (iii) identification of features that are expressed above background while taking into account locus-by-locus noise; and (iv) assignment of FPKM-like values for each feature type, normalized to feature size and total library coverage. For samples from the MCF7L-P/FOXA1 ± Dox cells and MCF7L-TamR cells with siRNA knockdown, the RNA-seq libraries were made using the TruSeq RNA Sample Preparation Kit (Illumina) adapted for use on the Sciclone (PerkinElmer) liquid handler. Samples were sequenced on an Illumina Nextseq500 and the 75-bp-long reads were aligned to hg19 with Bowtie aligner (64). Cufflinks was used to generate expression value (FPKM) for each gene (65) and the differential expression analysis was performed using the Gfold method (28). Genes with an absolute Gfold value >1.5 (or >0.5, as appropriate) were presented in a heat map using Java TreeView (66). Functional annotation of the differentially expressed genes upon FOXA1 overexpression was performed using GO Term analysis in DAVID (29). GSEA was performed for pathway analysis of differentially expressed genes using the Molecular Signatures Database (MSigDB, v5.0) (31). Fisher’s exact test was used to assess the correlation of two gene sets with overlapping genes.
Kaplan–Meier Curves.
Kaplan–Meier analysis was performed using an online tool for metaanalysis of public microarray datasets (33) (kmplot.com/analysis/index.php?p=service&cancer=breast). Patients with ER+ tumors (defined by IHC) treated with Tam (without chemo) or without any systemic treatment were analyzed for RFS between the patients that were stratified by the expression of FOXA1 mRNA at top-quartile level.
RPPA and Signaling Pathway Analysis.
RPPA assays were carried out as described previously with minor modifications (67). Protein lysates were prepared from cells using the tissue protein extraction reagent (Pierce) supplemented with 450 mM NaCl and a mixture of protease and phosphatase inhibitors (Roche Life Science) and quantitated using the BCA Assay Kit (Thermo Scientific). Protein lysates at 0.5 μg/μL were denatured in SDS sample buffer (Life Technologies) with 2.5% (vol/vol) 2-mercaptoethanol at 100 °C for 8 min. The Aushon 2470 Arrayer (Aushon BioSystems) with a 40-pin (185-μm) configuration was used to spot lysates onto nitrocellulose-coated slides (Grace Bio-Labs) using an array format of 960 lysates/slide (2,880 spots per slide) with each sample spotted as technical triplicates including test and control lysates. The slides were processed as described (67) and probed with a set of 204 validated antibodies (https://www.bcm.edu/centers/cancer-center/research/shared-resources/antibody-based-proteomics) against total and phosphorylated proteins using an automated slide stainer Autolink 48 (Dako). Each slide was incubated with one specific primary antibody and the negative control slide was incubated with only antibody diluent containing no primary antibody. Primary antibody binding was detected using a biotinylated secondary antibody followed by streptavidin-conjugated IRDye680 fluorophore (LI-COR Biosciences). Total protein content of each spotted lysate was assessed by fluorescent staining with Sypro Ruby Protein Blot Stain according to the manufacturer’s instructions (Molecular Probes). Fluorescence-labeled slides were scanned on a GenePix AL4200 scanner, and the images were analyzed with GenePix Pro-7.0 (Molecular Devices). Total fluorescence signal intensities of each spot were obtained after subtraction of the local background signal for each slide and were then normalized for variation in total protein, background, and nonspecific labeling using a group-based normalization method as described (68). Each image, along with its normalized data, was carefully evaluated for quality through manual inspection and control samples. Antibody slides that failed the quality inspection were either repeated at the end of the staining runs or removed before data reporting. Differentially expressed proteins across samples were determined by one-way ANOVA and the expression values were log2-transformed and mean-centered for visualization in heat maps using Java TreeView. Proteins were categorized according to the KEGG-defined pathways and each group of proteins belonging to the same pathway was compared between samples of interest, by using the paired one-sided t test. Pathway enrichment analysis of commonly altered proteins was conducted by Fisher’s exact test. The concordance of changes in all tested pathways between the two cell lines (MCF7L-P/FOXA1 and MCF7L-TamR/siRNA) was further analyzed using the Pearson correlation test.
Integrated ChIP-seq and RNA-seq Data Analysis.
FOXA1 ChIP experiments were conducted as described previously (69). Briefly, chromatin from ∼1 × 10⁷ fixed cells was sonicated to a size range of 200–300 bp. Solubilized chromatin was subjected to immunoprecipitation with the FOXA1 antibody (ab23738; Abcam) bound to protein A and protein G beads (Life Technologies). A fraction of the sample was not exposed to antibody to be used as a control (input). The samples were reverse-cross-linked and treated with proteinase K, and DNA was extracted. DNA sequencing libraries were prepared using the ThruPLEX-FD Prep Kit (Rubicon Genomics). Libraries were sequenced using 50-bp reads on the Illumina platform at the Dana–Farber Cancer Institute. ChIP-seq reads were aligned to the hg19 genome assembly using Bowtie (62) and ChIP-seq peaks were called using MACS 2.0 (70). Regions of enrichment comparing ChIP and input control signal (FDR <0.01) were called as peaks. Read densities were calculated for each peak for the P and TamR cells in RPM, which were used for comparison of cistromes across samples. RNA-seq transcripts were rank-ordered by their differential expression between TamR and P cells and grouped into bins of 300. The gene bins were plotted against the average read density 20 kb from their TSS. Genes that were highly expressed in TamR vs. P cells with log2 ratio >1.5 (FDR <0.05) were selected and overlapped with the genes carrying highly enriched FOXA1 tags in TamR vs. P cells with log2 ratio >0.5.
qRT-PCR.
The assay procedure was described previously (71). SYBR dye (Life Technologies) was used in real-time PCR and the target primer sequences were as follows: ESR1 forward GGGAAGTATGGCTATGGAATCTG, reverse TGGCTGGACACATATAGTCGTT; FOXA1 forward GCAATACTCGCCTTACGGCT, reverse TACACACCTTGGTAGTACGCC; IL8 forward ACTGAGAGTGATTGAGAGTGGAC, reverse AACCCTCTGCACCCAGTTTTC; and GAPDH forward AAGGTGAAGGTCGGAGTC, reverse GGGGTCATTGATGGCAAC.
Integrative Cistromes Analysis.
Every RefSeq gene (assembly hg18, NCBI v36.1) was searched for the nearest ChIP regions upstream and downstream of TSS using the Cis-Elements Annotation Systems (72). EGF- or E2-stimulated ER ChIP-on-chip (37) and FOXA1 ChIP-seq data (7) from MCF7 cells (peak calls at FDR <0.2) were used to identify the cistromes-defined genes with ER or FOXA1 binding sites within ± 20 kb from the TSS. For the correlation analysis between differential gene expression and transcription factor binding, we calculated the percentage of FOXA1-overexpression induced genes and the percentage of nonaltered genes with binding sites of FOXA1 and ER (induced by EGF, induced by EGF/E2, and induced by E2) in the indicated combinations within ± 20 kb from the TSS. Fisher’s exact test was used to assess the statistical significance in the correlation analysis.
ChIP-qPCR.
ChIP assay was performed using the Zymo-Spin ChIP kit (Zymo Research) following the manufacturer’s protocol. The antibodies used for ChIP assay were anti-FOXA1 (ab23738) from Abcam and anti-ER (sc-543) from Santa Cruz Biotechnology. The occupancy of FOXA1 and ER on the IL8 gene locus was analyzed by real-time qPCR using SYBR Green master mixes (Life Technologies) with the following primers: dis. forward AAGCCCTGGACAAATATACT, reverse CTATTCAATGACATCTGTGGTT; and pro. forward ATAAGTTCTCTAGTAGGGTGATGA, reverse TGCTCTGCTGTCTCTGAA. The intergenic control sequence was amplified using the following primers: forward, GGAACAGGCAACACATAA and reverse, CTCATACATATCTCTTAGGTCAG. The amount of specific DNA fragments from ChIP was presented as the fold enrichment normalized to the intergenic control.
ELISA.
Secreted IL-8 protein was measured by a human IL-8 ELISA kit (Thermo Scientific). Briefly, samples collected from 3-d culture media of cells with −/+ Dox and/or siRNA knockdown were diluted and added to a 96-well microtiter plate, which was coated with anti-IL-8 antibody. After 1 h of incubation, the wells were washed three times and incubated with biotinylated anti–IL-8 antibody for an additional 1 h. The plate was washed three times and incubated with streptavidin-HRP conjugate for 30 min before chromogen substrate was added. The absorbance at A450 minus A550 was measured by using a microplate reader (Bio-Rad). The concentration of IL-8 was calculated from the standard curve and normalized to the protein concentration of the same sample.
IHC.
This assay was performed as described previously (62). Briefly, freshly cut 3-μm sections from paraffin-embedded blocks with integrated human breast tumors (3-mm core tissue, ×50) or cell pellets were deparaffinized and subjected to epitope retrieval in boiling citrate buffer (pH 6.0) for 20 min. After blocking in 3% (vol/vol) hydrogen peroxide for 5 min, slides were incubated with antibody [normal IgG control (Santa Cruz Biotechnology), FOXA1 (1:200, ab23738; Abcam), or IL-8 (1:500; Serotec)] at room temperature for 1 h. Immunodetection was performed with the EnVision+ System (DakoCytomation). The completed slides were independently reviewed by two pathologists. The nuclear FOXA1 and paranuclear IL-8 staining was assessed using an Allred scoring system (73). IL-8-positive tumors were defined by Allred score >0 for correlation analysis with FOXA1 staining.
Immunofluorescence Staining.
Cells were grown on poly-l-lysine–coated coverslips (Corning) for 24 h, washed twice in PBS, fixed in 4% formaldehyde, and permeabilized by 0.1% (vol/vol) Triton X-100 for 15 min on ice. After blocking in 1% (w/vol) BSA for 1 h, cells were incubated with anti–IL-8 polyclonal antibody (1:100; Serotec) overnight at 4 °C. Immunoreactivity was developed using an anti-rabbit IgG conjugated with Alexa-Fluor-594 (1:500; Cell Signaling) for 1 h at 4 °C. Cells were counterstained in Vectashield mounting medium with DAPI (Vector Laboratories) and then imaged using a Leica confocal imaging system (TCS-SP5) running LAS-AF Application Suite (v1.83).
Cell Invasion Assay.
This assay was performed in a 24-well BD Falcon Multiwell Insert System containing an 8-μm pore size membrane. The surface of the upper chamber was coated with 4 µg of basement membrane matrix Matrigel (BD) diluted in 50 µL of DMEM:F12 medium and allowed to air-dry overnight. The Matrigel was then rehydrated with medium for 2 h. Cells were cultured in −/+ Dox and/or transfected with siRNA for 48 h followed by additional 24 h of prestarvation in serum-free medium, and then split and transferred to the upper chamber (1 × 10⁵ cells per well). The lower chamber was filled with 300 µL of medium supplemented with 20% (vol/vol) FBS and EGF (50 ng/mL) and 300 µL of conditioned medium (0.45-µm filtered) obtained from prestarved cells. After 24–48 h of incubation, cells on the upper surface of the membrane were removed by wiping with a cotton swab, and the cells remaining on the down side of the membrane were fixed by 5% (vol/vol) glutaraldehyde and stained with 1% (w/vol) crystal violet solution. Cell invasion was assessed under a microscope by counting the cells at 40× magnification from nine different fields per well and represented as number of invading cells per field.
Supplementary Material
Acknowledgments
We thank Drs. Robert Nicholson and Julia Gee for providing the paired MCF7RN-P and TamR cell line model; Dr. Mathieu Lupien for sharing ER ChIP-chip data; Rena Mao and Joy Guo for performing IHC; Fuli Jia, Myra Costello, and Dr. Kimberley Holloway for performing RPPA assay; Drs. Kimal Rajapakshe, Cristian Coarfa, and Qianxing Mo for RPPA data processing; and Dr. Gary Chamness for reading and reviewing this manuscript. This work was supported by Department of Defense Breakthrough Award W81XWH-14-1-0326 (to X.F.), the Breast Cancer Research Foundation (R.S. and C.K.O.), Stand Up to Cancer Translational Grant SU2C-AACR-DT0409 (to R.S., C.K.O., and J.W.G.), NIH Breast Cancer Specialized Programs of Research Excellence Grants P50CA058183 and P50CA186784 (to C.K.O. and R.S.), NIH Cancer Center Grant P30CA125123 (to C.K.O.), and Susan G. Komen for the Cure Foundation Promise Grants PG12221410 (to C.K.O. and R.S.) and SAC110012 (to J.W.G.). This work was supported by Proteomics & Metabolomics Core Facility with funding from Cancer Prevention Research Institute of Texas Grant RP120092 (to S.H. and D.P.E.) and Cytometry and Cell Sorting Core at Baylor College of Medicine with funding from NIH Grants P30AI036211, P30CA125123, and S10RR024574 and the expert assistance of Joel M. Sederstrom.
Footnotes
The authors declare no conflict of interest.
This article is a PNAS Direct Submission.
Data deposition: The exome sequencing data have been deposited in the Sequence Read Archive (SRA) database (accession no. SRP066629). The RNA sequencing and ChIP sequencing data have been deposited in the Gene Expression Omnibus (GEO) database (SuperSeries accession no. GSE75372).
This article contains supporting information online at www.pnas.org/lookup/suppl/doi:10.1073/pnas.1612835113/-/DCSupplemental.
References
- 1.Brodie A, Sabnis G. Adaptive changes result in activation of alternate signaling pathways and acquisition of resistance to aromatase inhibitors. Clin Cancer Res. 2011;17(13):4208–4213. doi: 10.1158/1078-0432.CCR-10-2920. [DOI] [PMC free article] [PubMed] [Google Scholar]
- 2.Ring A, Dowsett M. Mechanisms of tamoxifen resistance. Endocr Relat Cancer. 2004;11(4):643–658. doi: 10.1677/erc.1.00776. [DOI] [PubMed] [Google Scholar]
- 3.Creighton CJ, et al. Development of resistance to targeted therapies transforms the clinically associated molecular profile subtype of breast tumor xenografts. Cancer Res. 2008;68(18):7493–7501. doi: 10.1158/0008-5472.CAN-08-1404. [DOI] [PMC free article] [PubMed] [Google Scholar]
- 4.Fu X, et al. Overcoming endocrine resistance due to reduced PTEN levels in estrogen receptor-positive breast cancer by co-targeting mammalian target of rapamycin, protein kinase B, or mitogen-activated protein kinase kinase. Breast Cancer Res. 2014;16(5):430. doi: 10.1186/s13058-014-0430-x. [DOI] [PMC free article] [PubMed] [Google Scholar]
- 5.Massarweh S, et al. Tamoxifen resistance in breast tumors is driven by growth factor receptor signaling with repression of classic estrogen receptor genomic function. Cancer Res. 2008;68(3):826–833. doi: 10.1158/0008-5472.CAN-07-2707. [DOI] [PubMed] [Google Scholar]
- 6.Fu X, Osborne CK, Schiff R. Biology and therapeutic potential of PI3K signaling in ER+/HER2-negative breast cancer. Breast. 2013;22(Suppl 2):S12–S18. doi: 10.1016/j.breast.2013.08.001. [DOI] [PMC free article] [PubMed] [Google Scholar]
- 7.Hurtado A, Holmes KA, Ross-Innes CS, Schmidt D, Carroll JS. FOXA1 is a key determinant of estrogen receptor function and endocrine response. Nat Genet. 2011;43(1):27–33. doi: 10.1038/ng.730. [DOI] [PMC free article] [PubMed] [Google Scholar]
- 8.Ross-Innes CS, et al. Differential oestrogen receptor binding is associated with clinical outcome in breast cancer. Nature. 2012;481(7381):389–393. doi: 10.1038/nature10730. [DOI] [PMC free article] [PubMed] [Google Scholar]
- 9.Carroll JS, et al. Genome-wide analysis of estrogen receptor binding sites. Nat Genet. 2006;38(11):1289–1297. doi: 10.1038/ng1901. [DOI] [PubMed] [Google Scholar]
- 10.Clarke CL, Graham JD. Non-overlapping progesterone receptor cistromes contribute to cell-specific transcriptional outcomes. PLoS One. 2012;7(4):e35859. doi: 10.1371/journal.pone.0035859. [DOI] [PMC free article] [PubMed] [Google Scholar]
- 11.Gao N, et al. The role of hepatocyte nuclear factor-3 alpha (Forkhead Box A1) and androgen receptor in transcriptional regulation of prostatic genes. Mol Endocrinol. 2003;17(8):1484–1507. doi: 10.1210/me.2003-0020. [DOI] [PubMed] [Google Scholar]
- 12.Lupien M, et al. FoxA1 translates epigenetic signatures into enhancer-driven lineage-specific transcription. Cell. 2008;132(6):958–970. doi: 10.1016/j.cell.2008.01.018. [DOI] [PMC free article] [PubMed] [Google Scholar]
- 13.Ademuyiwa FO, Thorat MA, Jain RK, Nakshatri H, Badve S. Expression of Forkhead-box protein A1, a marker of luminal A type breast cancer, parallels low Oncotype DX 21-gene recurrence scores. Mod Pathol. 2010;23(2):270–275. doi: 10.1038/modpathol.2009.172. [DOI] [PubMed] [Google Scholar]
- 14.Bernardo GM, et al. FOXA1 represses the molecular phenotype of basal breast cancer cells. Oncogene. 2013;32(5):554–563. doi: 10.1038/onc.2012.62. [DOI] [PMC free article] [PubMed] [Google Scholar]
- 15.Badve S, et al. FOXA1 expression in breast cancer--correlation with luminal subtype A and survival. Clin Cancer Res. 2007;13(15 Pt 1):4415–4421. doi: 10.1158/1078-0432.CCR-07-0122. [DOI] [PubMed] [Google Scholar]
- 16.Mehta RJ, et al. FOXA1 is an independent prognostic marker for ER-positive breast cancer. Breast Cancer Res Treat. 2012;131(3):881–890. doi: 10.1007/s10549-011-1482-6. [DOI] [PubMed] [Google Scholar]
- 17.Tangen IL, et al. Switch in FOXA1 status associates with endometrial cancer progression. PLoS One. 2014;9(5):e98069. doi: 10.1371/journal.pone.0098069. [DOI] [PMC free article] [PubMed] [Google Scholar]
- 18.Zhang Y, et al. Cancer cells resistant to therapy promote cell surface relocalization of GRP78 which complexes with PI3K and enhances PI(3,4,5)P3 production. PLoS One. 2013;8(11):e80071. doi: 10.1371/journal.pone.0080071. [DOI] [PMC free article] [PubMed] [Google Scholar]
- 19.Hiscox S, et al. Elevated Src activity promotes cellular invasion and motility in tamoxifen resistant breast cancer cells. Breast Cancer Res Treat. 2006;97(3):263–274. doi: 10.1007/s10549-005-9120-9. [DOI] [PubMed] [Google Scholar]
- 20.Barretina J, et al. The Cancer Cell Line Encyclopedia enables predictive modelling of anticancer drug sensitivity. Nature. 2012;483(7391):603–607. doi: 10.1038/nature11003. [DOI] [PMC free article] [PubMed] [Google Scholar]
- 21.Grasso CS, et al. The mutational landscape of lethal castration-resistant prostate cancer. Nature. 2012;487(7406):239–243. doi: 10.1038/nature11125. [DOI] [PMC free article] [PubMed] [Google Scholar]
- 22.Lin L, et al. The hepatocyte nuclear factor 3 alpha gene, HNF3alpha (FOXA1), on chromosome band 14q13 is amplified and overexpressed in esophageal and lung adenocarcinomas. Cancer Res. 2002;62(18):5273–5279. [PubMed] [Google Scholar]
- 23.Nucera C, et al. FOXA1 is a potential oncogene in anaplastic thyroid carcinoma. Clin Cancer Res. 2009;15(11):3680–3689. doi: 10.1158/1078-0432.CCR-08-3155. [DOI] [PubMed] [Google Scholar]
- 24.Cancer Genome Atlas N. Cancer Genome Atlas Network Comprehensive molecular portraits of human breast tumours. Nature. 2012;490(7418):61–70. doi: 10.1038/nature11412. [DOI] [PMC free article] [PubMed] [Google Scholar]
- 25.Gao J, et al. Integrative analysis of complex cancer genomics and clinical profiles using the cBioPortal. Sci Signal. 2013;6(269):pl1. doi: 10.1126/scisignal.2004088. [DOI] [PMC free article] [PubMed] [Google Scholar]
- 26.Vollebergh MA, et al. Lack of genomic heterogeneity at high-resolution aCGH between primary breast cancers and their paired lymph node metastases. PLoS One. 2014;9(8):e103177. doi: 10.1371/journal.pone.0103177. [DOI] [PMC free article] [PubMed] [Google Scholar]
- 27.Eeckhoute J, et al. Positive cross-regulatory loop ties GATA-3 to estrogen receptor alpha expression in breast cancer. Cancer Res. 2007;67(13):6477–6483. doi: 10.1158/0008-5472.CAN-07-0746. [DOI] [PubMed] [Google Scholar]
- 28.Feng J, et al. GFOLD: A generalized fold change for ranking differentially expressed genes from RNA-seq data. Bioinformatics. 2012;28(21):2782–2788. doi: 10.1093/bioinformatics/bts515. [DOI] [PubMed] [Google Scholar]
- 29.Huang W, Sherman BT, Lempicki RA. Systematic and integrative analysis of large gene lists using DAVID bioinformatics resources. Nat Protoc. 2009;4(1):44–57. doi: 10.1038/nprot.2008.211. [DOI] [PubMed] [Google Scholar]
- 30.Mootha VK, et al. PGC-1alpha-responsive genes involved in oxidative phosphorylation are coordinately downregulated in human diabetes. Nat Genet. 2003;34(3):267–273. doi: 10.1038/ng1180. [DOI] [PubMed] [Google Scholar]
- 31.Subramanian A, et al. Gene set enrichment analysis: A knowledge-based approach for interpreting genome-wide expression profiles. Proc Natl Acad Sci USA. 2005;102(43):15545–15550. doi: 10.1073/pnas.0506580102. [DOI] [PMC free article] [PubMed] [Google Scholar]
- 32.Kessler JD, et al. A SUMOylation-dependent transcriptional subprogram is required for Myc-driven tumorigenesis. Science. 2012;335(6066):348–353. doi: 10.1126/science.1212728. [DOI] [PMC free article] [PubMed] [Google Scholar]
- 33.Györffy B, et al. An online survival analysis tool to rapidly assess the effect of 22,277 genes on breast cancer prognosis using microarray data of 1,809 patients. Breast Cancer Res Treat. 2010;123(3):725–731. doi: 10.1007/s10549-009-0674-9. [DOI] [PubMed] [Google Scholar]
- 34.Kanehisa M, Goto S. KEGG: Kyoto Encyclopedia of Genes and Genomes. Nucleic Acids Res. 2000;28(1):27–30. doi: 10.1093/nar/28.1.27. [DOI] [PMC free article] [PubMed] [Google Scholar]
- 35.Magnani L, et al. Genome-wide reprogramming of the chromatin landscape underlies endocrine therapy resistance in breast cancer. Proc Natl Acad Sci USA. 2013;110(16):E1490–E1499. doi: 10.1073/pnas.1219992110. [DOI] [PMC free article] [PubMed] [Google Scholar]
- 36.Heiser LM, et al. Integrated analysis of breast cancer cell lines reveals unique signaling pathways. Genome Biol. 2009;10(3):R31. doi: 10.1186/gb-2009-10-3-r31. [DOI] [PMC free article] [PubMed] [Google Scholar]
- 37.Lupien M, et al. Growth factor stimulation induces a distinct ER(alpha) cistrome underlying breast cancer endocrine resistance. Genes Dev. 2010;24(19):2219–2227. doi: 10.1101/gad.1944810. [DOI] [PMC free article] [PubMed] [Google Scholar]
- 38.Shou J, et al. Mechanisms of tamoxifen resistance: Increased estrogen receptor-HER2/neu cross-talk in ER/HER2-positive breast cancer. J Natl Cancer Inst. 2004;96(12):926–935. doi: 10.1093/jnci/djh166. [DOI] [PubMed] [Google Scholar]
- 39.Osborne CK, Shou J, Massarweh S, Schiff R. Crosstalk between estrogen receptor and growth factor receptor pathways as a cause for endocrine therapy resistance in breast cancer. Clin Cancer Res. 2005;11(2 Pt 2):865s–870s. [PubMed] [Google Scholar]
- 40.Singh JK, Simões BM, Howell SJ, Farnie G, Clarke RB. Recent advances reveal IL-8 signaling as a potential key to targeting breast cancer stem cells. Breast Cancer Res. 2013;15(4):210. doi: 10.1186/bcr3436. [DOI] [PMC free article] [PubMed] [Google Scholar]
- 41.Britschgi A, et al. JAK2/STAT5 inhibition circumvents resistance to PI3K/mTOR blockade: A rationale for cotargeting these pathways in metastatic breast cancer. Cancer Cell. 2012;22(6):796–811. doi: 10.1016/j.ccr.2012.10.023. [DOI] [PubMed] [Google Scholar]
- 42.Li S, et al. Endocrine-therapy-resistant ESR1 variants revealed by genomic characterization of breast-cancer-derived xenografts. Cell Reports. 2013;4(6):1116–1130. doi: 10.1016/j.celrep.2013.08.022. [DOI] [PMC free article] [PubMed] [Google Scholar]
- 43.Toy W, et al. ESR1 ligand-binding domain mutations in hormone-resistant breast cancer. Nat Genet. 2013;45(12):1439–1445. doi: 10.1038/ng.2822. [DOI] [PMC free article] [PubMed] [Google Scholar]
- 44.Robinson DR, et al. Activating ESR1 mutations in hormone-resistant metastatic breast cancer. Nat Genet. 2013;45(12):1446–1451. doi: 10.1038/ng.2823. [DOI] [PMC free article] [PubMed] [Google Scholar]
- 45.Jeselsohn R, et al. Emergence of constitutively active estrogen receptor-α mutations in pretreated advanced estrogen receptor-positive breast cancer. Clin Cancer Res. 2014;20(7):1757–1767. doi: 10.1158/1078-0432.CCR-13-2332. [DOI] [PMC free article] [PubMed] [Google Scholar]
- 46.Quenel-Tueux N, et al. Clinical and genomic analysis of a randomised phase II study evaluating anastrozole and fulvestrant in postmenopausal patients treated for large operable or locally advanced hormone-receptor-positive breast cancer. Br J Cancer. 2015;113(4):585–594. doi: 10.1038/bjc.2015.247. [DOI] [PMC free article] [PubMed] [Google Scholar]
- 47.Gong C, et al. FOXA1 repression is associated with loss of BRCA1 and increased promoter methylation and chromatin silencing in breast cancer. Oncogene. 2015;34(39):5012–5024. doi: 10.1038/onc.2014.421. [DOI] [PMC free article] [PubMed] [Google Scholar]
- 48.Drayton RM, et al. MicroRNA-99a and 100 mediated upregulation of FOXA1 in bladder cancer. Oncotarget. 2014;5(15):6375–6386. doi: 10.18632/oncotarget.2221. [DOI] [PMC free article] [PubMed] [Google Scholar]
- 49.Ciriello G, et al. TCGA Research Network Comprehensive molecular portraits of invasive lobular breast cancer. Cell. 2015;163(2):506–519. doi: 10.1016/j.cell.2015.09.033. [DOI] [PMC free article] [PubMed] [Google Scholar]
- 50.Cowper-Sallari R, et al. Breast cancer risk-associated SNPs modulate the affinity of chromatin for FOXA1 and alter gene expression. Nat Genet. 2012;44(11):1191–1198. doi: 10.1038/ng.2416. [DOI] [PMC free article] [PubMed] [Google Scholar]
- 51.Gerhardt J, et al. FOXA1 promotes tumor progression in prostate cancer and represents a novel hallmark of castration-resistant prostate cancer. Am J Pathol. 2012;180(2):848–861. doi: 10.1016/j.ajpath.2011.10.021. [DOI] [PubMed] [Google Scholar]
- 52.Jain RK, Mehta RJ, Nakshatri H, Idrees MT, Badve SS. High-level expression of forkhead-box protein A1 in metastatic prostate cancer. Histopathology. 2011;58(5):766–772. doi: 10.1111/j.1365-2559.2011.03796.x. [DOI] [PubMed] [Google Scholar]
- 53.Robinson JL, et al. Elevated levels of FOXA1 facilitate androgen receptor chromatin binding resulting in a CRPC-like phenotype. Oncogene. 2014;33(50):5666–5674. doi: 10.1038/onc.2013.508. [DOI] [PMC free article] [PubMed] [Google Scholar]
- 54.Schiff R, et al. Oxidative stress and AP-1 activity in tamoxifen-resistant breast tumors in vivo. J Natl Cancer Inst. 2000;92(23):1926–1934. doi: 10.1093/jnci/92.23.1926. [DOI] [PubMed] [Google Scholar]
- 55.Malorni L, et al. Blockade of AP-1 potentiates endocrine therapy and overcomes resistance. Mol Cancer Res. 2016;14(5):470–481. doi: 10.1158/1541-7786.MCR-15-0423. [DOI] [PMC free article] [PubMed] [Google Scholar]
- 56.Zhang C, et al. Definition of a FoxA1 cistrome that is crucial for G1 to S-phase cell-cycle transit in castration-resistant prostate cancer. Cancer Res. 2011;71(21):6738–6748. doi: 10.1158/0008-5472.CAN-11-1882. [DOI] [PMC free article] [PubMed] [Google Scholar]
- 57.Ginestier C, et al. CXCR1 blockade selectively targets human breast cancer stem cells in vitro and in xenografts. J Clin Invest. 2010;120(2):485–497. doi: 10.1172/JCI39397. [DOI] [PMC free article] [PubMed] [Google Scholar]
- 58.Dunbier AK, et al. Molecular profiling of aromatase inhibitor-treated postmenopausal breast tumors identifies immune-related correlates of resistance. Clin Cancer Res. 2013;19(10):2775–2786. doi: 10.1158/1078-0432.CCR-12-1000. [DOI] [PubMed] [Google Scholar]
- 59.Morrison G, et al. Therapeutic potential of the dual EGFR/HER2 inhibitor AZD8931 in circumventing endocrine resistance. Breast Cancer Res Treat. 2014;144(2):263–272. doi: 10.1007/s10549-014-2878-x. [DOI] [PMC free article] [PubMed] [Google Scholar]
- 60.Meerbrey KL, et al. The pINDUCER lentiviral toolkit for inducible RNA interference in vitro and in vivo. Proc Natl Acad Sci USA. 2011;108(9):3665–3670. doi: 10.1073/pnas.1019736108. [DOI] [PMC free article] [PubMed] [Google Scholar]
- 61.Lonigro RJ, et al. Detection of somatic copy number alterations in cancer using targeted exome capture sequencing. Neoplasia. 2011;13(11):1019–1025. doi: 10.1593/neo.111252. [DOI] [PMC free article] [PubMed] [Google Scholar]
- 62.Wang YC, et al. Different mechanisms for resistance to trastuzumab versus lapatinib in HER2-positive breast cancers--role of estrogen receptor and HER2 reactivation. Breast Cancer Res. 2011;13(6):R121. doi: 10.1186/bcr3067. [DOI] [PMC free article] [PubMed] [Google Scholar]
- 63.Griffith M, et al. Alternative expression analysis by RNA sequencing. Nat Methods. 2010;7(10):843–847. doi: 10.1038/nmeth.1503. [DOI] [PubMed] [Google Scholar]
- 64.Langmead B, Trapnell C, Pop M, Salzberg SL. Ultrafast and memory-efficient alignment of short DNA sequences to the human genome. Genome Biol. 2009;10(3):R25. doi: 10.1186/gb-2009-10-3-r25. [DOI] [PMC free article] [PubMed] [Google Scholar]
- 65.Trapnell C, et al. Differential gene and transcript expression analysis of RNA-seq experiments with TopHat and Cufflinks. Nat Protoc. 2012;7(3):562–578. doi: 10.1038/nprot.2012.016. [DOI] [PMC free article] [PubMed] [Google Scholar]
- 66.Saldanha AJ. Java Treeview--extensible visualization of microarray data. Bioinformatics. 2004;20(17):3246–3248. doi: 10.1093/bioinformatics/bth349. [DOI] [PubMed] [Google Scholar]
- 67.Chang CH, et al. Mammary stem cells and tumor-initiating cells are more resistant to apoptosis and exhibit increased DNA repair activity in response to DNA damage. Stem Cell Rep. 2015;5(3):378–391. doi: 10.1016/j.stemcr.2015.07.009. [DOI] [PMC free article] [PubMed] [Google Scholar]
- 68.Grubb RL, et al. Pathway biomarker profiling of localized and metastatic human prostate cancer reveal metastatic and prognostic signatures. J Proteome Res. 2009;8(6):3044–3054. doi: 10.1021/pr8009337. [DOI] [PMC free article] [PubMed] [Google Scholar]
- 69.Wang Q, et al. Androgen receptor regulates a distinct transcription program in androgen-independent prostate cancer. Cell. 2009;138(2):245–256. doi: 10.1016/j.cell.2009.04.056. [DOI] [PMC free article] [PubMed] [Google Scholar]
- 70.Feng J, Liu T, Qin B, Zhang Y, Liu XS. Identifying ChIP-seq enrichment using MACS. Nat Protoc. 2012;7(9):1728–1740. doi: 10.1038/nprot.2012.101. [DOI] [PMC free article] [PubMed] [Google Scholar]
- 71.Creighton CJ, et al. Proteomic and transcriptomic profiling reveals a link between the PI3K pathway and lower estrogen-receptor (ER) levels and activity in ER+ breast cancer. Breast Cancer Res. 2010;12(3):R40. doi: 10.1186/bcr2594. [DOI] [PMC free article] [PubMed] [Google Scholar]
- 72.Shin H, Liu T, Manrai AK, Liu XS. CEAS: Cis-regulatory element annotation system. Bioinformatics. 2009;25(19):2605–2606. doi: 10.1093/bioinformatics/btp479. [DOI] [PubMed] [Google Scholar]
- 73.Harvey JM, Clark GM, Osborne CK, Allred DC. Estrogen receptor status by immunohistochemistry is superior to the ligand-binding assay for predicting response to adjuvant endocrine therapy in breast cancer. J Clin Oncol. 1999;17(5):1474–1481. doi: 10.1200/JCO.1999.17.5.1474. [DOI] [PubMed] [Google Scholar]
Associated Data
This section collects any data citations, data availability statements, or supplementary materials included in this article.


