

Introduction
Bipolar disorders are debilitating psychiatric disorders estimated to affect between 2 and 5% of the population (Merikangas et al., 2007). These disorders are characterized by emotional dysregulation and the appearance of persistent pathological mood states of depression and mania. While the variable manifestations of bipolar disorder have been described since antiquity, a recent body of scientific inquiry seeks to define the underlying changes in neural activity associated with different mood states. These studies have revealed alterations in neural activity during task based emotion and reward processing (Phillips and Swartz, 2014; Strakowski et al., 2012)). Are these disorders reflected in a disruption of neural circuits involved in these functions? A growing consensus of research suggests that this is the case. In a consensus model of the neuroanatomy of bipolar disorder, “bipolar I disorder arises from abnormalities in the structure and function of key emotional control networks in the human brain” (Strakowski et al., 2012). Most of the data informing this model is drawn from studies comparing bipolar subjects to other populations. Very few neuroimaging studies have directly compared functional connectivity in different mood states in bipolar disorder, leaving the nature of state versus trait abnormalities in neural circuitry unclear(Chen et al., 2011; Townsend and Altshuler, 2012). In this manuscript we examine how different mood states in bipolar disorder are reflected in changes in neural circuitry.
We sought to test the hypothesis that compared to the euthymic state, the manic state is associated with a disruption of neural circuit connectivity between cortical and subcortical regions. This disruption could impair the control of subcortical regions by frontal cortical structures, giving rise to autonomous activity in structures such as the amygdala, possibly resulting in the dysregulated and persistent abnormal emotions observed in bipolar mania.
In this experiment we used resting state functional magnetic resonance imaging to examine spontaneous neural activity in subjects with bipolar disorder type I in a manic state, subjects with bipolar disorder type I in a euthymic state, and matched healthy comparison (HC) subjects. Using existing models of the pathogenesis of bipolar disorder (Phillips et al., 2008; Strakowski et al., 2012), we examined subcortical structures implicated in emotion generation and reward seeking behavior (the amygdala and ventral striatum) and cortical structures thought to exert top-down control over these subcortical regions (the anterior cingulate cortex (ACC), orbitofrontal cortex (OFC), and ventrolateral prefrontal cortex (VLPFC)). We chose to measure whole brain connectivity to these ROIs rather than confining our analysis to between-ROI connectivity for the following reasons: First, we believe that differences detected under a more statistically stringent whole brain analysis will be more significant and more likely to be replicable. Second, while there are existing consensus models of the neuroanatomy of bipolar disorder, we are not aware of broadly accepted models of the neuroanatomy / circuit differences between states in bipolar disorder. We therefore used the identified regions as a starting point (ROIs) but chose to examine connectivity across the entire brain. We hypothesized that we would observe a loss of functional connectivity between cortical and subcortical structures in mania when compared to euthymia. We base this on the hypothesis that the behavioral manifestations of bipolar mania such as emotional lability and reward seeking / appetitive behaviors may be reflected in altered dynamics between subcortical structures implicated in these behaviors and the cortical structures implicated in the regulation of these behaviors. If this hypothesis were correct, we would expect the normal pattern of correlations or anticorrelations between these structures observed in bipolar euthymia to be altered in bipolar mania.
Methods
Participants
The study was approved by the McLean Hospital Institutional Review Board, and all participants gave written informed consent before participating. To ensure that participants understood the study, we conducted an informed consent survey, including simple questions about risks and benefits and the ability to withdraw consent. If the participants did not answer all questions correctly, the informed consent document was re-reviewed and understanding retested to ensure comprehension. Bipolar subjects in a manic state were mainly recruited from McLean Hospital inpatient units, as in our previous studies (Ongur et al., 2010). Bipolar subjects in a euthymic state were primarily recruited from McLean inpatient units and returned to participate in the study as outpatients.
Diagnosis was determined using the Structured Clinical Interview for the DSM-IV (SCID)(First and New York State Psychiatric Institute. Biometrics Research, 2007). Patients were assessed by trained research staff. We carried out monthly reliability exercises where a study subject was interviewed in the presence of the research team. Each rater assessed the subject independently. Reliability was measured by the fraction of raters who showed perfect agreement on a specific measure. Rates of agreement were perfect (1.0) for SCID diagnoses, near-perfect for current mood episodes (1.0 for major depression, 0.93 for mania). For the bipolar subject groups, group assignment was made using DSM-IVTR criteria. All subjects in the mania group met DSM-IVTR criteria for the diagnosis of bipolar disorder type I and met criteria for current manic episode. All subjects in the euthymia group met DSM-IVTR criteria for the diagnosis of bipolar disorder type I but did not meet criteria for any current mood episode.
Exclusion criteria included age outside the range of 18–65, any neurological illness, positive pregnancy test or lactation, electroconvulsive therapy in the last three months, history of head trauma with a loss of consciousness lasting more than a few minutes, and contraindications to magnetic resonance imaging.
28 subjects diagnosed with bipolar disorder I, currently manic, 24 subjects with bipolar disorder I, currently euthymic, and 23 HC subjects participated in the study. Demographic, clinical, and medication regimen information are summarized in Table 1.Of the subjects in the bipolar mania group most (25 of 28) were hospitalized for a manic episode when they participated in this study. 26 of 28 subjects had a YMRS of 20 or more. The 24 subjects in the euthymic group were all in outpatient treatment when they participated in the study. Almost all of the euthymic bipolar subjects (23 of 24) had a previous history of hospitalization and the median time since last hospitalization was 6.5 months. All euthymic subjects were euthymic for at least one full month before participation in this study and all had a YMRS of less than 12. Subjects were assessed using the SCID, Young Mania Rating Scale (YMRS), Montgomery–Asberg Depression Rating Scale (MADRS), and Positive And Negative Syndrome Scale (PANSS) on the day of the study. HC subjects were assessed using the SCID.
Table 1.
Detailed demographics, clinical, and medication information of the study population.
| Bipolar-Manic Subjects (n=28) | Bipolar- Euthymic Subjects (n=24) | Healthy Control Subjects (n=23) | Statistic | |||
|---|---|---|---|---|---|---|
| Demographics | Control vs Mania | Mania vs Euthymia | Euthymia vs Control | |||
| Age in years, mean (SD) | 27.5 (10.7) | 30.9 (11.9) | 29.7 (10.9) | MW p=.174 | MW p=.060 | MW p=.840 |
| Sex | df=1 χ2=.021 p=.884 | df=1 χ2=.138 p=.711 | df=1 χ2=.045 p=.831 | |||
| male | 20 | 16 | 16 | |||
| female | 8 | 8 | 7 | |||
| Clinical Characteristics | ||||||
| YMRS, mean (SD) | 25.8 (7.28) | 2.33 (3.40) | n/a | MW p<.001 | ||
| MADRS, mean (SD) | 12.0 (6.41) | 5.33 (5.46) | n/a | MW p<.001 | ||
| PANSS, mean (SD) | 59.0 (10.9) | 38.6 (8.11) | n/a | MW p<.001 | ||
| PANSS positive subscale, mean (SD) | 22.2 (5.60) | 9.33 (4.24) | n/a | MW p<.001 | ||
| Anticonvulsants | 11/28 | 9/24 | n/a | df=1 χ2= .017 p=.895 | ||
| Antipsychotics | 27/28 | 15/24 | n/a | df=1 χ2=9.58 p=.002 | ||
| CPZ equivalents, mean (SD) | 368 (252) | 143 (200) | n/a | MW p<0.001 | ||
| Benzodiazepines | 8/28 | 4/24 | n/a | df=1 χ2=1.03 p=.310 | ||
| Lithium | 21/28 | 16/24 | n/a | df=1 χ2= .437 p=.508 | ||
| Antidepressants | 0/28 | 1/24 | n/a | df=1 χ2=1.19 p=.275 | ||
| framewise displacement in mm, mean (SD) | .149 (.074) | .133 (.051) | .121 (.071) | t(81) = 1.78 p=.078 | t(79)= .587 p=.559 | t(84) = 1.47 p=.152 |
Abbreviations: MW Mann-Whitney U Test, PANSS: Positive And Negative Symptom Scale, SD: Standard Deviation, YMRS: Young Mania Rating Scale.
Clinical characteristics
Subject groups were compared for demographic and, where applicable, clinical characteristics such as age, sex, symptom scale scores (YMRS, PANSS, PANSS positive subscale), the presence or absence of categories of medications prescribed (e.g. anticonvulsants) and prescribed antipsychotic dose (in chlorpromazine equivalents). For all subject’s scans, the framewise displacement (FD) between TRs was calculated as in Power et al. (Power et al., 2012) and the mean FD for each subject was entered into comparisons across subject groups.
Repeated Shapiro-Wilk tests for normality revealed that on clinical measures (YMRS, PANSS, PANSS positive subscale) the euthymic group demonstrated a non-normal distribution of values skewed towards low values on these measures. For comparisons on these measures, the non-parametric Mann-Whitney U test was used
MRI data acquisition
Data were acquired on a 3T Siemens scanner using a standard 12-channel head coil. The echoplanar imaging parameters were as follows: repetition time = 3000 milliseconds; echo time = 30 milliseconds; flip angle = 85°; 3 × 3 × 3-mm voxels; field of view, 216; and 47 axial sections collected with interleaved acquisition and no gap. Structural data included a high-resolution, multiecho, T1-weighted, magnetization-prepared, gradient-echo image. All participants underwent two resting fMRI runs with the instructions ‘remain still, stay awake, and keep your eyes open’. Video recording was used to confirm the awake, eye-open state. Each functional run lasted 6.2 minutes (124 time points).
MRI data processing
The imaging data were preprocessed using the Data Processing Assistant for Resting-State fMRI (DPARSF(Chao-Gan and Yu-Feng, 2010), http://www.restfmri.net). To minimize effects of scanner signal stabilization, the first four images were omitted from all analysis. The remaining volumes were realigned and slice timing corrected to the middle slice. Participants with head motion exceeding 2mm in any dimension or 20 of maximum rotation about three axes through the resting-state run were discarded from further analysis. This step resulted in a total of 43 analyzed runs from 28 bipolar-manic subjects, 46 analyzed runs from 24 bipolar- euthymic subjects, and 40 analyzed runs from 23 HC subjects. Functional and structural images were co-registered. After the steps of realigning, slice timing correction, and co-registration, FD was calculated for all resting state volumes. All volumes with a FD greater than 0.2mm were regressed out during nuisance covariate regression. Structural images from each subject were then normalized and segmented into gray, white and CSF partitions using the Diffeomorphic Anatomical Registration Through Exponentiated Lie algebra (DARTEL) technique(Ashburner, 2007). The CSF and white matter partitions generated during the segmentation process are later used as regions of interest to extract the corresponding signals for nuisance covariate regression. To remove head motion effects, a Friston 24-parameter model(Friston et al., 1996) was used to regress out head motion effects from the realigned data (i.e., 6 head motion parameters, 6 head motion parameters one time point before, and the 12 corresponding squared items). The CSF and white matter signals, global mean signal as well as the linear trend were also regressed as nuisance covariates. After nuisance covariate regression the resultant data were band pass filtered to select low frequency (0.01-0.08Hz) signals. Normalization parameters were then applied to the co-registered functional images to bring them into a common DARTEL-MNI (Montreal Neurological Institute) space and then smoothed by a Gaussian kernel of 8mm3 full-width at half maximum (FWHM). Voxels within a group derived gray matter mask were used for further analyses.
The preprocessing methods described here are chosen to both allow comparison to existing literature on functional connectivity in bipolar disorder as well as to remove the effects of head motion given the known effects of movement on connectivity measures (Craddock et al., 2013; Power et al., 2012; Power et al., 2014). As significant disagreement remains in the field about how preprocessing alters physiologic signals(Gotts et al., 2013), we present results after alternative preprocessing steps in Supplementary Materials.
Functional Connectivity Analysis
To identify mood state related changes in functional connectivity (FC), seed regions were chosen based on consensus findings from existing research literature. We initially chose a total of six regions of interest (ROIs): bilateral amygdala, bilateral ventral striatum, ACC, bilateral OFC, right VLPFC and left VLPFC. We subsequently added two additional ROIs for the right and left amygdala individually. The amygdala seeds were generated using Wake Forest University Pickatlas software (WFU Pickatlas, version 3.0.5)(Maldjian et al., 2003). The ventral striatum seed was generated from an existing parcellation of the striatum (Choi et al., 2012). The ACC seed was chosen based on previous literature on ACC connectivity in bipolar disorder: a 9mm radius sphere centered on MNI coordinates (x2 y37 z-1) (Anticevic et al., 2015). The right VLPFC seed was also derived from previous literature on connectivity in bipolar disorder: a 10mm radius sphere centered on MNI coordinates (x40 y20 z-4) (Chai et al., 2011). The left VLPFC seed was a 10mm radius sphere placed at a similar position in the left hemisphere (x-40 y 20 z-4). The OFC seed was generated using the BA11 mask from WFUPickatlas. The time course of voxels in these seed regions were extracted and Pearson correlation coefficients between this timecourse and those of all other voxels were calculated. These values were transformed to Fisher’s z scores to generate maps of functional connectivity.
Statistical Analyses
For each ROI we performed a one-way ANCOVA using statistical parametric mapping (SPM8, http://www.fil.ion.ucl.ac.uk/spm) to compare whole brain functional connectivity across groups with age and gender as covariates of no interest. The threshold for cluster level significance was determined using Monte Carlo simulation using AlphaSim as implemented in REST(Song et al., 2011).
To control for multiple comparisons, only groups of voxels with a cluster-level significance of p <.006 (k=30 voxels, alpha <.05 corrected for a total of eight different ANCOVA comparisons) were considered significant and reported.
Post-Hoc two –sample T- contrasts were then performed using SPM8 to examine differences in FC between groups. Age and sex covariates were regressed from the T-Tests as nuisance variables. T-contrasts were performed within clusters found to be significant in the across group ANCOVA.
The resulting contrast maps were thresholded for voxels with a P value < .001.
To control for multiple comparisons, only groups of voxels with a cluster-level significance of p = .001 (k=34 voxels, alpha <.05 corrected for 48 comparisons: 8 across group × 3 between group × 2 to reflect the one-tailed nature of SPM t-test comparisons) were considered significant and reported.
For significant between-group results, we performed an additional T-contrast including mean framewise displacement (FD) for each run as an additional covariate as suggested by Yan et al. (Yan et al., 2013) as an additional control for movement related effects at the individual level (detailed in Supplementary Materials).
For significant between group results, we also performed an additional T-contrast comparing groups using data that had been preprocessed as described above but without global signal regression.
As the comparison of group demographic and clinical values revealed a significant difference in antipsychotic medication dosage, we examined the relationship between functional connectivity and medication dosage. For each ROI, the zFC maps for all bipolar subjects (both manic and euthymic) were entered into a second-level analysis in SPM8 using multiple regression with chlorpromazine as a covariate to generate maps of how whole brain zFC to identified ROIs varies with prescribed antipsychotic dose. These maps were then compared to clusters of significant between group (mania vs. euthymia) differences in FC.
Figure construction
Figures were constructed using SPM8.
Results
Table 1 lists demographic and clinical characteristics of the study population. Manic subjects were significantly more symptomatic than euthymic subjects on all symptoms scales. All subjects in both the mania and euthymia groups were taking medication. All of the antipsychotics prescribed in both groups were second generation antipsychotics. Subjects in the manic group were significantly more likely to be prescribed antipsychotics and were more likely to be prescribed a higher dose of antipsychotic (chlorpromazine (CPZ) equivalents) . The two bipolar subject groups did not differ in prevalence of lithium, anti-epileptic drugs or anti-depressants or a benzodiazepine in their medication regimens. We calculated the mean framewise displacement (FD) between TRs for each subject using the method of Power et al(Power et al., 2012). The manic group had a higher mean FD than the euthymic group or HC subjects but there were no significant differences in FD between groups.
We examined whole-brain connectivity to seed regions drawn from existing anatomical models of affect regulation, affect perception and reward seeking behavior in bipolar disorder (Phillips and Swartz, 2014; Strakowski et al., 2012). The functional connectivity between these ROIs and the whole brain were calculated. Areas of significant differences in FC across groups (mania, euthymia, and HC) for each seed ROI are detailed in Table 2. Significant differences in FC were observed for the bilateral amygdala ROI, the ACC ROI, the Left VLPFC ROI and the OFC ROI. No areas of significant across group differences were detected for the Right VLPFC or ventral striatum. Given the significant across group differences in bilateral amygdala connectivity, we re-performed this analysis using the right and left amygdala as individual ROIs.
Table 2.
ROIs demonstrating significant differences in whole-brain connectivity across groups.
| Seed Region | Area | Coordinates | F (2,124) | Cluster size (voxels) | Cluster size p-value |
|---|---|---|---|---|---|
| Amygdala (bilateral) | |||||
| BA6 (Left) | x-36 y-9 z57 | 13.79 | 54 | <.001 | |
| ACC | x6 y48 z3 | 13.71 | 181 | <.001 | |
| BA5 (right) | x18 y-45 z69 | 12.95 | 108 | <.001 | |
| BA6 (right) | x30 y-6 z54 | 11.98 | 106 | <.001 | |
| CBM (left) | x-45 y-54 z-39 | 11.54 | 44 | <.001 | |
| BA5 (left) | x-21 y-48 z66 | 10.74 | 45 | <.001 | |
| Ventral Striatum | |||||
| n/a | |||||
| ACC | |||||
| right amygdala | x18 y-3 z-21 | 11.56 | 38 | <.001 | |
| Right VLPFC | |||||
| n/a | |||||
| Left VLPFC | CBM (right) | x33 y-69 z-18 | 10.67 | 37 | <.001 |
| BA20 (right ITG) | x60 y-9 z-39 | 10.41 | 30 | 0.006 | |
| Orbitofrontal Cortex | |||||
| CBM (midline) | x0 y-57 z-21 | 12.44 | 106 | <.001 | |
| DLPFC (left) | x-39 y21 z30 | 11.75 | 36 | <.001 | |
| BA18 (left) | x-3 y-96 z-21 | 11.6 | 54 | <.001 | |
| Amygdala (right) | ACC | x6 y48 z3 | 14.13 | 187 | <.001 |
| BA6 (right) | x27 y-6 z51 | 12.58 | 72 | <.001 | |
| CBM (left) | x-48 y-54 z-42 | 12.43 | 37 | <.001 | |
| BA5 (right) | x18 y-45 z69 | 11.79 | 62 | <.001 | |
| MTG (right) | x60 y-21 z-12 | 11.76 | 34 | 0.001 | |
| BA6 (Left) | x-33 y-9 z57 | 11.02 | 35 | <.001 | |
| BA39 (right) | x54 y-63 z21 | 9.73 | 34 | 0.001 | |
| Amygdala (left) | BA6 (left) | x-36 y-9 z57 | 12.92 | 42 | <.001 |
| BA5 (right) | x21 y-48 z69 | 10.54 | 34 | 0.001 | |
| ACC | x3 y48 z6 | 10.23 | 59 | <.001 | |
Coordinates are in MNI (Montreal Neurological Institute) space. F is F-statistic at peak voxel within each cluster.
Abbreviations: ACC Anterior Cingulate Cortex, BA: Brodmann Area, CBM: Cerebellum, DLPFC: Dorsolateral Prefrontal Cortex, ITG: Inferior Temporal Gyrus, MTG: Medial Temporal Gyrus, OFC: Orbitofrontal Cortex, R: Right, SMA: Supplemental Motor Area, VLPFC: Ventro-Lateral Prefrontal Cortex
Post-hoc T-tests to determine the between-group differences (mania vs. euthymia, mania vs HC, euthymia vs HC) were performed and regions of significant differences in FC are detailed in Table 3.
Table 3.
ROIs demonstrating significant differences in whole-brain connectivity between groups.
| Seed Region | Change in Functional Connectivity | Area | Coordinates | T-stat | Cluster size (voxels) | Cluster size p-value | |
|---|---|---|---|---|---|---|---|
| Bilateral amygdala | |||||||
| mania v euthymia | |||||||
| Increased in mania | left SMA | x-36 y-9 z54 | 4.82 | 46 | <.001 | ||
| right SMA | x18 y3 z63 | 4.79 | 73 | <.001 | |||
| right BA5 | x21 y-48 z69 | 3.83 | 51 | <.001 | |||
| Increased in euthymia | ACC | x0 y39 z6 | 5.41 | 180 | <.001 | ||
| mania v HC | |||||||
| Increased in mania | left CBM | x-45 y-54 z-39 | 5.24 | 44 | <.001 | ||
| euthymia v HC | |||||||
| Increased in HC | right BA5 | x18 y-48 z69 | 5.12 | 105 | <.001 | ||
| left SMA | x-33 y-9 z57 | 4.22 | 42 | <.001 | |||
| right SMA | x48 y-6 z48 | 4.14 | 79 | <.001 | |||
| left BA5 | x-21 y-48 z66 | 3.9 | 43 | <.001 | |||
| ACC | |||||||
| mania v euthymia | |||||||
| Increased in euthymia | right amygdala | x18 y-3 z-21 | 5.32 | 38 | <.001 | ||
| left VLPFC | |||||||
| mania v euthymia | |||||||
| Increased in euthymia | right CBM | x33 y-69 z-18 | 4.34 | 36 | <.001 | ||
| OFC | |||||||
| mania v euthymia | |||||||
| Increased in mania | CBM (midline) | x3 y-60 z-21 | 4.04 | 52 | <.001 | ||
| Increased in euthymia | left BA18 | x-3 y-96 z-21 | 5.03 | 35 | <.001 | ||
| mania v HC | |||||||
| Increased in mania | CBM (midline) | x12 y-60 z-24 | 4.99 | 104 | <.001 | ||
| R Amygdala | |||||||
| mania v euthymia | |||||||
| Increased in mania | left SMA | x-36 y-9 z54 | 4.32 | 35 | <.001 | ||
| right SMA | x27 y-6 z51 | 4.3 | 46 | <.001 | |||
| Increased in euthymia | ACC | x0 y39 z6 | 5.87 | 187 | <.001 | ||
| mania v HC | |||||||
| Increased in mania | left CBM | x-45 y-54 z-39 | 5.04 | 44 | <.001 | ||
| euthymia v HC | |||||||
| Increased in HC | right BA5 | x18 y-45 z72 | 4.7 | 59 | <.001 | ||
| right SMA | x36 y-9 z45 | 4.16 | 63 | <.001 | |||
| L amygdala | |||||||
| mania v euthymia | |||||||
| Increased in euthymia | ACC | x-3 y45 z9 | 4.27 | 59 | <.001 |
Coordinates are in MNI (Montreal Neurological Institute) space.
Abbreviations: ACC Anterior Cingulate Cortex, BA: Brodmann Area, CBM: Cerebellum, DLPFC: Dorsolateral Prefrontal Cortex, ITG: Inferior Temporal Gyrus, MTG: Medial Temporal Gyrus, OFC: Orbitofrontal Cortex, R: Right, SMA: Supplemental Motor Area, VLPFC: Ventro-Lateral Prefrontal Cortex
Examining the bipolar-mania versus bipolar-euthymia comparisons in detail, we observe a significant decrease in connectivity between all amygdala ROIs and the pre-genual ACC (BA24 and BA32) in mania compared to euthymia. The extent and significance of the loss of FC in mania was greater for the right amygdala than the left (Figure 1A). Comparing Fisher’s Z transformed FC values demonstrates that this decrease in FC represents a loss of connectivity in mania from the correlated activity observed between these structures observed in euthymia and HC groups (Figure 1B). The HC group demonstrated functional connectivity intermediate between the bipolar-euthymia group and the bipolar-mania group. The mean zFC value in the HC group was greater than the bipolar euthymia group (P=.009) and was less than the bipolar-mania group (P=.012).
Figure 1. Whole-brain changes in functional connectivity to the right amygdala in bipolar mania compared to euthymia.
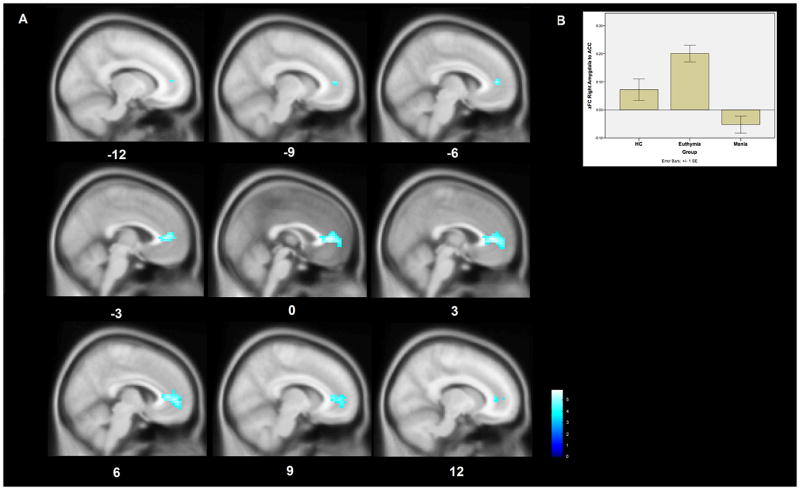
A. The right amygdala demonstrates decreased functional connectivity to the pregenual ACC in bipolar mania compared to bipolar euthymia. This region of significantly decreased connectivity is shown projected onto a MNI152 template brain at the x-12 to x12 levels. The color bar indicates T-statistic magnitude. I
B A bar chart of the average Fisher’s Z transformed functional connectivity values between the right amygdala ROI and the ACC cluster among the subjects within each group. Error bars represent standard errors.
The right amygdala also demonstrated significantly increased functional connectivity to the bilateral BA6 / Supplemental Motor Area (SMA) in the frontal cortex in mania compared to euthymia. This change represents a reversal of the anticorrelation between these regions observed in the euthymia group.
The ACC ROI demonstrated significantly deceased functional connectivity to the right amygdala in mania when compared to euthymia (Figure 3A). This reflects a loss of the functional connectivity observed between these regions in the euthymic and HC groups (Figure 3B).
Figure 3. Whole-brain differences in functional connectivity to the anterior cingulate cortex in bipolar mania compared to euthymia.
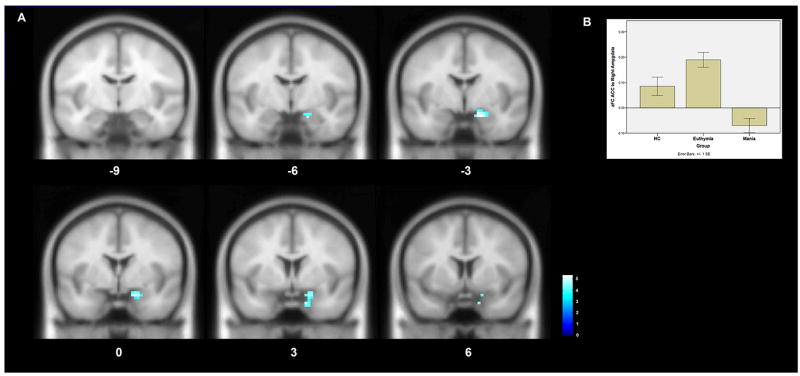
A An ROI placed in the anterior cingulate cortex demonstrates decreased functional connectivity to the right amygdala in bipolar mania compared to bipolar euthymia. This region of significantly decreased connectivity is shown projected onto a MNI152 template brain at the y6 to y-9 levels. The color bar indicates T-statistic magnitude.
B A bar chart of the average Fisher’s Z transformed functional connectivity values between the ACC ROI and the right amygdala cluster among the subjects within each group. Error bars represent standard errors.
To further control against the possibility that these observed differences could be due to motion artifact, we re-performed all significant between-group T-tests with the mean FD for each scan as an additional covariate. These results are detailed in Supplementary Table 1. All of the differences in amygdala ROI and ACC ROI connectivity detailed above remained significant even with this control for movement effects.
Given ongoing controversy about the role of global signal regression in fMRI analysis, we re-performed all between group comparisons on data that was preprocessed as detailed in the methods section with the exception of removing the global signal regression step. These results are presented in supplementary materials and Supplementary Table 2. While GSR does affect the extent and significance of observed functional connectivity results, the results described above between the right amygdala and ACC and SMA are observed under both data preprocessing conditions.
To control for potential effects of antipsychotic medication dosage differences between bipolar patient groups, we examined the relationship between functional connectivity and medication dosage. We performed a whole-brain regression between the prescribed chlorpromazine dose and resting state FC for all ROIs across all bipolar subjects (both manic and euthymic). These maps were then compared to clusters of significant between group (mania vs. euthymia) differences in FC. There were no areas overlap between CPZE related connectivity changes and mood state related connectivity changes between the amygdala and ACC or SMA.
Although we did not observe significant differences in medication prescription for other classes of medications between bipolar groups, it remains possible that medication regimen differences contribute to the between group differences observed. As a further control against the possibility that prescribed medications may be contributing to the between group difference, we re-performed all of the analyses that revealed significant between bipolar group differences using all classes of medications as individual covariates. This analysis (described in Supplementary Methods and reported in Supplementary Results and Supplementary Table 3) continued to reveal the same pattern of highly significant alterations in amygdala-ACC and amygdala- SMA functional connectivity.
Discussion
To our knowledge this is the first study comparing resting-state functional connectivity in bipolar mania to bipolar euthymia. Using existing models of pathophysiology in bipolar disorder we have tested the hypothesis that mood state may be associated with specific patterns of spontaneous neural activity and more specifically, a loss of functional connectivity between cortical regions thought to provide “top down” regulation of emotion and their limbic region targets. Consistent with that hypothesis, measuring intrinsic connectivity during resting state conditions reveals a disruption in neural circuits of emotion regulation in mania.
We observe that bipolar mania is associated with decreased connectivity between the pre-genual anterior cingulate cortex and amygdala. This result is consistent with proposed models of emotional dysregulation in bipolar disorder and extends these models to suggest that the substantive impairment in emotion regulation in mania may be reflected in a further dysfunction of circuits of emotion regulation that may be altered at baseline (Phillips et al., 2008; Strakowski et al., 2012). It is notable that the HC group lies intermediate between bipolar euthymia and bipolar mania in terms of the functional connectivity between the ACC and amygdala. This suggests that first, euthymia in bipolar disorder is not a state of normalcy but rather a state of compensation associated with abnormal brain activity in specific brain regions and second, that mania is associated with the loss of that compensation.
These results also demonstrate an increase in functional connectivity between the SMA /BA6 and the amygdala during mania. This finding represents an extension of existing models of emotion regulation in bipolar disorder but is entirely consistent with studies identifying activation in this region during emotion regulation tasks (Ochsner et al., 2002). Increased activity in this area during an emotion regulation task is negatively coupled with amygdala activity in healthy adults (Kanske et al., 2011). Our observed result of increased coupling between these areas in mania (vs euthymia) may be interpreted as a loss of healthy negative coupling reflecting disruption of an important emotion regulation circuit. We attempted
The observed changes in connectivity are lateralized with the right amygdala demonstrating the most significant decreases in functional connectivity as a product of mood state. This finding is consistent with results from other neuroimaging studies suggesting a right amygdala specific role in emotion regulation in healthy subjects (Uchida et al., 2015) . In bipolar disorder, a previous study comparing task related connectivity in bipolar mixed or manic states to the depressed state demonstrated changes in amygdala connectivity selectively in the right amygdala (Cerullo et al., 2012).
Notable in our results were a lack of significant functional connectivity differences to the ventral striatum between mood states. Is this consistent with existing literature? To date, neuroimaging studies of reward processing in bipolar disorder have compared bipolar subjects in one clinical state to healthy controls or other patients with other psychiatric disorders. These studies do show abnormalities in ventral striatum responses to reward in bipolar mania (Abler et al., 2008) but abnormalities in ventral striatum activity in reward anticipation are also observed in euthymia (Nusslock et al., 2012) as well as in high-risk healthy offspring of subjects with bipolar disorder (Singh et al., 2014). It remains a real possibility that state related differences in reward seeking in bipolar disorder are not reflected by significant changes in reward circuitry compared to bipolar trait related differences. An alternative explanation is that the threshold for statistical significance used here was too high, resulting in Type II error.
Limitations
Methodological limitations of the current study include the following: In a comparison of mood states in which one state (mania) is identified with motor hyperactivity, movement artifacts are a potential confound. We have attempted to minimize the effects of movement through a combination of procedures at both the group and individual level. These procedures have been shown effective in removing spurious motion effects (Power et al., 2014; Yan et al., 2013). Another potential limitation of this study is medication effects. While all bipolar subjects were prescribed medications, the use of atypical antipsychotics varied significantly between states. We did not observe a significant relationship between prescribed antipsychotic dose and functional connectivity in any of the regions observed to differ in FC between mania and euthymia. The main findings of mood state related differences between bipolar groups remained even after attempting to control for the presence of all classes of psychotropic medications. Furthermore, the pattern of FC differences observed here demonstrate that the unmedicated HC population shows connectivity intermediate between the two medicated bipolar groups, a result that seems entirely inconsistent with medication effect. Another potential confound is that all bipolar subjects in this study had a history of psychosis during manic episodes. While this is consistent with the finding that 88% of patients hospitalized for a first episode of mania had psychotic features(Tohen et al., 2003), there is evidence that brain connectivity differs between bipolar subjects with versus without a psychosis history(Anticevic et al., 2014). The results of this study may not be generalizable to subjects without a psychosis history. It also should be noted that the current study is comparing the manic state with its many different symptoms to the euthymic state. We cannot conclusively link the findings presented here to a particular manic symptom and our conclusion that these findings reflect the emotional component of mania (versus, say grandiose delusions or pressured speech) are inferences based on imaging literature linking the identified structures to emotion regulation. Lastly, patients were not each studied in each state. Rather, the group of euthymic subjects and manic subjects were different individuals. That said, such comparisons likely reduce the likelihood of seeing a real difference, due to the addition to inter-individual variance to state variance.
Despite these limitations, these results lend support to a neural circuit model of the pathophysiology of bipolar disorder in which the transition to a state of dysregulated mood (mania) is associated with changes in functional connectivity in circuits involved in emotion regulation. Do the changes we observe in euthymia reflect a distinct compensatory process or is this a state these circuits return to at the end of the active disease process that results in mania? We favor the former interpretation based on our observation that the functional changes in euthymia are opposite that of mania relative to controls. Ultimately, the data collected here represent individual timepoints in two phases of a complex, evolving system and either interpretation may be correct.
In this experiment we have attempted to focus our examination on state related differences in bipolar disorder. We have focused on a narrowly defined study population for the purposes of better elucidating state related changes. Future directions for this work include both narrowing the study population as well as expanding it. Specifically: 1) longitudinal studies of the same subjects across multiple mood states to further refine state versus trait differences and 2) expanding populations to include non-psychotic bipolar disorders and schizoaffective disorders in order to best delineate the neural circuit changes of mania from markers of bipolar disorder trait. If the changes observed are confirmed, they may suggest targets for therapeutic intervention, by cognitive, medication or electromagnetic means.
Supplementary Material
Figure 2. Whole-brain changes in functional connectivity to the right amygdala in bipolar mania compared to euthymia.
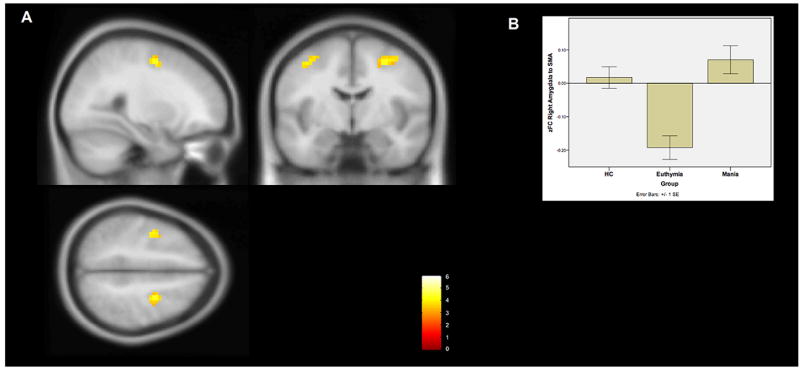
A The right amygdala demonstrates increased functional connectivity to the bilateral supplementary motor area (BA6) in bipolar mania compared to euthymia. This region of significantly increased connectivity is shown projected onto a MNI152 template brain at the x28, y-6, and z50 levels The color bar indicates T-statistic magnitude.
B A bar chart of the average Fisher’s Z transformed functional connectivity values between the right amygdala ROI and the combined BA6 clusters among the subjects within each group. Error bars represent standard errors.
References
- Abler B, Greenhouse I, Ongur D, Walter H, Heckers S. Abnormal reward system activation in mania. Neuropsychopharmacology. 2008;33:2217–2227. doi: 10.1038/sj.npp.1301620. [DOI] [PMC free article] [PubMed] [Google Scholar]
- Anticevic A, Savic A, Repovs G, Yang G, McKay DR, Sprooten E, Knowles EE, Krystal JH, Pearlson GD, Glahn DC. Ventral Anterior Cingulate Connectivity Distinguished Nonpsychotic Bipolar Illness from Psychotic Bipolar Disorder and Schizophrenia. Schizophrenia bulletin. 2014 doi: 10.1093/schbul/sbu051. [DOI] [PMC free article] [PubMed] [Google Scholar]
- Anticevic A, Savic A, Repovs G, Yang G, McKay DR, Sprooten E, Knowles EE, Krystal JH, Pearlson GD, Glahn DC. Ventral anterior cingulate connectivity distinguished nonpsychotic bipolar illness from psychotic bipolar disorder and schizophrenia. Schizophrenia bulletin. 2015;41:133–143. doi: 10.1093/schbul/sbu051. [DOI] [PMC free article] [PubMed] [Google Scholar]
- Ashburner J. A fast diffeomorphic image registration algorithm. Neuroimage. 2007;38:95–113. doi: 10.1016/j.neuroimage.2007.07.007. [DOI] [PubMed] [Google Scholar]
- Cerullo MA, Fleck DE, Eliassen JC, Smith MS, DelBello MP, Adler CM, Strakowski SM. A longitudinal functional connectivity analysis of the amygdala in bipolar I disorder across mood states. Bipolar Disord. 2012;14:175–184. doi: 10.1111/j.1399-5618.2012.01002.x. [DOI] [PMC free article] [PubMed] [Google Scholar]
- Chai XJ, Whitfield-Gabrieli S, Shinn AK, Gabrieli JD, Nieto Castanon A, McCarthy JM, Cohen BM, Ongur D. Abnormal medial prefrontal cortex resting-state connectivity in bipolar disorder and schizophrenia. Neuropsychopharmacology. 2011;36:2009–2017. doi: 10.1038/npp.2011.88. [DOI] [PMC free article] [PubMed] [Google Scholar]
- Chao-Gan Y, Yu-Feng Z. DPARSF: A MATLAB Toolbox for “Pipeline” Data Analysis of Resting-State fMRI. Front Syst Neurosci. 2010;4:13. doi: 10.3389/fnsys.2010.00013. [DOI] [PMC free article] [PubMed] [Google Scholar]
- Chen CH, Suckling J, Lennox BR, Ooi C, Bullmore ET. A quantitative meta-analysis of fMRI studies in bipolar disorder. Bipolar Disord. 2011;13:1–15. doi: 10.1111/j.1399-5618.2011.00893.x. [DOI] [PubMed] [Google Scholar]
- Choi EY, Yeo BT, Buckner RL. The organization of the human striatum estimated by intrinsic functional connectivity. J Neurophysiol. 2012;108:2242–2263. doi: 10.1152/jn.00270.2012. [DOI] [PMC free article] [PubMed] [Google Scholar]
- Craddock RC, Jbabdi S, Yan CG, Vogelstein JT, Castellanos FX, Di Martino A, Kelly C, Heberlein K, Colcombe S, Milham MP. Imaging human connectomes at the macroscale. Nature methods. 2013;10:524–539. doi: 10.1038/nmeth.2482. [DOI] [PMC free article] [PubMed] [Google Scholar]
- First MB New York State Psychiatric Institute. Biometrics Research, D. Structured clinical interview for DSM-IV-TR axis I disorders : SCID-I. Biometrics Research Dept., New York State Psychiatric Institutute; New York, N.Y: 2007. [Google Scholar]
- Friston KJ, Williams S, Howard R, Frackowiak RS, Turner R. Movement-related effects in fMRI time-series. Magn Reson Med. 1996;35:346–355. doi: 10.1002/mrm.1910350312. [DOI] [PubMed] [Google Scholar]
- Gotts SJ, Saad ZS, Jo HJ, Wallace GL, Cox RW, Martin A. The perils of global signal regression for group comparisons: a case study of Autism Spectrum Disorders. Front Hum Neurosci. 2013;7:356. doi: 10.3389/fnhum.2013.00356. [DOI] [PMC free article] [PubMed] [Google Scholar]
- Kanske P, Heissler J, Schonfelder S, Bongers A, Wessa M. How to regulate emotion? Neural networks for reappraisal and distraction. Cereb Cortex. 2011;21:1379–1388. doi: 10.1093/cercor/bhq216. [DOI] [PubMed] [Google Scholar]
- Maldjian JA, Laurienti PJ, Kraft RA, Burdette JH. An automated method for neuroanatomic and cytoarchitectonic atlas-based interrogation of fMRI data sets. Neuroimage. 2003;19:1233–1239. doi: 10.1016/s1053-8119(03)00169-1. [DOI] [PubMed] [Google Scholar]
- Merikangas KR, Akiskal HS, Angst J, Greenberg PE, Hirschfeld RM, Petukhova M, Kessler RC. Lifetime and 12-month prevalence of bipolar spectrum disorder in the National Comorbidity Survey replication. Arch Gen Psychiatry. 2007;64:543–552. doi: 10.1001/archpsyc.64.5.543. [DOI] [PMC free article] [PubMed] [Google Scholar]
- Nusslock R, Almeida JR, Forbes EE, Versace A, Frank E, Labarbara EJ, Klein CR, Phillips ML. Waiting to win: elevated striatal and orbitofrontal cortical activity during reward anticipation in euthymic bipolar disorder adults. Bipolar Disord. 2012;14:249–260. doi: 10.1111/j.1399-5618.2012.01012.x. [DOI] [PMC free article] [PubMed] [Google Scholar]
- Ochsner KN, Bunge SA, Gross JJ, Gabrieli JD. Rethinking feelings: an FMRI study of the cognitive regulation of emotion. J Cogn Neurosci. 2002;14:1215–1229. doi: 10.1162/089892902760807212. [DOI] [PubMed] [Google Scholar]
- Ongur D, Lundy M, Greenhouse I, Shinn AK, Menon V, Cohen BM, Renshaw PF. Default mode network abnormalities in bipolar disorder and schizophrenia. Psychiatry Res. 2010;183:59–68. doi: 10.1016/j.pscychresns.2010.04.008. [DOI] [PMC free article] [PubMed] [Google Scholar]
- Phillips ML, Ladouceur CD, Drevets WC. A neural model of voluntary and automatic emotion regulation: implications for understanding the pathophysiology and neurodevelopment of bipolar disorder. Mol Psychiatry. 2008;13:829, 833–857. doi: 10.1038/mp.2008.65. [DOI] [PMC free article] [PubMed] [Google Scholar]
- Phillips ML, Swartz HA. A critical appraisal of neuroimaging studies of bipolar disorder: toward a new conceptualization of underlying neural circuitry and a road map for future research. Am J Psychiatry. 2014;171:829–843. doi: 10.1176/appi.ajp.2014.13081008. [DOI] [PMC free article] [PubMed] [Google Scholar]
- Power JD, Barnes KA, Snyder AZ, Schlaggar BL, Petersen SE. Spurious but systematic correlations in functional connectivity MRI networks arise from subject motion. Neuroimage. 2012;59:2142–2154. doi: 10.1016/j.neuroimage.2011.10.018. [DOI] [PMC free article] [PubMed] [Google Scholar]
- Power JD, Mitra A, Laumann TO, Snyder AZ, Schlaggar BL, Petersen SE. Methods to detect, characterize, and remove motion artifact in resting state fMRI. Neuroimage. 2014;84:320–341. doi: 10.1016/j.neuroimage.2013.08.048. [DOI] [PMC free article] [PubMed] [Google Scholar]
- Singh MK, Kelley RG, Howe ME, Reiss AL, Gotlib IH, Chang KD. Reward processing in healthy offspring of parents with bipolar disorder. JAMA psychiatry. 2014;71:1148–1156. doi: 10.1001/jamapsychiatry.2014.1031. [DOI] [PubMed] [Google Scholar]
- Song XW, Dong ZY, Long XY, Li SF, Zuo XN, Zhu CZ, He Y, Yan CG, Zang YF. REST: a toolkit for resting-state functional magnetic resonance imaging data processing. PLoS One. 2011;6:e25031. doi: 10.1371/journal.pone.0025031. [DOI] [PMC free article] [PubMed] [Google Scholar]
- Strakowski SM, Adler CM, Almeida J, Altshuler LL, Blumberg HP, Chang KD, Delbello MP, Frangou S, McIntosh A, Phillips ML, Sussman JE, Townsend JD. The functional neuroanatomy of bipolar disorder: a consensus model. Bipolar Disord. 2012;14:313–325. doi: 10.1111/j.1399-5618.2012.01022.x. [DOI] [PMC free article] [PubMed] [Google Scholar]
- Tohen M, Zarate CA, Jr, Hennen J, Khalsa HM, Strakowski SM, Gebre-Medhin P, Salvatore P, Baldessarini RJ. The McLean-Harvard First-Episode Mania Study: prediction of recovery and first recurrence. Am J Psychiatry. 2003;160:2099–2107. doi: 10.1176/appi.ajp.160.12.2099. [DOI] [PubMed] [Google Scholar]
- Townsend J, Altshuler LL. Emotion processing and regulation in bipolar disorder: a review. Bipolar Disord. 2012;14:326–339. doi: 10.1111/j.1399-5618.2012.01021.x. [DOI] [PubMed] [Google Scholar]
- Uchida M, Biederman J, Gabrieli JD, Micco J, de Los Angeles C, Brown A, Kenworthy T, Kagan E, Whitfield-Gabrieli S. Emotion regulation ability varies in relation to intrinsic functional brain architecture. Soc Cogn Affect Neurosci. 2015 doi: 10.1093/scan/nsv059. [DOI] [PMC free article] [PubMed] [Google Scholar]
- Yan CG, Cheung B, Kelly C, Colcombe S, Craddock RC, Di Martino A, Li Q, Zuo XN, Castellanos FX, Milham MP. A comprehensive assessment of regional variation in the impact of head micromovements on functional connectomics. Neuroimage. 2013;76:183–201. doi: 10.1016/j.neuroimage.2013.03.004. [DOI] [PMC free article] [PubMed] [Google Scholar]
Associated Data
This section collects any data citations, data availability statements, or supplementary materials included in this article.