

Abstract
Toll-like receptors (TLRs) recognize pathogen-associated molecular patterns (PAMPs) and stimulate the innate immune response through the production of cytokines. The innate immune response depends on the timing of encountering PAMPs, suggesting a short-term “memory.” In particular, activation of TLR3 appears to prime macrophages for the subsequent activation of TLR7, which leads to synergistically increased production of cytokines. By developing a calibrated mathematical model for the kinetics of TLR3 and TLR7 pathway crosstalk and providing experimental validation, we demonstrated the involvement of the Janus-activated kinase (JAK)–signal transducer and activator of transcription (STAT) pathway in controlling the synergistic production of cytokines. Signaling through this pathway played a dual role: It mediated the synergistic production of cytokines, thus boosting the immune response, and it also maintained homeostasis to avoid an excessive inflammatory response. Thus, we propose that the JAK-STAT pathway provides a cytokine rheostat mechanism, which enables macrophages to fine-tune their responses to multiple, temporally separated infection events involving the TLR3 and TLR7 pathways.
INTRODUCTION
As frontline innate immune defense cells, macrophages use pattern recognition receptors (PRRs) to recognize foreign pathogens through their unique structures, which are known as pathogen-associated molecular patterns (PAMPs) (1). Toll-like receptors (TLRs) are the best-characterized PRRs (2, 3). TLR signaling stimulates different biological responses depending on the adaptor proteins involved, for example, myeloid differentiation primary response gene 88 (MyD88) and Toll–interleukin-1 receptor (IL-1R) domain–containing adaptor inducing interferon-β (IFN-β) (TRIF). MyD88 is recruited by all of the TLRs, except for TLR3, and it leads to the activation of the nuclear factor κB (NF-κB) and mitogen-activated protein kinase (MAPK) pathways mainly to produce inflammatory cytokines. On the other hand, TRIF is exclusively recruited by TLR3 and TLR4 mainly to activate IFN regulatory factor (IRF) family members, which then induce the expression of genes encoding the type I IFNs (3).
As the lingua franca used by both innate and adaptive immune cells, cytokines exert various local and distal effects, including the recruitment and activation of leukocytes. Deficient or excessive cytokine production may either cause ineffective immune protection or disrupt immune homeostasis. The invading pathogens often contain multiple PAMPs, and hence, it is highly likely that they interact with various TLRs simultaneously or at different stages of infection (4). Combinatorial activation of TLRs alters the extent of cytokine production and, in some cases, stimulates a synergistic increase in the amount of cytokines produced (5–11). Evidence indicates that synergistic production of cytokines depends on the order and timing of TLR stimulations. Specifically, the activation of TRIF-dependent signaling followed by the activation of MyD88-dependent signaling in macrophages generates a substantially stronger immune response compared to that generated when these pathways are stimulated in the reverse order (5, 12, 13). This observation suggests that the activation of the TRIF pathway could generate a short-term innate immune “memory” that could prime the cell for an enhanced response to a subsequent PAMP challenge. However, the mechanistic basis of this immune memory is unclear. It is also uncertain how host cells restore homeostasis after the cytokine “storm” that results from combinatorial stimulations. Therefore, there is a need for a systems-level understanding of the time-dependent mechanism of crosstalk between TLR pathways.
Previous efforts that used systematic approaches to study TLR signaling (14) made it possible to construct a comprehensive map of the TLR signaling network from existing data in the literature (15); however, this provided a static visualization of the protein-protein interaction network implicated in TLR signaling. To assess the dynamics of this network, the TLR map has been reformulated to enable a steady state–based flux balance analysis (16). However, the lack of detailed information on the reaction kinetics hindered the use of the map for richer quantitative studies. Earlier efforts on the quantitative modeling of specific TLR pathways have focused on the TLR3 and TLR4 pathways (17, 18), with special emphasis on the NF-κB signaling module (18–25). Although these models elucidated various aspects of TLR signaling, their use has been limited by oversimplification due to the imposition of linear dynamics (17, 23), the lack of model calibration (18), and the exclusion of key interactions, such as activator protein 1 (AP-1) activation and cytokine production (19–22, 24, 25). None of these models took into account the dynamic crosstalk between the different TLR pathways, which appears to be crucial for understanding the regulation of synergistic cytokine production.
Here, we focused on the interplay between the TLR3 and TLR7 pathways to uncover the main mechanism responsible for the generation of innate immune memory and the synergistic production of cytokines while maintaining homeostasis. We constructed a computational model containing the key components and determined the model parameters by an optimal fit to 148 data points through a statistical logic-based parameter estimation framework that we had developed previously (26). The calibrated model was verified to reproduce the dependence of the synergistic production of cytokines on the time interval and order of stimuli, as well as 39 additional data points reserved for model validation. Our subsequent model analysis indicated the crucial role of the MAPK and signal transducer and activator of transcription (STAT) pathways in regulating synergistic cytokine production. In particular, we found that c-Jun N-terminal kinase (JNK) activity increased the synergistic production of cytokines, whereas extracellular signal–regulated kinase (ERK) and p38 activity mainly decreased this synergy, possibly through stimulating production of the anti-inflammatory cytokine IL-10. Furthermore, we determined that the Janus-activated kinase (JAK)–STAT pathway was responsible for time-dependent synergy of the antiviral immune response. We found that the cytokine response to STAT1 was biphasic because of the opposing effects of STAT1 on cytokine production, which were achieved through an incoherent type 1 feedforward loop (I1-FFL), a network motif noted by Hart and Alon (27). Consequently, STAT1 appears to be indispensable for generating an innate immune memory that boosts the amounts of cytokines produced by macrophages and even leads to a cytokine storm in response to successive challenge with PAMPs through the activation arm of the FFL while restoring homeostasis by reducing cytokine production through the inhibitory arm of the FFL.
RESULTS
Synergistic cytokine production by macrophages is dependent on the order in which TLR3 and TLR7 are activated and the intervening time between both stimuli
Combinatorial activation of TLR3 and TLR7 through simultaneous challenge by their respective ligands, the double-stranded RNA (dsRNA) analog poly(I:C) and the single-stranded RNA (ssRNA) analog R848 (5), leads to the statistically significant increased expression of genes encoding proinflammatory cytokines, including those encoding IL-6 (Il6) and the IL-12 β chain (Il12b) (5, 28). To understand the underlying mechanisms, we first examined the time-dependent expression profiles of Il6 and Il12b mRNAs after the exposure of macrophages to poly(I:C) (sometimes denoted as the “I” condition) and R848 (sometimes denoted as the “R” condition) (Fig. 1A). To this end, bone marrow–derived macrophages (BMDMs) from BALB/c mice were treated with poly(I:C) and R848, but in different orders and with a different time interval (Δt; 0, 8, or 24 hours) between both treatments. Cells were collected for quantitative real-time polymerase chain reaction (qRT-PCR) analysis at 4, 8, 16, or 24 hours after the second treatment. The control for combinatorial stimulation was single stimulation of the cells with either poly(I:C) or R848.
Fig. 1. Characterization of cytokine mRNA expression profiles after coactivation of TLR3 and TLR7.
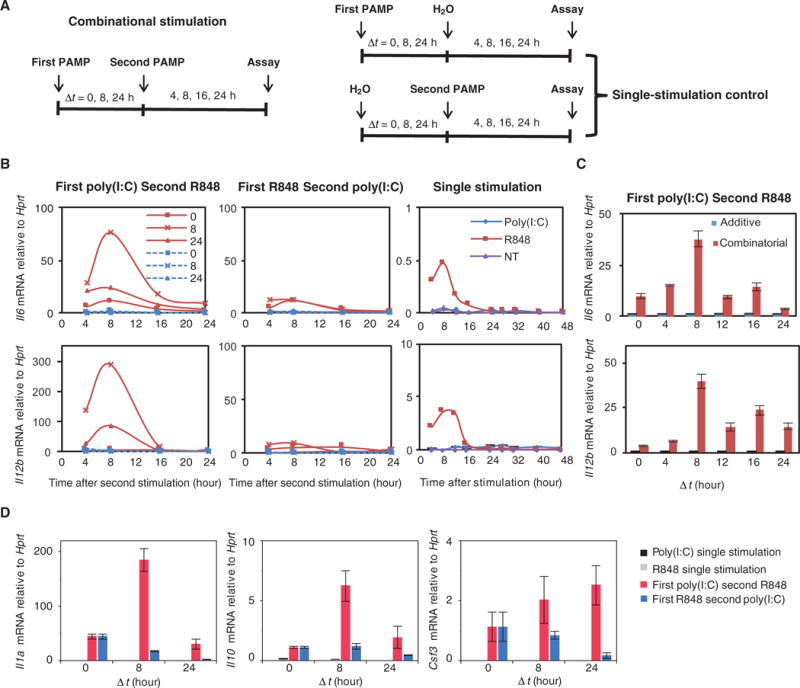
(A) Experimental design. BMDMs were treated with the first PAMP for 0, 8, or 24 hours and then were treated with the second PAMP for 4, 8, 16, or 24 hours. The controls for combined stimulation were stimulation with a single PAMP. (B) BMDMs were not treated (NT) or were treated with poly(I:C) (10 μg/ml) followed by R848 (25 ng/ml) (left), with R848 followed by poly(I:C) (middle), or with single PAMPs for the indicated times. The relative abundances of Il6 and Il12b mRNAs were then determined by qRT-PCR analysis. Data are representative of three independent experiments. Time intervals between the poly(I:C) and R848 treatments were 0 (■), 8 (×), and 24 (Δ) hours. Solid red curves show combinatorial stimulations, whereas dashed blue curves indicate additive controls as described in (A). (C) BMDMs treated with poly(I:C) for 0, 4, 8, 12, 16, or 24 hours and then with R848 for 8 hours were analyzed by qRT-PCR to determine the abundances of Il6 and Il12b mRNAs normalized to that of Hprt. (D) BMDMs treated with the indicated first PAMP for 0, 8, or 24 hours and then with the indicated second PAMP for 8 hours were analyzed by qRT-PCR to determine the relative abundances of Il1a, Il10, and Csf3 mRNAs. Data in (C) and (D) are means ± SEM of three independent experiments.
The abundances of Il6 and Il12b mRNAs increased after combinatorial stimulation, regardless of the time intervals or the sequence of both treatments (Fig. 1B). However, the abundances of these mRNAs were substantially increased when cells were first treated with poly(I:C) and then with R848 rather than in the opposite order, which indicated that the treatment order had a substantial effect on synergistic cytokine production (Fig. 1B). Furthermore, the use of different time intervals between both treatments also affected the extent of synergy. In particular, the greatest synergy in cytokine production occurred when cells were treated with R848 8 hours after they were treated with poly(I:C) (Fig. 1, B and C). Furthermore, similar effects of stimulation order and time interval were observed for the expression of Il1a, Il10, and Csf3 (Fig. 1D).
A kinetic model is presented for TLR3 and TLR7 signaling networks and their crosstalk
To understand the mechanisms governing the synergistic cytokine production observed under combinatorial stimulations, we built a computational model that includes known signaling cascades and potential crosstalk bridges linking the TLR3 and TLR7 pathways (Fig. 2). We also prepared schemas outlining the detailed reaction networks (fig. S1). Here, we briefly describe the main modules of our model (see table S1 for a list of acronyms).
Fig. 2. Schematic representation of interactions between the TLR3 and TLR7 signaling networks.
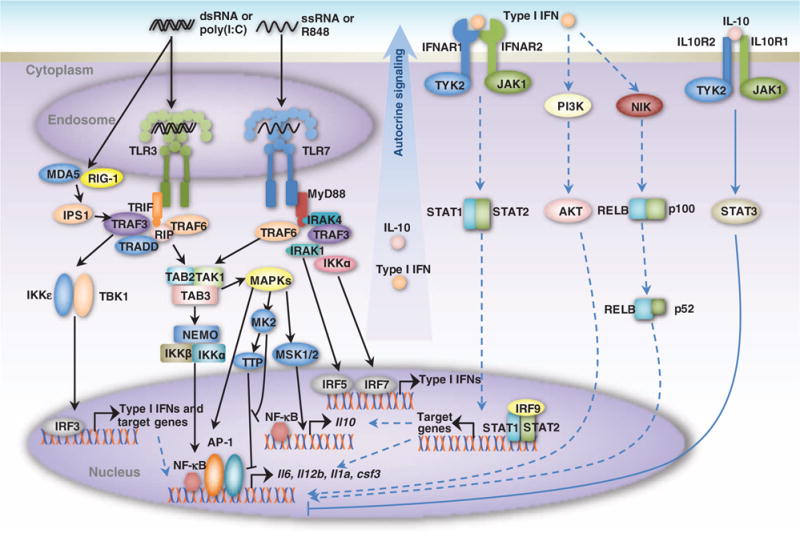
TLR3 recognizes dsRNA [and analogs, such as poly(I:C)] derived from viruses or virus-infected cells and induces the antiviral immune response by promoting the production of type I IFNs and inflammatory cytokines (for example, IL-6 and IL-12p40) through the TRIF-dependent pathway. TLR7 recognizes ssRNA (and analogs, such as R848) and induces the production of type I IFNs and cytokines through the MyD88-dependent pathway. IRF3 and IRF5/7, which are activated by the TLR3 and TLR7 pathways, respectively, lead to the production of type I IFNs. The activation of both NF-κB and AP-1 by both pathways leads to the production of inflammatory cytokines. The detailed reaction schemas are shown in fig. S1.
TLR3 signaling (3) is initiated by the sensing of dsRNA or its analog, poly(I:C). This, in turn, activates TRIF, which leads to the recruitment of tumor necrosis factor (TNF) receptor–associated factor 6 (TRAF6), TNF receptor type 1–associated death domain protein (TRADD), Fas-associated protein with death domain (FADD), and receptor-interacting protein 1 (RIP1) to the receptor to form a complex. RIP1 activates the transforming growth factor β–activated kinase 1 (TAK1) complex, which, in turn, simultaneously activates the inhibitor of κB (IκB) kinase (IKK) complex and the MAPKs (ERK, p38, and JNK). These events in turn stimulate the translocation of NF-κB to the nucleus and the activation of the transcription factor AP-1, respectively, to induce expression of genes encoding inflammatory cytokines, including IL-6, IL-12, IL-1α, and colony-stimulating factor 3 (CSF-3). MAPKs also activate MAPK-activated protein kinase 2 (MK2), which leads to the phosphorylation and inactivation of tristetraprolin (TTP). TTP, which destabilizes cytokine mRNAs, is inactivated after phosphorylation by MK2, thus enabling the efficient translation of cytokine-encoding mRNAs (29, 30). Simultaneously, the TRIF-dependent pathway also activates the transcription factor IRF3 through a TRAF3-dependent pathway, which leads to the subsequent production of type I IFN. In summary, TLR3 induces the antiviral immune response by promoting the production of type I IFNs predominantly and of inflammatory cytokines to a lesser extent.
The TLR7 pathway is initiated by the sensing of ssRNA or its analog, R848 (2, 3). Ligand-bound TLR7 in turn activates MyD88, which recruits and activates the IL-1R–associated kinases IRAK4, IRAK1, IRAK2, and IRAK-M to the receptor. The activated IRAK complex interacts with TRAF6 and activates the TAK1 complex. At this point, the TLR3 and TLR7 pathways merge, leading to activation of the aforementioned AP-1 and NF-κB and the production of cytokines. These constitute the predominant signaling events in the TLR7 pathway. To a lesser extent, the TLR7 pathway also activates the transcription factors IRF7 and IRF5 (31), which then translocate to the nucleus and promote the expression of genes encoding type I IFNs.
In our system, we found that the R848-stimulated TLR7-MyD88 pathway induced cytokine production, but not to great extent (Fig. 1B). In addition, the poly(I:C)-stimulated TLR3-TRIF pathway alone led to the production of only small amounts of cytokines, but it greatly enhanced the production of cytokines in response to stimulation of the TLR7-MyD88 pathway (Fig. 1, B and D). This finding suggests that downstream components activated specifically by the TLR3-TRIF axis might cooperatively interact with the TLR7-MyD88 pathway (13) to enhance cytokine production. Together, these results indicate potential crosstalk mechanisms between TLR3-TRIF and TLR7-MyD88. We considered several potential crosstalk mechanisms in our model based on the notion that the key downstream events in the TLR3-TRIF pathway that distinguish it from the MyD88 pathway are the activation of IRF3 and the associated production of type I IFNs (Fig. 2) (2, 32). Our model includes the following IRF3- and type I IFN–mediated mechanisms: (i) Activated IRF3 binds to NF-κB and AP-1 to form an enhanceosome in the nucleus (33) to boost the transcription of Il6 and Il12b. In addition, IRF3 binds to the IFN-stimulated response element (ISRE) and induces the expression of cytokine regulatory genes (32). (ii) Secreted type I IFNs are recognized by the type I IFN receptor subunits IFNAR1 and IFNAR2, which, in turn, activate tyrosine protein kinase 2 (TYK2) and JAK1, leading to the tyrosine phosphorylation of STAT1 and STAT2 (collectively referred to as STAT1/2) and inducing the formation of a STAT1-STAT2-IRF9 complex, also known as the ISGF3 (IFN-stimulated gene factor 3) complex. This complex translocates to the nucleus and initiates the transcription of genes containing ISREs. Genes activated by ISGF3, such as that encoding IRF1, might be involved in synergistic cytokine production (34). (iii) Secreted type I IFNs can also activate the NF-κB subunit p52 through NF-κB–inducing kinase (NIK) and TRAF2, which may regulate cytokine production (35). (iv) Type I IFNs in the nucleus can also activate the phosphoinositide 3-kinase–AKT pathway, leading to the activation of NF-κB (36).
We also modeled feedback mediated by the anti-inflammatory cytokine IL-10. Activated ERK and p38 phosphorylate mitogen- and stress-activated protein kinase 1/2 (MSK1/2), which promotes the transcription of Il10 (37). STAT1 target genes may also lead to the increase in Il10 expression (38). Secreted IL-10 then inhibits proinflammatory cytokine production through a JAK-STAT3–dependent pathway (39). Because the cytosolic dsRNA receptors melanoma differentiation–associated protein 5 (MDA5) and retinoic acid–inducible gene 1 (RIG-1) might also be activated by poly(I:C) without the need for a transfection reagent, our model in addition takes these non-TLR family PRRs into account. Activation of MDA5 and RIG-1 stimulates IFN-β promoter stimulator 1 (IPS1, also known as MAVS, VISA, or Cardif), which recruits TRAF3. TRAF3 then recruits TBK1 and IKKε to form the IPS1-TRAF3-TBK1-IKKε complex, which activates IRF3, thus promoting the production of type I IFNs (40, 41).
The calibrated model has both descriptive and predictive powers
Our mathematical model consists of 112 ordinary differential equations (ODEs) and 156 kinetic parameters (see the Supplementary Materials for details). The values of 27 rate constants for the reactions associated with the NF-κB pathway were adapted from the literature (42). To estimate the remaining 129 unknown parameters, we used data from our experiments on the time courses of Il6, Il12b, Il1a, Csf3, and Il10 mRNAs (Fig. 1, B and D) measured under the following conditions: (i) stimulation with poly(I:C) alone (I), (ii) stimulation with R848 alone (R), (iii) simultaneous stimulation with poly(I:C) and R848 (IR), (iv) stimulation with poly(I:C) followed by stimulation with R848 after an 8-hour interval (I8R), (v) stimulation with poly(I:C) followed by stimulation with R848 stimulation after a 24-hour interval (I24R), (vi) stimulation with R848 followed by stimulation with poly(I:C) with an 8-hour interval (R8I), and (vii) stimulation with R848 followed by stimulation with poly(I:C) after a 24-hour interval (R24I).
The abundances of Il6 and Il12b mRNAs were measured at 10 time points (0, 4, 8, 12, 16, 24, 28, 32, 40, and 48 hours) when cells were treated with a single compound, and at 4, 8, 16, and 24 hours after a second stimulation (IR, I8R, I24R, R8I, and R24I). The abundances of Il1a, Csf3, and Il10 mRNAs were measured at three time points after stimulation (8, 16, and 32 hours) when cells were treated with a single compound and at 8 hours after the second stimulation in the case of combined treatments (IR, I8R, I24R, R8I, and R24I; Fig. 1D). In addition to these data, we also used data from our published experiments (13), which analyzed the abundances of several major regulators of cytokines, including phosphorylated forms of ERK, p38, JNK, and IκBα. The concentrations of these signaling molecules were measured at seven time points (at 5, 15, and 30 min, as well as at 1, 4, 8, and 12 hours) either after stimulation when cells were treated with a single compound or after the second stimulation in the case of combined treatments (IR, I8R, and I24R; Fig. 3A) (13). We reserved the Il6, Il12b, Il1a, Csf3, and Il10 mRNA time-course analysis under the I24R, R8I, and R24I conditions (Fig. 3, B and C) as the test data set and used the remaining data to train or calibrate the model parameters (such as unknown rate constants) with a statistical logic-based framework that we developed previously (see Materials and Methods for details) (26). Initial protein concentrations were allowed to vary 5% about their nominal values to account for cellular heterogeneities (see table S2 for the resulting estimated kinetic parameters).
Fig. 3. Model predictions and experimental validation.
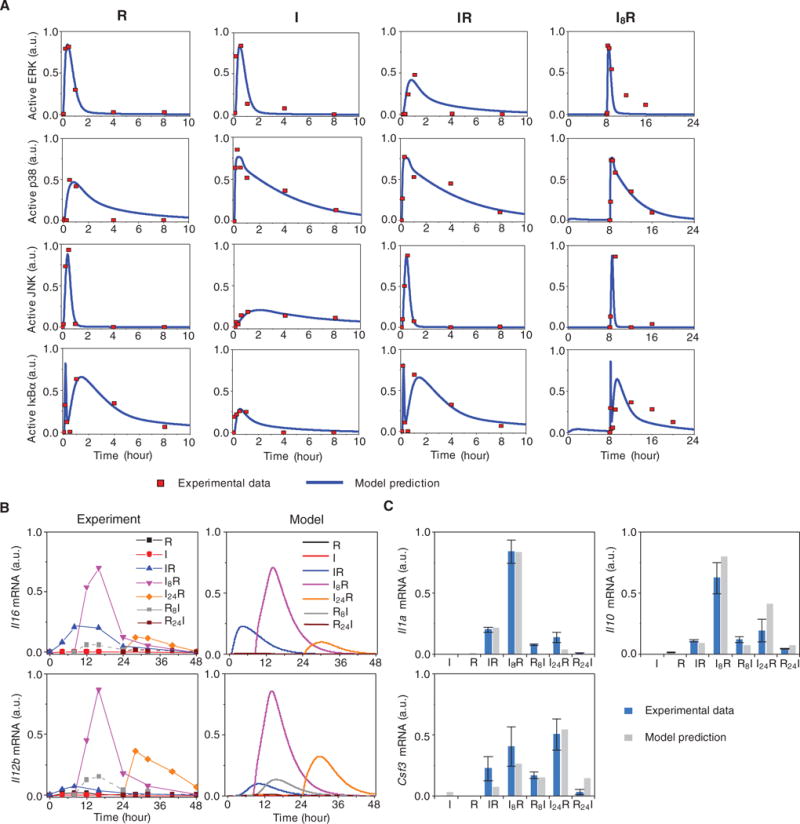
(A) Experimental and simulated protein dynamics of the TLR3 and TLR7 pathways. The time profiles of activated ERK, p38, JNK, and IκBα under the following four conditions were simulated with estimated parameters and were compared against the experimental data: R848 single stimulation (R), poly(I:C) single stimulation (I), poly(I:C) and R848 combinatorial stimulation with a 0-hour time interval (IR), and poly(I:C) and R848 combinatorial stimulation with an 8-hour time interval between the addition of each stimulus (I8R). The results of the model simulation are depicted in blue, whereas the results of the experimental analysis (13) are shown as red dots. a.u., arbitrary units. (B) Model predictions and experimental validation of the expression of Il6 and Il12b. The simulated time profiles of the relative abundances of Il6 and Il12b mRNAs under the indicated conditions (right; Model) were compared to the observed time-dependent synergistic effect induced by the combined activation of TLR3 and TLR7 (left). The experimental data points are connected by lines as a visual aid. The experimental data are representative of three independent experiments. (C) Model predictions and experimental validation of the relative abundances of Il1a, Il10, and Csf3 mRNAs under the indicated conditions. Data are means ± SEM of three independent experiments.
We found that the profiles that were generated by our simulations with our set of parameters (Fig. 3A, blue curves) fit well to the experimental data (Fig. 3A, red dots). We also compared the Il6, Il12b, Il1a, Il10, and Csf3 expression data [Fig. 3, B (left) and C (blue bars)] with the simulated profiles [Fig. 3, B (right) and C (gray bars)] under different treatment conditions. The model successfully reproduced the time- and order-dependent synergy of cytokine production, and its predictions matched not only the training data (from the R, I, IR, and I8R conditions) but also the test data (from the I24R, R8I, and R24I conditions). This increased our confidence that the model had not been overfitted and that it had adequate predictive power. For the remaining part of the study, we chose Il6 and Il12b as representative cytokine mRNAs with which to investigate the stimulation order- and time-dependent synergy in cytokine production.
Sensitivity analysis identified key components and reactions controlling synergistic cytokine production
Our model was then used to perform various in silico experiments. To identify the components and reactions that were essential to inducing a synergistic cytokine production, we conducted an extensive sensitivity analysis of the initial concentrations and kinetic parameters to cytokine abundance with our statistical model checking (SMC) technique (26). We first performed control coefficient–based sensitivity analysis of the initial concentrations of the major species in the model. The model output was defined as the integrated abundances of Il12b and Il6 mRNAs in response to five conditions (R, I, IR, I8R, and I24R), and we computed the normalized local sensitivities (Fig. 4A). The results for the single-stimulation conditions showed that TLR7 and pathway components directly downstream of TLR7 were more sensitive to stimulation with R848 than were components of the TLR3 pathway, and that the components of the TLR3 pathway were more sensitive to stimulation with poly(I:C). TLR3-mediated cytokine production is mainly dependent on the IκBα–NF-κB axis, which exhibited high sensitivity under all five conditions (Fig. 4A). In contrast, AP-1, another key transcription factor that stimulates cytokine production, was sensitive only under conditions that involved TLR7 activation (R, IR, I8R, and I24R).
Fig. 4. Sensitivity analysis.
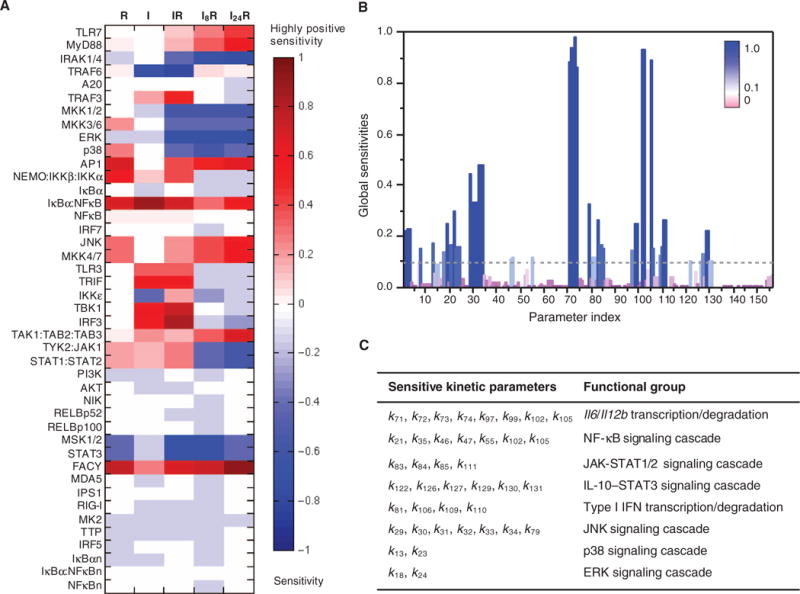
(A) Local sensitivities (control coefficients) of the initial concentrations of proteins (listed along the ordinate) to the integrated response of Il12b expression under the R, I, IR, I8R, and I24R conditions. The heat map is color-coded from red (high positive sensitivity) to blue (high negative sensitivity). The former group refers to proteins whose increase in initial concentration would enhance cytokine mRNA production, and the latter group refers to those whose decrease in initial concentration might enhance cytokine mRNA production. Components whose initial concentrations had little or no effect on the system dynamics are shown in light colors or white. (B) Global sensitivities calculated according to the SMC-MPSA method. Sensitive parameters, which strongly influenced the observed behavior, are depicted as dark blue peaks. Robust parameters, whose variation had little effect on the model dynamics, are depicted in purple. The highest peaks refer to transcription or degradation rate constants for Il6 and Il12b mRNAs. (C) Functional classification of the 40 kinetic parameters that led to the highest sensitivity peaks, which are those above the dotted threshold line in (B). The corresponding reactions are indicated by red arrows in fig. S1.
Similar to downstream AP-1, other components, such as MKK1 and MKK2, MKK3 and MKK6, MKK4 and MKK7, ERK, p38, and JNK, displayed high sensitivities under combinatorial conditions, suggesting that the MAPK signaling cascades (fig. S1) might play crucial roles in coupling the upstream modules of the TLR3 and TLR7 signaling pathways to the downstream transcription module. Although all three MAPK cascades can activate AP-1 in parallel, the components of the JNK signaling cascade exhibited positive sensitivities, whereas those of the ERK and p38 cascades showed negative sensitivities (Fig. 4A). This finding highlights the distinct roles of JNK, ERK, and p38 in regulating synergistic cytokine production. The negative sensitivities displayed by MSK1/2 and STAT3 are suggestive of the potential importance of IL-10–induced STAT3 activation in inhibiting cytokine production and maintaining homeostasis. Furthermore, the averages of the absolute values of the sensitivities of TYK2-JAK1 and STAT1-STAT2 over the system response were 233- and 107-fold of the proteins in the AKT and NIK pathways, respectively. This implies the importance of the JAK-STAT1/2 pathway among all of the potential crosstalk mechanisms.
We next computed the global sensitivities of the model to kinetic parameters with a multiparametric sensitivity analysis (MPSA) method on the basis of our SMC approach (see Materials and Methods for details). The model output was defined as the integrated abundances of Il12b and Il6 mRNAs under the I8R condition. Forty kinetic parameters (rate constants) were distinguished by their strong effects on cytokine production [Fig. 4B, global sensitivities >0.1 (blue bars); see fig. S1 for corresponding reactions (red arrows)]. These were classified (Fig. 4C) into eight functional groups: the expression of the Il12b and Il6 genes, and the production of type I IFN proteins, the JAK-STAT1/2 signaling cascade, the IL-10–STAT3 signaling cascade, and the NF-κB and three MAPK signaling cascades, as noted earlier. The two rate constants (k72 and k73) that gave rise to the highest sensitivities were associated with the transcription and degradation of Il12b and Il6 mRNAs, respectively. Seven rate constants associated with reactions along the JNK pathway, which leads to the activation of AP-1, also exerted strong controls over the expression of Il12b and Il6.
This result is consistent with the local sensitivity analysis, which suggests the dominant role of the JNK pathway, compared to the ERK and p38 pathways, in activating AP-1. In addition, the analysis highlights the important inhibitory role of the reactions associated with the IL-10–STAT3 pathway, compared to other inhibitory interactions in the system, such as that generated by A20 (fig. S1). Furthermore, many critical reactions are involved in production of type I IFN proteins and the activation of the JAK1-STAT1/2 pathway, which could be connected by our hypothesized pathway: type I IFN→STAT1/2→cytokine production. Thus, one insight that emerges from these findings is that the time-dependent synergy in cytokine production that we observed experimentally may be induced by a STAT1/2-mediated crosstalk mechanism, in addition to the regulatory feedback from the MAPK signaling cascades.
The time interval between stimulation of TLR3 and TLR7 affects the synergistic production of cytokines, but not the production of type I IFN
In addition to the components and reactions that we identified earlier, the overall extents of expression of both Il6 and Il12b were also highly sensitive to the time interval Δt between the two PAMP treatments (Fig. 1, B and C). Here, we simulated the model behavior by varying the Δt value between the TLR3 and TLR7 activations from 0 to 48 hours to explore the dependency of the immune response on the timing of the combined stimulations. We then predicted these effects in terms of Il6 and Il12b mRNA abundances (Fig. 5A). We calculated the peak amplitudes and peak time (starting from the R condition) of each response curve and plotted them as functions of Δt (Fig. 5B). With increasing Δt, the peak amplitudes of Il6 and Il12b mRNA abundance first increased until maximal values were generated, and then they decreased. Maximal amplitudes were reached at about Δt = 6 hours for both Il6 and Il12b mRNA production. This is consistent with our earlier experimental data (Fig. 1C), which indicated that the optimal Δt between treatments was 8 hours (among the measurements made at defined intervals). On the other hand, the duration required to reach the response peaks was consistently about 10 hours for both Il12b and Il6 (Fig. 5B).
Fig. 5. Dependency of the cytokine mRNA response on the time interval (Δt) between the two TLR stimuli.
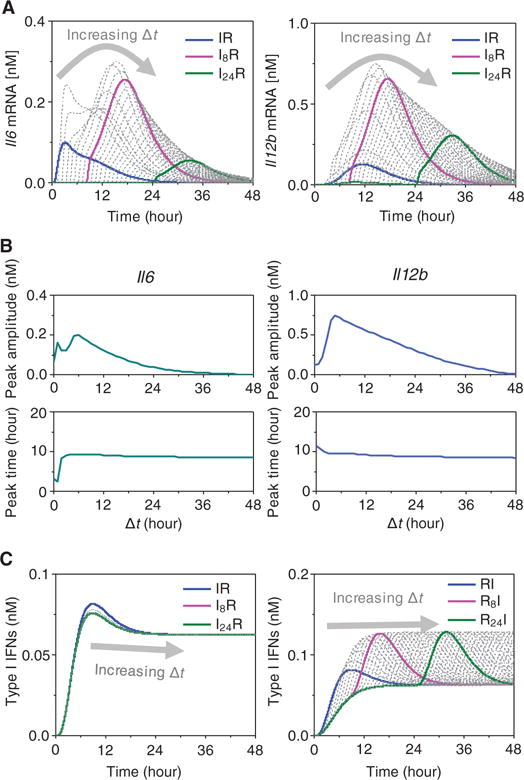
(A) Predicted time course of Il6 and Il12b expression (as determined by measurement of their mRNA abundances) in response to various combinatorial stimulations in which the time interval Δt between the first (I) and second (R) stimulus varied from 0 to 48 hours. The series of dotted curves represent results for successive Δt values, with the horizontal ordinate referring to the time elapsed with respect to the application of the first stimulus. Highest cytokine mRNA abundance occurs when the time interval between the two stimuli is ≈6 hours. The results for Δt = 0 (blue), 8 (magenta), and 24 hours (dark green) are depicted by the thick colored curves. (B) Peak amplitudes (top) and peak times (bottom) of Il6 (left) and Il12b (right) mRNA abundances derived from the curves shown in (A). (C) Predicted amounts of type I IFN produced in response to the indicated combinatorial IR (left) or RI (right) conditions with Δt ranging from 0 to 48 hours.
We also simulated the time profiles of type I IFN protein production for different values of Δt under sequential treatments: poly(I:C) followed by R848 (IR; Fig. 5C, left) and R848 followed by poly(I:C) (RI; Fig. 5C, right). The effects of Δt on type I IFN production were negligible in the former case. In contrast, for the RI stimulation conditions, the production curve substantially shifted together with the starting time of stimulation with poly(I:C) and maintained constant peak amplitude. Together, these results imply that type I IFN production is predominantly governed by the application time of the first stimulus [poly(I:C)] or by the activation of the TLR3 signaling pathway (Fig. 5C), whereas cytokine production is regulated by both the TLR3 and TLR7 pathways or by crosstalk between them. Furthermore, although type I IFN is implicated in most of the putative crosstalk pathways between the TLR3 and TLR7 pathways, it is not sufficient to account for the dependency of cytokine production (or synergy) on the time interval Δt between the two consecutive stimuli.
In silico and experimental knockdown of MAPKs reveals the distinct effects of JNK, ERK, and p38 on cytokine production
The sensitivity analysis presented earlier (Fig. 4) highlighted the substantial role of the MAPKs in modulating synergistic cytokine production. The TAK1 complex activated the ERK, JNK, and p38 signaling cascades in parallel (fig. S1), and any of these signaling pathways was capable of activating AP-1 and promoting the production of Il12b and Il6 mRNAs. At the same time, ERK and p38 also induced the production of IL-10, which led to the suppression of IL-12p40 and IL-6 production through a STAT3-dependent pathway. This forms an I1-FFL (see the Supplementary Materials for details), a circuit in which a regulator X activates Z and X also activates Y, which in turn inhibits Z.
To assess the effects of the different MAPK pathways on synergistic cytokine production, we performed in silico knockdown experiments (that is, we simulated the prevention of activation of MAPKs) by eliminating the phosphorylation reactions along each of the three MAPK cascades and calculating the predicted time profiles of Il12b and Il6 mRNA production for Δt values in the range of 0 to 48 hours (Fig. 6, A to C). Reducing the amount of activated JNK by 90% substantially decreased cytokine mRNA production, which suggests that JNK has a dominant role among the MAPKs. In contrast, reducing the abundance of activated ERK increased cytokine mRNA production under various conditions (for example, IR, I8R, and I24R), suggesting that the inhibitory effect of ERK mediated by IL-10 and STAT3 is greater than the enhancing effect mediated by AP-1. Hence, these data suggest that ERK acts as an overall negative modulator (or suppressor) of cytokine mRNA production. Reduction of p38 activity also decreased cytokine mRNA production under conditions of combinatorial treatment, although the effect was relatively small or negligible compared to that of ERK.
Fig. 6. Effects of inhibition of JNK, ERK, or p38 on cytokine production.
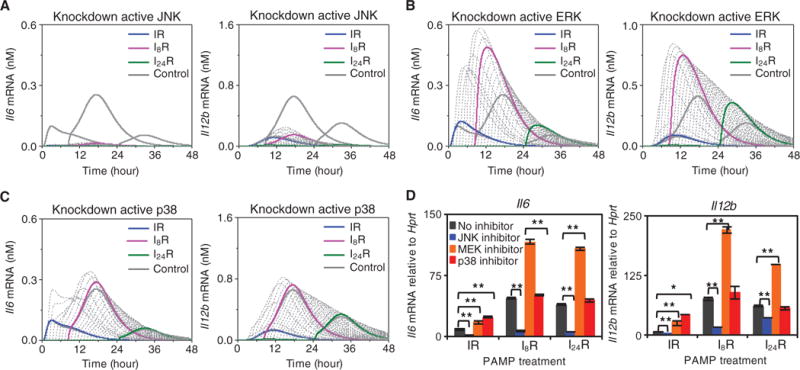
(A to C) Time-course analysis of changes in the abundance of Il12b mRNA (left) and Il6 mRNA (right) in the absence of JNK (A), ERK (B), or p38 (C) activity. The series of computational predicted curves refer to different time intervals between the two stimuli (similar to Fig. 5A). The curves for Δt = 0, 8, and 24 hours (colored, thick) were compared with those deduced from control simulations (thick, gray curves). (D) Experimental verification of computational predictions. BMDMs were treated with the indicated MAPK inhibitors (each at 10 μM) for 50 min and then were subjected to simulation according to the IR, I8R, or I24R conditions. After 8 hours of treatment with R848, the abundances of Il6 and Il12b mRNAs were measured by qRT-PCR analysis and were normalized to that of Hprt mRNA. Data are means ± SEM of three individual experiments.
To experimentally verify these model predictions, we perturbed the initial activities of JNK, ERK, and p38 by incubating BMDMs with the JNK inhibitor SP600125, the MEK1 (MAPK kinase 1) and MEK2 inhibitor U0126 (to prevent ERK activation), or the p38 inhibitor SB203580 for 50 min. The BMDMs were then treated first with poly(I:C) for 0, 8, or 24 hours, which was followed by treatment with R848 for 8 hours before qRT-PCR analysis was performed (Fig. 6D). For all three treatments, JNK inhibition caused a decrease in the production of cytokine mRNAs, whereas inhibition of ERK activation resulted in increased cytokine mRNA production (consistent with its negative regulation of cytokine mRNA production being blocked). Finally, inhibition of p38 activity slightly increased cytokine mRNA production in general. These observations are consistent with the simulation results discussed earlier (Fig. 6, A to C) and confirm the distinctive effect of each MAPK signaling cascade on the synergistic production of cytokines.
The JAK-STAT1/2 pathway is the main mechanism responsible for the induction of synergistic cytokine production
The sensitivity analysis results (Fig. 4) implied that JAK-STAT1/2 pathway is a major determinant of synergistic cytokine production. To confirm this, we performed in silico knockout experiments in which the four putative mechanisms discussed earlier were inactivated. These include (i) transcriptional activation of the genes encoding type I IFNs and other target genes by IRF3 (which is downstream of TLR3), (ii) core reactions induced by the activation of AKT, (iii) core reactions induced by NIK activation (both AKT and NIK being activated by secreted type I IFNs), and (iv) the JAK-STAT1/2 pathway, which potentially establishes crosstalk relevant to synergistic cytokine production. These four mechanisms were inhibited by simulating knockdown of IRF3, AKT, NIK, or STAT1, and the time courses of cytokine mRNA expression under each of these conditions were examined, subjected to different combinatorial stimulation protocols. The amounts of simulated Il12b mRNA (Fig. 7A) and its counterpart Il6 mRNA (fig. S2) showed that the knockout of STAT1 almost completely abrogated the synergistic production of cytokines under the I8R and I24R conditions, whereas knockout of the other three components had no detectable effect. We also performed in silico knockouts for different combinations of the signaling molecules involved in putative crosstalk mechanisms (fig. S3), which confirmed the essential role of the JAK-STAT1/2 pathway in mediating the synergistic production of cytokines (which was consistent with the parameter sensitivity results).
Fig. 7. In silico and empirical perturbation of the JAK-STAT pathway reveals the complex regulatory role of an I1-FFL.
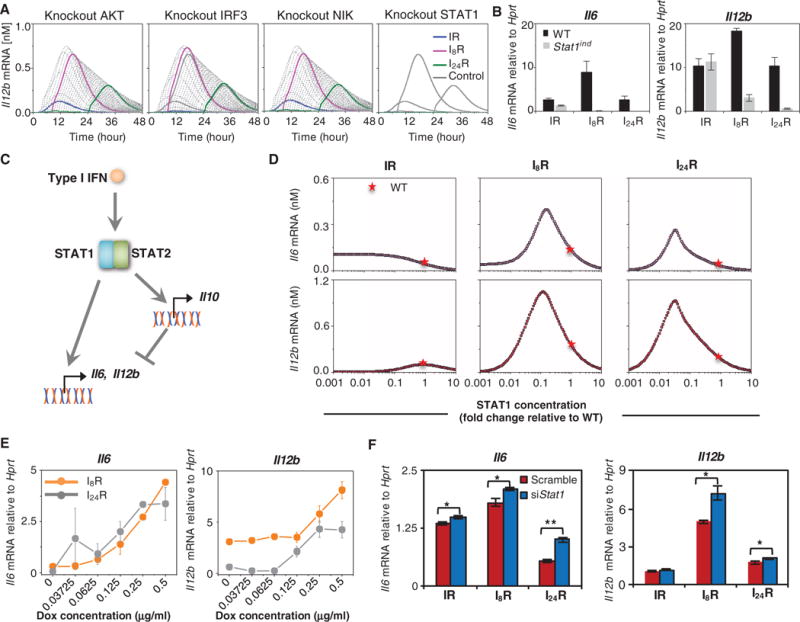
(A) Knockout simulations highlight the importance of the JAK-STAT pathway in stimulating synergistic cytokine production. Time-course analysis of changes in Il12b mRNA abundance in the absence of AKT, IRF3, NIK, or STAT1. The series of curves refer to different time intervals between the two stimuli (similar to Fig. 5A). (B) BMDMs isolated from wild-type (WT) and Stat1ind mice (in the absence of doxycycline treatment) were subjected to stimulation under the IR, I8R, and I24R conditions. Eight hours after treatment with R848, the relative abundances of Il6 (left) and Il12b (right) mRNAs were determined by qRT-PCR analysis. (C) Outline of the STAT1-mediated I1-FFL. STAT1 not only stimulates the production of IL-12p40 and IL-6 but also enhances the production of IL-10, which inhibits IL-12p40 and IL-6 production. (D) Simulations of the relationship between the indicated initial concentrations of STAT1 and the amounts of Il6 (top) and Il12b (bottom) mRNAs produced under the IR, I8R, and I24R conditions. The red star denotes the initial STAT1 concentration in WT cells (2.3 nM) as computed by model calibration. (E) BMDMs isolated from Stat1ind mice treated with the indicated concentrations of doxycycline (Dox) for 24 hours were then subjected to the indicated stimulation conditions. Eight hours after treatment with R848, the relative abundances of Il6 (left) and Il12b (right) mRNAs were determined by qRT-PCR analysis. (F) Stat1 knockdown enhances cytokine production. J774 cells were transfected with either Stat1-specific siRNA (siStat1) or scrambled control siRNA. Twenty-four hours later, the cells were stimulated under the IR, I8R, or I24R conditions. Eight hours after treatment with R848, the relative abundances of Il6 (left) and Il12b (right) mRNAs were determined by qRT-PCR analysis. Data in (B), (E), and (F) are means ± SEM of three individual experiments.
To confirm the role of STAT1 that was predicted by our model, we tested cytokine gene expression in wild-type and STAT1 knockout BMDMs derived from STAT1-inducible (Stat1ind) mice without doxycycline treatment (43). We found that the amounts of Il6 and Il12b mRNAs were decreased in the STAT1 knockout cells compared to those in the wild-type cells when they were treated under the I8R and I24R conditions (Fig. 7B and fig. S4A), which suggests that STAT1 was required for synergistic cytokine production.
In silico and experimental knockdown of STAT1 highlights the complex regulatory role of the I1-FFL
Similar to the ERK and p38 signaling events, the JAK-STAT1/2 pathway mediates an I1-FFL, because its target genes not only directly stimulate the production of IL-12p40 and IL-6 but also enhance the production of IL-10, which inhibits IL-12p40 and IL-6 production (Fig. 7C). Earlier, we showed by simulation that knockout of STAT1 would lead to a substantial decrease in synergistic cytokine production (Fig. 7, A and B). However, the negative local sensitivity values associated with the STAT1-STAT2 complex (Fig. 4A) suggest that a mild decrease in the initial concentration of STAT1 might induce cytokine production. The opposing roles of STAT1 in synergistic cytokine production implied that the STAT1-mediated I1-FFL (Fig. 7C) might lead to the generation of a nonmonotonic input-output relation, that is, a biphasic response (27, 44).
To investigate the role of the STAT1-mediated I1-FFL, we simulated the abundances of Il12b and Il6 mRNAs at 8 hours after a second PAMP challenge under the IR, I8R, and I24R conditions. The initial concentration of STAT1 was varied from 0.001 to 10× its abundance in wild-type cells; 2.3 nM is the physiological concentration of STAT1 in BMDMs as estimated by our model calibration process and is considered as 1× its abundance in wild-type cells (Fig. 7D, red star). We found that a biphasic response occurred under the I8R and I24R (but not IR) conditions. Specifically, increasing the STAT1 concentration, which ranged from 0 to 1× its abundance in wild-type cells (Fig. 7D, red star), led first to an increase and then a decrease in cytokine mRNA production under both the I8R and I24R conditions. We also evaluated the expression of other cytokine-encoding genes, including Il1a, Il10, and Csf3, in response to STAT1 (fig. S4). The model predictions (fig. S4B) showed that STAT1 induced a biphasic response in Il1a expression under the I8R and I24R conditions, whereas it enhanced the expression of Il10 and Csf3.
To gather experimental support for this biphasic response, we tested cytokine mRNA production in response to various amounts of STAT1 in experiments with cells from Stat1ind mice (43). We first demonstrated the incremental induction of STAT1 abundance in BMDMs derived from Stat1ind mice and pretreated with doxycycline (0, 0.03125, 0.0625, 0.125, 0.25, and 0.5 μg/ml) (fig. S5). We analyzed the production of cytokine mRNAs under the I8R and I24R conditions (Fig. 7E and fig. S4C). We found that increasing the abundance of STAT1 from an undetectable starting amount (through pretreatment with increasing concentrations of doxycycline) led to an increase in the production of cytokine mRNAs under the I8R and I24R conditions, which further suggested that STAT1 was essential for the synergistic production of cytokines.
We noted that the biphasic response predicted by our model (Fig. 7D) consists of two phases: (i) Cytokine mRNA production increased when STAT1 abundance was increased from an undetectable starting concentration and (ii) cytokine mRNA abundances decreased when the STAT1 abundance continued to increase. Stated differently, cytokine mRNA production increased when the amount of STAT1 decreased relative to the starting amount in wild-type cells. Our data (Fig. 7E) confirmed the existence of the first phase but did not clearly identify the second phase even though the amount of STAT1 reached a high abundance in response to treatment with the highest concentration of doxycycline (0.5 μg/ml). This could be due to the fact that the doxycycline-inducible STAT1 mice showed only a reduced amount of STAT1 Y701 phosphorylation relative to that of their wild-type counterpart (fig. S5). However, Y701 phosphorylation is essential for the full transcriptional activities of STAT1 (45). Furthermore, treatment with doxycycline may cause side effects and, in particular, may modulate cytokine production (46, 47).
To experimentally confirm the second phase of the predicted biphasic response, we performed in vitro STAT1 knockdown experiments. As noted earlier, our findings suggest that reducing the amount of STAT1 (relative to the starting amount found in wild-type cells) would lead to increased cytokine mRNA production under the I8R and I24R conditions. We note that in vivo, the initial concentration of STAT1 may be even higher than the computationally estimated 1× abundance of that in wild-type cells (48). However, knocking down STAT1 from a higher initial abundance also induced an increase in cytokine mRNA response. Accordingly, cells were transfected with Stat1-specific small interfering RNA (siRNA) or nontarget control siRNA. We verified that there was substantial knockdown of STAT1 at 24 hours after transfection (fig. S6), after which the cells were stimulated for 8 hours under the IR, I8R, or I24R conditions. Knockdown of STAT1 resulted in enhancement of the amounts of Il6 and Il12b mRNAs in cells stimulated under the I8R and I24R conditions (Fig. 7F). These observations agreed well with the in silico model predictions (Fig. 7D), namely, cytokine abundance would increase if the concentration of STAT1 was decreased in abundance from that in wild-type cells (Fig. 7D, red star) under the I8R and I24R conditions. These results confirm the existence of the second phase of the predicted biphasic response. Combined with the earlier observation that increasing the abundance of STAT1 increased the production of cytokine mRNAs, we thus have experimental evidence supporting the biphasic response predicted by the model. Overall, our results demonstrate the complex regulatory role of the I1-FFL consisting of STAT1, IL-12p40, IL-6, and IL-10.
DISCUSSION
TLR signaling pathways protect the host against a broad range of microbial pathogens. Here, our empirical and computational analyses identified how two key TLR pathways coordinate an optimal innate immune response in macrophages. Specifically, when TLR3 is activated, it primarily leads to the production of type I IFNs through a TRIF-dependent pathway. This initial response primes the host cell for a more effective immune response (in terms of the MyD88-mediated production of proinflammatory cytokines) to a subsequent TLR7-specific PAMP challenge, by generating a form of innate immunological memory. This synergistic effect is highly time-dependent, and an optimal immune response requires a proper synchronization of events downstream of the TLR3 and TLR7 signaling pathways.
Here, we found that the time-dependent synergistic production of cytokines was predominantly controlled by the JAK-STAT1/2 pathway, which was stimulated by autocrine signaling by type I IFNs that were induced by TLR3 stimulation. We revealed the dual opposing roles of the JAK-STAT pathway: STAT1 induces the expression of genes encoding inflammatory cytokines through transcription factors such as IRF1 (28), whereas it also inhibits cytokine production through its target, the anti-inflammatory cytokine IL-10. The overall extent of cytokine production depended on the subtle, time-dependent coordination of IRF1 and IL-10. Thus, our findings suggest that STAT1 is not only an essential mediator of synergistic cytokine production to boost the immune response but also a modulator to avoid excessive immune responses. We further showed the involvement of the MAPK signaling cascades in this process, revealing the opposing effects of JNK (an enhancer of cytokine production) and ERK (a suppressor of cytokine production), as predicted by model simulations and confirmed empirically.
This cooperation between TLRs has physiological relevance. Tlr2−/− and Tlr9−/− mice are more susceptible to challenge by a high dose of Mycobacterium tuberculosis than are their wild-type counterparts (49). In addition, both Tlr3−/− and Tlr9−/− mice have reduced resistance to murine cytomegalovirus, which is associated with reduced production of type I IFN and IL-12 (50). In a mouse model, IL-12p40 plays a role in attracting macrophages to the lung after infection with Sendai virus. Note that Sendai virus is an ssRNA virus and it undergoes a dsRNA phase during amplification, which was a motivation for our stimulation modeled by both TLR3 and TLR7 ligands. In the case of Sendai virus infection, cooperation between the TLR3 and TLR7 signaling pathways might increase the production of IL-12p40, which could lead to the enrichment of more macrophages at the site of infection to target the virus.
In humans, decreased cytokine production is observed in aged monocytes and macrophages, as well as dendritic cells, which is closely related to the decreased amounts of TLRs, rendering the aging population more vulnerable to infection (51, 52). Synergistic cytokine production induced by the collaboration of multiple TLRs plays an important role in mounting effective immune responses and pathogen clearance. Conversely, overreactive immune responses due to TLR crosstalk (13, 28), if unchecked, would also harm the host, causing chronic or acute inflammation. For example, increased amounts of IL-6, IL-12p40, and IL-12p19 are observed in the serum of systemic lupus erythematosus patients, as well as in mouse models (53, 54), and such autoimmune disorders are closely related to TLR3-and TLR7-mediated responses. Thus, an enhanced understanding of the rationale and outcome of TLR crosstalk is required. In this light, our findings have provided some insights into the dynamics of TLR crosstalk from a global perspective and have paved the way for future studies and the potential development of anti-inflammatory immunomodulators.
In the past two decades, intense research has identified and characterized hundreds of components and interactions that are implicated in TLR signaling. Various systems biology approaches have been used to improve our understanding of TLR-mediated innate immune responses (14). However, an accurate and validated mathematical model of TLR signaling networks, with consideration of the dynamic crosstalk between various TLR pathways, has been hitherto lacking (15, 19–22, 24, 55–60). Here, we developed a calibrated ODE-based kinetic model for the time-dependent coupling between two specific TLR pathways and its complex implications. Furthermore, a previously uncharacterized JAK-STAT–mediated synergistic mechanism and the complex role of STAT1, as suggested by our study, could guide future investigations to discover unidentified components and their interactions in the TLR signaling network. As new data become available, our model can be refined and extended to help gain more insights.
The innate immune system must be tightly regulated to amplify the appropriate level of protective responses during infection, attenuate the damage inflicted by inflammation, and maintain or restore homeostasis. For example, complement pathways exhibit crosstalk to enhance antibacterial activities under inflammatory conditions and simultaneously establish tight immune surveillance (61). In this context, “priming” and “tolerance” are important concepts that have emerged from accumulating evidence (62, 63). For example, a low concentration of lipopolysaccharide (LPS), an inducer of TLR4 signaling, could prime macrophages and amplify cytokine production in response to a subsequent stimulation with an increased concentration of LPS, whereas preconditioning macrophages with a high concentration of LPS renders the cells much less responsive to stimulation with a subsequent high concentration of LPS (64). The basic mechanisms underlying these priming and tolerance phenomena were predicted in one study (64), which computationally enumerated all of the possible topologies of an essential network with three abstract nodes. A follow-up study (65) further hypothesized that IFNs and STAT1 might contribute to LPS-mediated priming in macrophages. Our study indicates that IFNs and STAT1 play key roles in priming the cell for subsequent challenges, and as such, it supports the hypothesis made by Fu et al. for TLR4 (64, 65), because TLR4 signaling is itself mediated by both MyD88 and TRIF.
The biphasic modulation of cytokine production through an I1-FFL deserves further attention. An I1-FFL is one of the most frequently observed network motifs in biological networks (66–68). It has been reported (27) that the roles of I1-FFL include (i) shortening of gene-circuit response times, (ii) generating gene expression pulses, (iii) distinguishing between time-varying inputs, (iv) filtering out noise, (v) detecting fold changes in the amount of input signal, and (vi) generating nonmonotonic input-output relations. There exist three I1-FFLs in our model, which are mediated by ERK, p38, and STAT1. Among these, we found that the STAT1-dependent I1-FFL, which induces a biphasic response, was crucial to both amplifying the antiviral response and avoiding excessive inflammatory response. The I1-FFL mediated by p38 had a minimal effect on cytokine production, but the I1-FFL mediated by ERK induced a strong suppressive effect. At the gene transcription level, Litvak et al. (25) identified a coherent type 1 FFL (C1-FFL) formed by NF-κB, ATF3, and CCAAT/enhancer binding protein δ, which discriminates between transient and persistent TLR4-induced signals. As a future direction, it will be interesting to explore the role of the gene transcription circuit downstream of TLR3 and TLR7 signaling and examine how different network motifs (for example, I1-FFL and C1-FFL) cooperate to determine the immune response.
A large number of previous modeling efforts have focused on the NF-κB signaling module, which constitutes a core component downstream of all TLR pathways (19, 20, 22, 56, 59, 60). An important finding from these studies is that a strong negative feedback loop mediated by IκBα can result in the oscillatory behavior of NF-κB upon stimulation of cells with TNF-α (19, 56). When cells are stimulated by LPS, which initiates TLR4 signaling, activated NF-κB exhibits sustained signaling (20). The persistence of LPS-induced NF-κB signaling is achieved by two rounds of NF-κB activation: (i) an early NF-κB response through an MyD88-dependent pathway and (ii) a late NF-κB response through a TRIF-dependent pathway, which first activates IRF3 and leads to the production of TNF-α (which then stimulates the TNFR pathway with a time delay of 30 min) (20). We modeled the IκBα-mediated negative feedback loop. It would be interesting to compare the dynamics of NF-κB activation in response to poly(I:C) followed by R848 to the two TLR4-dependent rounds of NF-κB activation (20), because both mechanisms are controlled by MyD88- and TRIF-dependent pathways and are mediated by the IRF3-induced production of autocrine signaling molecules. Because similar signaling network structures evolved to achieve modular dynamic functions (69), it would be also interesting to investigate whether these MyD88-TRIF-IRF3–mediated crosstalk mechanisms are present in other TLR pathways.
Apart from TLRs, other PRRs, including RIG-1–like receptors, C-type lectin receptors, and nonobese diabetic–like receptors, also contribute to PAMP recognition and the regulation of innate immunity (70). Because pathogens often contain various PAMPs that activate multiple PRRs, TLRs in crosstalk with other PRRs orchestrate both innate and adaptive host immune responses to combat infections (70). For example, hepatitis C virus (HCV) is recognized by both TLR3 and RIG-1. The HCV RNA delivered from infected hepatocytes also activates the TLR7 pathway (71). PRR crosstalk can either positively or negatively regulate the eventual immune response. Different types of collaborative responses have been reviewed by Tan et al. (4). Thus, it is important to understand how immune responses are coordinated and regulated by different PRRs. In this context, an important future direction will be the extension of the current model to non-TLR PRR pathways as well as to different cell types.
In summary, our experimental and computational modeling analyses have revealed how macrophages generate a type of innate immune memory by activating the TLR3 pathway and enhancing the immune response to a subsequent challenge with a PAMP. We achieved this by establishing an integrated computational model of two TLR pathways and investigating their crosstalk from a systems perspective. In addition, we examined the effect of the IFN-STAT1 pathway quantitatively and unraveled its dynamic role as a rheostat of cytokine production in TLR3-TLR7 crosstalk. Finally, our model also provides a potential platform for designing and testing pharmaceutical strategies for immunotherapy.
MATERIALS AND METHODS
Mathematical modeling
The reaction network (fig. S1) was modeled as 113 ODEs (see the Supplementary Materials for details). The reaction rates for assembly and binding, catalysis, and transcription were described with mass action kinetics, Michaelis-Menten kinetics, or equations developed previously (72). We addressed cell-to-cell variability explicitly with probability distributions over the initial concentrations and rate constants (table S2), and we used the CVODE package (73) to solve the ODE system.
Statistical model checking
SMC is a scalable computational technique for verifying whether a probabilistic dynamical system satisfies properties encoded as temporal logic formulae (74). To highlight its main concepts, consider the one-dimensional 2.3 ODEs system: . We assume that the initial value of X falls in the interval INIT = [0.5,4]. The dynamics of the system are captured by TRJ, the set of trajectories generated by starting from the points in INIT. Stochasticity becomes relevant by assuming a probability distribution μ over INIT. In other words, μ will assign a probability value to every measurable subset of INIT with the usual properties enjoyed by probability distributions. For ease of discussion, let us assume that μ is the uniform distribution. Then, μ[0.5,1.2] = 0.2. In other words, 0.2 is the probability that a sample drawn uniformly from INIT will fall in the interval [0.5,1.2]. Because a trajectory is uniquely determined by its starting point in INIT, we can identify a set of trajectories T with its set of initial points INITT. An important idea is that a dynamical property, for example, φ, can be identified with the set of trajectories TRJφ that satisfy the property. An example of such a property is “at time t = 2, the value of X is at least 6.5.” The next crucial observation is that a set of trajectories can be identified with the initial points in INIT from which these trajectories can start. This is so because a trajectory is completely determined by its starting point. Thus, with the dynamic property φ, we can associate a set of initial points INITφ, namely, all of the initial points in INIT such that a trajectory φ has the property φ if and only if (iff) its initial point falls in INITφ. By imposing a natural continuity restriction on the functions appearing on the right-hand side of the differential equations (and this restriction will be met by our ODEs system) and choosing a precise logical formalism for describing dynamical properties [in our case, the bounded linear temporal logic (BLTL) detailed below], one can ensure that INITφ will always be a measurable set. Hence, one can assign to φ a probability value Pr(φ) by Pr(φ) = Pr(INITφ). This is the probability that a randomly generated trajectory (that is, one whose initial point is sampled from INIT according to μ) will have the property φ. This at once raises the possibility of statistically verifying whether our ODE system (that is, its set of trajectories) has the property φ. One sets up the null hypothesis H0: Pr(φ) ≥ p and the alternative hypothesis H1: Pr(φ) < p, in which the confidence level p is chosen by the user. One then repeatedly draws samples from TRJ by sampling from INIT according to μ and generating a trajectory of sufficient length (determined by φ) through numerical integration. One then checks whether the trajectory satisfies the property φ, which is trivial in the case in which φ is specified as a formula in BLTL. The standard mechanisms of sequential hypothesis testing can then be used to terminate this test after deciding whether either the null hypothesis or the alternative hypothesis holds. This idea can then be exploited to perform parameter estimation and sensitivity analysis as we now explain in more formal terms. Here, we have used a slightly different, but standard version of the sequential hypothesis testing method (based on an additional parameter called the indifference region). Our temporal logic BLTL is defined over a finite set of atomic propositions (APs), which will be of the form (i, l, u), meaning “the current concentration level of xi falls in the interval [l, u].” The logic operators consist of ∧ (and), ∨ (or), ¬ (negation), and time-bounded U (until), G (global), and F (future). We define the BLTL formulae as follows: (i) every AP and the constants “true” and “false” are BLTL formulae; (ii) if ψ and ψ′ are BLTL formulae, then ¬ ψ, ψ ∧ ψ′, and ψ ∨ ψ′ are BLTL formulae; (iii) if ψ and ψ′ are BLTL formulae and t ≤ T is a positive integer, then ψU≤tψ′, ψUtψ′, F≤tψ′, and G≤tψ′ are BLTL formulae. Because experimental data were available at a finite number of time points, we applied the SMC method to the discrete time points T = {0,1,…,T}. A trajectory in our model is a solution (up to time T) to the ODE system. The maximum time point T is determined by the last time point for which experimental data were available. The notion of a trajectory σ satisfying a BLTL-specified property φ at time point t ∈ T is written as σ,t| = φ and is defined as follows: (i) σ,t| = (i, l, u) iff l ≤ σ(t)(i) ≤ u, where σ(t)(i) is the ith component of vector σ(t). (ii) ∧, ∨, and ¬ are interpreted in the usual way. (iii) σ,t| = ψU≤kψ′ iff there exists k′ such that k′ ≤ k, t + k′ ≤ T, and σ, t + k′ | = ψ′. σ, t + k′′ | = ψ for every 0 ≤ k′′ ≤ k′. (iv) σ, t| = ψUkψ′ iff t + k ≤ Tand σ, t + k| = ψ′. σ, t + k′ | = ψ′ for every 0 ≤ k′ ≤ k. (v) σ, t| = ψF≤kψ iff σ, t| = trueU≤kψ. (vi) σ, t| = ψG≤kψ iff σ, t| = ¬ F≤k ¬ ψ. Let B represent the set of all trajectories of our ODE system, starting from an initial state (the set of all initial concentrations defined in table S1). As explained earlier, we note that the set of trajectories satisfying a BLTL formula ψ, denoted as B(ψ) = {σ|σ, 0| = ψ, σ ∈ B}, can be identified by the corresponding set of initial states, denoted as I(ψ) ⊆ I. Thus, we define probabilistic BLTL formulae in the form of Pr≥θ(ψ), where θ ∈ (0,1], which means that the probability that a trajectory in B belongs to B(ψ) is at least θ. We then use M| = Pr≥θ(ψ) to denote that M, the systems of ODEs, meets the specification ψ with a probability of at least θ. With SMC, properties can be verified, assigned confidence levels and error bounds, or both. Specifically, we verified each property with a sequential hypothesis test between the null hypothesis H0: P ≥ θ + δ and the alternative hypothesis H1: P ≤ θ − δ, where P is the probability of M satisfying ψ, and δ specifies the indifference region. The strength of the test was determined by the parameters α and β, which bound the type I and II errors, respectively. The test proceeds by generating a sequence of sample trajectories σ1, σ2,…. A corresponding sequence of Bernoulli random variables x1, x2, … is assumed, where xk = 1 if σ,0| = ψ and zero otherwise. For each generated sample, we update the score ωn using the function
where n is the number of generated samples. We accept hypothesis H0 if ωn ≥ (1 – β)/α and hypothesis H1 if ωn ≥ β/(1 – α); otherwise, we draw another sample. Our MATLAB/C++ implementation is available at our Web site (www.comp.nus.edu.sg/~rpsysbio/SMC).
Parameter estimation
Unknown parameters were estimated with an SMC-based approach. We encoded the training data in terms of the time series of experimental data and qualitative dynamic trends, which were defined by the respective BLTL formulae ψexp and ψqlty. For each estimate w of unknown parameters, we assumed a prior distribution as w ~ U(0.95w, 10.05w) to take into account the cellular stochasticity. We ran our SMC procedure to evaluate the goodness of w in terms of fitting the training data by verifying Pr≥0.9(ψexp ∧ ψqlty) with the strength of a statistical test (α = 0.05, β = 0.05). Specifically, we quantified the goodness of w using the following objective function:
where is the number of conjuncts in is the number of formulae of the form (a conjunct in ) where Pr ≥0.9 holds with the statistical strength of (α/J, β) , and is the number of conjuncts in ψqlty, where Pr≥0.9(ψl,qlty) holds with the strength (α/J,β). We implemented the stochastic ranking evolutionary strategy (75) to evolve candidate parameters to search for the w values with global minimum objective value F(w) in the parameter solution space. It took a running time of 72 hours to obtain our best-fit parameters set with a machine with two 8-core Intel Xeon E5-2650 2.00-GHz processors and 32 GB of random-access memory. The resulting list of parameters is presented in table S2.
Sensitivity analysis
Local sensitivity analysis was performed with a standard approach (76). Global sensitivity analysis was performed with an SMC-based MPSA method (77). We encoded the time profile of Il12b mRNA abundance (the model output) as a BLTL formula, ψIl12b. The MPSA procedure involves drawing a representative set of samples from the parameter space. For each sampled combination of parameter values w, we computed the objective value F(w) with respect to the ψIl12b. The sampled parameter sets were classified into two classes with a threshold objective value. The sensitivities were then evaluated as Kolmogorov-Smirnov cumulative frequencies associated with the two classes.
Preparation of BMDMs
BMDMs were derived from bone marrow cells extracted from the tibia and femur of 8-week-old female mice. BALB/c mouse BMDMs were used for all experiments except for tests on Stat1-inducible effects where BMDMs were derived from Stat1ind C57B6/J mice (43) and their wild-type C57B6/J counterpart. Bone marrow cells were harvested and cultured in Dulbecco’s modified Eagle’s medium (DMEM; Gibco, Life Technologies) supplemented with 10% (v/v) fetal bovine serum (FBS; HyClone, Thermo Fischer Scientific), mouse recombinant M-CSF (100 U/ml; eBioscience), penicillin (100 U/ml), and streptomycin (100 μg/ml; Gibco, Life Technologies) at a density of 1.5 × 10⁶ cells/ml. Additional complete medium with M-CSF, penicillin, and streptomycin was added 3 days after the cells were plated. The cells were then cultured for another 4 days before the adherent macrophages were harvested. Mouse work was performed under the guidance and regulation of the Institutional Animal Care and Use Committee (protocol no. 049-11).
Cell culture and PAMP treatments
BMDMs and J774 cells were cultured in DMEM supplemented with 10% (v/v) FBS in a 37°C incubator with 5% CO2 and a 95% air supply. BMDMs were plated at a density of 1 × 10⁶ cells/ml and J774 cells were plated at a density of 0.4 × 10⁶ cells/ml. The final concentrations of PAMPs were 10 μg/ml and 25 ng/ml for poly(I:C) and R848 (InvivoGen), respectively.
Western blotting analysis
Cells were lysed with radioimmunoprecipitation assay buffer supplemented with protease and phosphatase inhibitor cocktail (Roche). Total protein (15 μg) was resolved by reducing SDS–polyacrylamide gel electrophoresis (10%) and electrotransferred to polyvinylidene difluoride (PVDF) membranes. The PVDF membranes were subsequently blocked with 5% dry skimmed milk in TBST [50 mM tris-HCl (pH 7.6), 150 mM NaCl, and 0.01% Tween 20] and incubated with specific antibodies: Rabbit polyclonal antibodies against STAT1 (#9172), pSTAT1 S727 (#9177), and pSTAT1 Y701 (#9171) were obtained from Cell Signaling Technology. Mouse monoclonal anti–glyceraldehyde-3-phosphate dehydrogenase antibody (sc-32233) was purchased from Santa Cruz Biotechnology. The PVDF membranes were then incubated with horseradish peroxidase–conjugated rabbit or mouse secondary antibodies (Sigma-Aldrich) and visualized with WesternBright ECL (Advansta) and ImageQuant LAS 4000 mini system (GE Healthcare).
Transfection of cells with siRNAs
For RNA interference experiments, cells were transfected with a scrambled control siRNA (Dharmacon) or ON-TARGETplus SMARTpool siRNA (Dharmacon) against mouse Stat1 (50 nM) with the X-tremeGENE HP DNATransfection Reagent (Roche). Twenty-four hours later, the cells were stimulated with the appropriate PAMPs.
MAPK inhibitors
Inhibitors specific for JNK (SP600125), MEK1/2 (U0126, to prevent ERK activity), and p38 (SB203580) were purchased from Cell Signaling Technology. Cells were first treated with 10 μM inhibitors for 50 min, which was followed by stimulation with the appropriate PAMP. The cell culture medium was not changed after the cells were treated with inhibitor.
Treatment of cells with doxycycline
BMDMs from either wild-type or Stat1ind mice were pretreated with doxycycline 24 hours before being treated with the appropriate PAMP. Doxycycline was purchased from Sigma-Aldrich (cat. #17086-28-1).
qRT-PCR analysis
Total RNA was extracted from cells with TRIzol (Invitrogen). Complementary DNAs were synthesized with SuperScript III Reverse Transcriptase (Invitrogen). The LightCycler 480 Probes Master (Roche) was used for the TaqMan assays, and predesigned TaqMan Gene Expression Assays (Life Technologies) Mm00439620_m1, Mm00438334_m1, Mm00439614_m1, Mm00446190_m1, Mm00434174_m1, and Mm00446968_m1 were used for the detection of Ila, Csf3, Il10, Il6, Il12b, and Hprt mRNAs, respectively. qRT-PCR analysis was performed with the LightCycler 480 System (Roche). The PCR cycles were as follows:1 cycle of 95°C for 10 min, 40 cycles of 95°C for 10 s, and 40 cycles of 60°C for 20 s. The amounts of the cytokine mRNAs of interest were normalized to the amount of Hprt mRNA.
Statistical analysis
Data are presented as means ± SEM based on at least three independent experiments. Statistically significant differences between treatments were analyzed with one-tailed Student’s t test (*P < 0.05, **P < 0.01).
Acknowledgments
We thank M. Muller (Institute of Animal Breeding and Genetics, University of Veterinary Medicine, Vienna) for providing the Stat1ind mice.
Funding: This work was supported by a grant from the National Medical Research Council (Cooperative Basic Research Grant/0055/2014), Singapore. P.S.T. acknowledges partial support from the Singapore Ministry of Education (MOE) Academic Research Council grant MOE2011-T2-2-012 and support from the NIH grant P50-GM107618. I.B. was supported by the NIH awards P41-GM103712 and U19-AI068021.
Footnotes
SUPPLEMENTARY MATERIALS
www.sciencesignaling.org/cgi/content/full/9/436/ra70/DC1
Text
Reference (78)
Author contributions: B.L., Q.L., L.Y., S.K.P., P.S.T., and J.L.D. conceived and designed the research; B.L., Q.L., L.Y., and S.K.P. performed the in silico modeling and experiments; B.L., Q.L., L.Y., S.K.P., I.B., P.S.T., and J.L.D. analyzed the results; and B.L., Q.L., L.Y., S.K.P., I.B., P.S.T., and J.L.D. wrote the paper.
Competing interests: The authors declare that they have no competing interests.
Supplementary Material
REFERENCES AND NOTES
- 1.Gubler U, Chua AO, Hoffman BJ, Collier KJ, Eng J. Cloned cDNA to cholecystokinin mRNA predicts an identical preprocholecystokinin in pig brain and gut. Proc Natl Acad Sci USA. 1984;81:4307–4310. doi: 10.1073/pnas.81.14.4307. [DOI] [PMC free article] [PubMed] [Google Scholar]
- 2.Kawai T, Akira S. The role of pattern-recognition receptors in innate immunity: Update on Toll-like receptors. Nat Immunol. 2010;11:373–384. doi: 10.1038/ni.1863. [DOI] [PubMed] [Google Scholar]
- 3.Takeuchi O, Akira S. Pattern recognition receptors and inflammation. Cell. 2010;140:805–820. doi: 10.1016/j.cell.2010.01.022. [DOI] [PubMed] [Google Scholar]
- 4.Tan RST, Ho B, Leung BP, Ding JL. TLR cross-talk confers specificity to innate immunity. Int Rev Immunol. 2014;33:443–453. doi: 10.3109/08830185.2014.921164. [DOI] [PMC free article] [PubMed] [Google Scholar]
- 5.Zhou L, Nazarian AA, Xu J, Tantin D, Corcoran LM, Smale ST. An inducible enhancer required for Il12b promoter activity in an insulated chromatin environment. Mol Cell Biol. 2007;27:2698–2712. doi: 10.1128/MCB.00788-06. [DOI] [PMC free article] [PubMed] [Google Scholar]
- 6.Krummen M, Balkow S, Shen L, Heinz S, Loquai C, Probst HC, Grabbe S. Release of IL-12 by dendritic cells activated by TLR ligation is dependent on MyD88 signaling, whereas TRIF signaling is indispensable for TLR synergy. J Leukoc Biol. 2010;88:189–199. doi: 10.1189/jlb.0408228. [DOI] [PubMed] [Google Scholar]
- 7.De Nardo D, De Nardo CM, Nguyen T, Hamilton JA, Scholz GM. Signaling crosstalk during sequential TLR4 and TLR9 activation amplifies the inflammatory response of mouse macrophages. J Immunol. 2009;183:8110–8118. doi: 10.4049/jimmunol.0901031. [DOI] [PubMed] [Google Scholar]
- 8.Mäkelä SM, Strengell M, Pietilä TE, Österlund P, Julkunen I. Multiple signaling pathways contribute to synergistic TLR ligand-dependent cytokine gene expression in human monocyte-derived macrophages and dendritic cells. J Leukoc Biol. 2009;85:664–672. doi: 10.1189/jlb.0808503. [DOI] [PubMed] [Google Scholar]
- 9.Bohnenkamp HR, Papazisis KT, Burchell JM, Taylor-Papadimitriou J. Synergism of Toll-like receptor-induced interleukin-12p70 secretion by monocyte-derived dendritic cells is mediated through p38 MAPK and lowers the threshold of T-helper cell type 1 responses. Cell Immunol. 2007;247:72–84. doi: 10.1016/j.cellimm.2007.07.008. [DOI] [PubMed] [Google Scholar]
- 10.Bagchi A, Herrup EA, Warren HS, Trigilio J, Shin HS, Valentine C, Hellman J. MyD88-dependent and MyD88-independent pathways in synergy, priming, and tolerance between TLR agonists. J Immunol. 2007;178:1164–1171. doi: 10.4049/jimmunol.178.2.1164. [DOI] [PubMed] [Google Scholar]
- 11.Napolitani G, Rinaldi A, Bertoni F, Sallusto F, Lanzavecchia A. Selected Toll-like receptor agonist combinations synergistically trigger a T helper type 1–polarizing program in dendritic cells. Nat Immunol. 2005;6:769–776. doi: 10.1038/ni1223. [DOI] [PMC free article] [PubMed] [Google Scholar]
- 12.Zhu Q, Egelston C, Vivekanandhan A, Uematsu S, Akira S, Klinman DM, Belyakov IM, Berzofsky JA. Toll-like receptor ligands synergize through distinct dendritic cell pathways to induce T cell responses: Implications for vaccines. Proc Natl Acad Sci USA. 2008;105:16260–16265. doi: 10.1073/pnas.0805325105. [DOI] [PMC free article] [PubMed] [Google Scholar]
- 13.Tan RS, Lin B, Liu Q, Tucker-Kellogg L, Ho B, Leung BP, Ding JL. The synergy in cytokine production through MyD88-TRIF pathways is co-ordinated with ERK phosphorylation in macrophages. Immunol Cell Biol. 2013;91:377–387. doi: 10.1038/icb.2013.13. [DOI] [PubMed] [Google Scholar]
- 14.Vandenbon A, Teraguchi S, Akira S, Takeda K, Standley DM. Systems biology approaches to toll-like receptor signaling. Wiley Interdiscip Rev Syst Biol Med. 2012;4:497–507. doi: 10.1002/wsbm.1178. [DOI] [PMC free article] [PubMed] [Google Scholar]
- 15.Oda K, Kitano H. A comprehensive map of the toll-like receptor signaling network. Mol Syst Biol. 2006;2:2006.0015. doi: 10.1038/msb4100057. [DOI] [PMC free article] [PubMed] [Google Scholar]
- 16.Li F, Thiele I, Jamshidi N, Palsson BØ. Identification of potential pathway mediation targets in Toll-like receptor signaling. PLOS Comput Biol. 2009;5:e1000292. doi: 10.1371/journal.pcbi.1000292. [DOI] [PMC free article] [PubMed] [Google Scholar]
- 17.Helmy M, Gohda J, Inoue J-i, Tomita M, Tsuchiya M, Selvarajoo K. Predicting novel features of Toll-like receptor 3 signaling in macrophages. PLOS One. 2009;4:e4661. doi: 10.1371/journal.pone.0004661. [DOI] [PMC free article] [PubMed] [Google Scholar]
- 18.Gutiérrez J, Laurent GSt, III, Urcuqui-Inchima S. Propagation of kinetic uncertainties through a canonical topology of the TLR4 signaling network in different regions of biochemical reaction space. Theor Biol Med Model. 2010;7:7. doi: 10.1186/1742-4682-7-7. [DOI] [PMC free article] [PubMed] [Google Scholar]
- 19.Werner SL, Barken D, Hoffmann A. Stimulus specificity of gene expression programs determined by temporal control of IKK activity. Science. 2005;309:1857–1861. doi: 10.1126/science.1113319. [DOI] [PubMed] [Google Scholar]
- 20.Covert MW, Leung TH, Gaston JE, Baltimore D. Achieving stability of lipopolysaccharide-induced NF-κB activation. Science. 2005;309:1854–1857. doi: 10.1126/science.1112304. [DOI] [PubMed] [Google Scholar]
- 21.Basak S, Kim H, Kearns JD, Tergaonkar V, O’Dea E, Werner SL, Benedict CA, Ware CF, Ghosh G, Verma IM, Hoffmann A. A fourth IκB protein within the NF-κB signaling module. Cell. 2007;128:369–381. doi: 10.1016/j.cell.2006.12.033. [DOI] [PMC free article] [PubMed] [Google Scholar]
- 22.Cheong R, Hoffmann A, Levchenko A. Understanding NF-κB signaling via mathematical modeling. Mol Syst Biol. 2008;4:192. doi: 10.1038/msb.2008.30. [DOI] [PMC free article] [PubMed] [Google Scholar]
- 23.Selvarajoo K, Takada Y, Gohda J, Helmy M, Akira S, Tomita M, Tsuchiya M, Inoue J-i, Matsuo K. Signaling flux redistribution at Toll-like receptor pathway junctions. PLOS One. 2008;3:e3430. doi: 10.1371/journal.pone.0003430. [DOI] [PMC free article] [PubMed] [Google Scholar]
- 24.Shih VFS, Kearns JD, Basak S, Savinova OV, Ghosh G, Hoffmann A. Kinetic control of negative feedback regulators of NF-κB/RelA determines their pathogen- and cytokine-receptor signaling specificity. Proc Natl Acad Sci USA. 2009;106:9619–9624. doi: 10.1073/pnas.0812367106. [DOI] [PMC free article] [PubMed] [Google Scholar]
- 25.Litvak V, Ramsey SA, Rust AG, Zak DE, Kennedy KA, Lampano AE, Nykter M, Shmulevich I, Aderem A. Function of C/EBPδ in a regulatory circuit that discriminates between transient and persistent TLR4-induced signals. Nat Immunol. 2009;10:437–443. doi: 10.1038/ni.1721. [DOI] [PMC free article] [PubMed] [Google Scholar]
- 26.Palaniappan S, Gyori B, Liu B, Hsu D, Thiagarajan PS. In: Proceedings of the 11th Computational Methods in Systems Biology. Gupta A, Henzinger TA, editors. Springer; Klosterneuburg: 2013. pp. 120–134. [Google Scholar]
- 27.Hart Y, Alon U. The utility of paradoxical components in biological circuits. Mol Cell. 2013;49:213–221. doi: 10.1016/j.molcel.2013.01.004. [DOI] [PubMed] [Google Scholar]
- 28.Liu Q, Zhu Y, Yong WK, Sze NSK, Tan NS, Ding JL. Cutting edge: Synchronization of IRF1, JunB, and C/EBPβ activities during TLR3–TLR7 cross-talk orchestrates Timely cytokine synergy in the proinflammatory response. J Immunol. 2015;195:801–805. doi: 10.4049/jimmunol.1402358. [DOI] [PMC free article] [PubMed] [Google Scholar]
- 29.Hao S, Baltimore D. The stability of mRNA influences the temporal order of the induction of genes encoding inflammatory molecules. Nat Immunol. 2009;10:281–288. doi: 10.1038/ni.1699. [DOI] [PMC free article] [PubMed] [Google Scholar]
- 30.Kratochvill F, Machacek C, Vogl C, Ebner F, Sedlyarov V, Gruber AR, Hartweger H, Vielnascher R, Karaghiosoff M, Rülicke T, Müller M, Hofacker I, Lang R, Kovarik P. Tristetraprolin-driven regulatory circuit controls quality and timing of mRNA decay in inflammation. Mol Syst Biol. 2011;7:560. doi: 10.1038/msb.2011.93. [DOI] [PMC free article] [PubMed] [Google Scholar]
- 31.Schoenemeyer A, Barnes BJ, Mancl ME, Latz E, Goutagny N, Pitha PM, Fitzgerald KA, Golenbock DT. The interferon regulatory factor, IRF5, is a central mediator of toll-like receptor 7 signaling. J Biol Chem. 2005;280:17005–17012. doi: 10.1074/jbc.M412584200. [DOI] [PubMed] [Google Scholar]
- 32.Doyle S, Vaidya S, O’Connell R, Dadgostar H, Dempsey PW, Wu T-T, Rao G, Sun R, Haberland ME, Modlin RL, Cheng G. IRF3 mediates a TLR3/TLR4-specific antiviral gene program. Immunity. 2002;17:251–263. doi: 10.1016/s1074-7613(02)00390-4. [DOI] [PubMed] [Google Scholar]
- 33.Oeckinghaus A, Hayden MS, Ghosh S. Crosstalk in NF-κB signaling pathways. Nat Immunol. 2011;12:695–708. doi: 10.1038/ni.2065. [DOI] [PubMed] [Google Scholar]
- 34.Platanias LC. Mechanisms of type-I- and type-II-interferon-mediated signalling. Nat Rev Immunol. 2005;5:375–386. doi: 10.1038/nri1604. [DOI] [PubMed] [Google Scholar]
- 35.Yang CH, Murti A, Pfeffer LM. Interferon induces NF-κB-inducing kinase/tumor necrosis factor receptor-associated factor-dependent NF-κB activation to promote cell survival. J Biol Chem. 2005;280:31530–31536. doi: 10.1074/jbc.M503120200. [DOI] [PMC free article] [PubMed] [Google Scholar]
- 36.Yang CH, Murti A, Pfeffer SR, Kim JG, Donner DB, Pfeffer LM. IFNα/β promotes cell survival by activating NF-κB through phosphatidylinositol-3-kinase and Akt. J Biol Chem. 2001;276:13756–13761. doi: 10.1074/jbc.M011006200. [DOI] [PubMed] [Google Scholar]
- 37.Newton K, Dixit VM. Signaling in innate immunity and inflammation. Cold Spring Harb Perspect Biol. 2012;4:a006049. doi: 10.1101/cshperspect.a006049. [DOI] [PMC free article] [PubMed] [Google Scholar]
- 38.Pattison MJ, Mackenzie KF, Arthur JSC. Inhibition of JAKs in macrophages increases lipopolysaccharide-induced cytokine production by blocking IL-10–mediated feedback. J Immunol. 2012;189:2784–2792. doi: 10.4049/jimmunol.1200310. [DOI] [PMC free article] [PubMed] [Google Scholar]
- 39.Murray PJ. Understanding and exploiting the endogenous interleukin-10/STAT3-mediated anti-inflammatory response. Curr Opin Pharmacol. 2006;6:379–386. doi: 10.1016/j.coph.2006.01.010. [DOI] [PubMed] [Google Scholar]
- 40.Gitlin L, Barchet W, Gilfillan S, Cella M, Beutler B, Flavell RA, Diamond MS, Colonna M. Essential role of mda-5 in type I IFN responses to polyriboinosinic:polyribocytidylic acid and encephalomyocarditis picornavirus. Proc Natl Acad Sci USA. 2006;103:8459–8464. doi: 10.1073/pnas.0603082103. [DOI] [PMC free article] [PubMed] [Google Scholar]
- 41.Loo YM, Gale M., Jr Immune signaling by RIG-I-like receptors. Immunity. 2011;34:680–692. doi: 10.1016/j.immuni.2011.05.003. [DOI] [PMC free article] [PubMed] [Google Scholar]
- 42.Lipniacki T, Paszek P, Brasier AR, Luxon B, Kimmel M. Mathematical model of NF-κB regulatory module. J Theor Biol. 2004;228:195–215. doi: 10.1016/j.jtbi.2004.01.001. [DOI] [PubMed] [Google Scholar]
- 43.Leitner NR, Lassnig C, Rom R, Heider S, Bago-Horvath Z, Eferl R, Müller S, Kolbe T, Kenner L, Rülicke T, Strobl B, Müller M. Inducible, dose-adjustable and time-restricted reconstitution of STAT1 deficiency in vivo. PLOS One. 2014;9:e86608. doi: 10.1371/journal.pone.0086608. [DOI] [PMC free article] [PubMed] [Google Scholar]
- 44.Kim D, Kwon YK, Cho KH. The biphasic behavior of incoherent feed-forward loops in biomolecular regulatory networks. BioEssays. 2008;30:1204–1211. doi: 10.1002/bies.20839. [DOI] [PubMed] [Google Scholar]
- 45.Sadzak I, Schiff M, Gattermeier I, Glinitzer R, Sauer I, Saalmüller A, Yang E, Schaljo B, Kovarik P. Recruitment of Stat1 to chromatin is required for interferon-induced serine phosphorylation of Stat1 transactivation domain. Proc Natl Acad Sci USA. 2008;105:8944–8949. doi: 10.1073/pnas.0801794105. [DOI] [PMC free article] [PubMed] [Google Scholar]
- 46.Cazalis J, Bodet C, Gagnon G, Grenier D. Doxycycline reduces lipopolysaccharide-induced inflammatory mediator secretion in macrophage and ex vivo human whole blood models. J Periodontol. 2008;79:1762–1768. doi: 10.1902/jop.2008.080051. [DOI] [PubMed] [Google Scholar]
- 47.Krakauer T, Buckley M. Doxycycline is anti-inflammatory and inhibits staphylococcal exotoxin-induced cytokines and chemokines. Antimicrob Agents Chemother. 2003;47:3630–3633. doi: 10.1128/AAC.47.11.3630-3633.2003. [DOI] [PMC free article] [PubMed] [Google Scholar]
- 48.Wenta N, Strauss H, Meyer S, Vinkemeier U. Tyrosine phosphorylation regulates the partitioning of STAT1 between different dimer conformations. Proc Natl Acad Sci USA. 2008;105:9238–9243. doi: 10.1073/pnas.0802130105. [DOI] [PMC free article] [PubMed] [Google Scholar]
- 49.Bafica A, Scanga CA, Feng CG, Leifer C, Cheever A, Sher A. TLR9 regulates Th1 responses and cooperates with TLR2 in mediating optimal resistance to Mycobacterium tuberculosis. J Exp Med. 2005;202:1715–1724. doi: 10.1084/jem.20051782. [DOI] [PMC free article] [PubMed] [Google Scholar]
- 50.Tabeta K, Georgel P, Janssen E, Du X, Hoebe K, Crozat K, Mudd S, Shamel L, Sovath S, Goode J, Alexopoulou L, Flavell RA, Beutler B. Toll-like receptors 9 and 3 as essential components of innate immune defense against mouse cytomegalovirus infection. Proc Natl Acad Sci USA. 2004;101:3516–3521. doi: 10.1073/pnas.0400525101. [DOI] [PMC free article] [PubMed] [Google Scholar]
- 51.Panda A, Qian F, Mohanty S, van Duin D, Newman FK, Zhang L, Chen S, Towle V, Belshe RB, Fikrig E, Allore HG, Montgomery RR, Shaw AC. Age-associated decrease in TLR function in primary human dendritic cells predicts influenza vaccine response. J Immunol. 2010;184:2518–2527. doi: 10.4049/jimmunol.0901022. [DOI] [PMC free article] [PubMed] [Google Scholar]
- 52.Della Bella S, Bierti L, Presicce P, Arienti R, Valenti M, Saresella M, Vergani C, Villa ML. Peripheral blood dendritic cells and monocytes are differently regulated in the elderly. Clin Immunol. 2007;122:220–228. doi: 10.1016/j.clim.2006.09.012. [DOI] [PubMed] [Google Scholar]
- 53.Huang X, Hua J, Shen N, Chen S. Dysregulated expression of interleukin-23 and interleukin-12 subunits in systemic lupus erythematosus patients. Mod Rheumatol. 2007;17:220–223. doi: 10.1007/s10165-007-0568-9. [DOI] [PubMed] [Google Scholar]
- 54.Metsarinne KP, Nordström DC, Konttinen YT, Teppo AM, Fyhrquist FY. Plasma interleukin-6 and renin substrate in reactive arthritis, rheumatoid arthritis, and systemic lupus erythematosus. Rheumatol Int. 1992;12:93–96. doi: 10.1007/BF00290261. [DOI] [PubMed] [Google Scholar]
- 55.Li S, Wang L, Berman M, Kong YY, Dorf ME. Mapping a dynamic innate immunity protein interaction network regulating type I interferon production. Immunity. 2011;35:426–440. doi: 10.1016/j.immuni.2011.06.014. [DOI] [PMC free article] [PubMed] [Google Scholar]
- 56.Hoffmann A, Levchenko A, Scott ML, Baltimore D. The IκB-NF-κB signaling module: Temporal control and selective gene activation. Science. 2002;298:1241–1245. doi: 10.1126/science.1071914. [DOI] [PubMed] [Google Scholar]
- 57.O’Dea EL, Barken D, Peralta RQ, Tran KT, Werner SL, Kearns JD, Levchenko A, Hoffmann A. A homeostatic model of IκB metabolism to control constitutive NF-κB activity. Mol Syst Biol. 2007;3:111. doi: 10.1038/msb4100148. [DOI] [PMC free article] [PubMed] [Google Scholar]
- 58.Longo DM, Selimkhanov J, Kearns JD, Hasty J, Hoffmann A, Tsimring LS. Dual delayed feedback provides sensitivity and robustness to the NF-κB signaling module. PLOS Comput Biol. 2013;9:e1003112. doi: 10.1371/journal.pcbi.1003112. [DOI] [PMC free article] [PubMed] [Google Scholar]
- 59.Shinohara H, Behar M, Inoue K, Hiroshima M, Yasuda T, Nagashima T, Kimura S, Sanjo H, Maeda S, Yumoto N, Ki S, Akira S, Sako Y, Hoffmann A, Kurosaki T, Okada-Hatakeyama M. Positive feedback within a kinase signaling complex functions as a switch mechanism for NF-κB activation. Science. 2014;344:760–764. doi: 10.1126/science.1250020. [DOI] [PubMed] [Google Scholar]
- 60.Tay S, Hughey JJ, Lee TK, Lipniacki T, Quake SR, Covert MW. Single-cell NF-κB dynamics reveal digital activation and analogue information processing. Nature. 2010;466:267–271. doi: 10.1038/nature09145. [DOI] [PMC free article] [PubMed] [Google Scholar]
- 61.Liu B, Zhang J, Tan PY, Hsu D, Blom AM, Leong B, Sethi S, Ho B, Ding JL, Thiagarajan PS. A computational and experimental study of the regulatory mechanisms of the complement system. PLOS Comput Biol. 2011;7:e1001059. doi: 10.1371/journal.pcbi.1001059. [DOI] [PMC free article] [PubMed] [Google Scholar]
- 62.Shnyra A, Brewington R, Alipio A, Amura C, Morrison DC. Reprogramming of lipopolysaccharide-primed macrophages is controlled by a counterbalanced production of IL-10 and IL-12. J Immunol. 1998;160:3729–3736. [PubMed] [Google Scholar]
- 63.Biswas SK, Lopez-Collazo E. Endotoxin tolerance: New mechanisms, molecules and clinical significance. Trends Immunol. 2009;30:475–487. doi: 10.1016/j.it.2009.07.009. [DOI] [PubMed] [Google Scholar]
- 64.Fu Y, Glaros T, Zhu M, Wang P, Wu Z, Tyson JJ, Li L, Xing J. Network topologies and dynamics leading to endotoxin tolerance and priming in innate immune cells. PLOS Comput Biol. 2012;8:e1002526. doi: 10.1371/journal.pcbi.1002526. [DOI] [PMC free article] [PubMed] [Google Scholar]
- 65.Fu Y, Jiang X, Zhang H, Xing J. A strategy to study pathway cross-talks of cells under repetitive exposure to stimuli. BMC Syst Biol. 2012;6(suppl. 3):S6. doi: 10.1186/1752-0509-6-S3-S6. [DOI] [PMC free article] [PubMed] [Google Scholar]
- 66.Alon U. Network motifs: Theory and experimental approaches. Nat Rev Genet. 2007;8:450–461. doi: 10.1038/nrg2102. [DOI] [PubMed] [Google Scholar]
- 67.Boyer LA, Lee TI, Cole MF, Johnstone SE, Levine SS, Zucker JP, Guenther MG, Kumar RM, Murray HL, Jenner RG, Gifford DK, Melton DA, Jaenisch R, Young RA. Core transcriptional regulatory circuitry in human embryonic stem cells. Cell. 2005;122:947–956. doi: 10.1016/j.cell.2005.08.020. [DOI] [PMC free article] [PubMed] [Google Scholar]
- 68.Milo R, Shen-Orr S, Itzkovitz S, Kashtan N, Chklovskii D, Alon U. Network motifs: Simple building blocks of complex networks. Science. 2002;298:824–827. doi: 10.1126/science.298.5594.824. [DOI] [PubMed] [Google Scholar]
- 69.Purvis JE, Lahav G. Encoding and decoding cellular information through signaling dynamics. Cell. 2013;152:945–956. doi: 10.1016/j.cell.2013.02.005. [DOI] [PMC free article] [PubMed] [Google Scholar]
- 70.Kawai T, Akira S. Toll-like receptors and their crosstalk with other innate receptors in infection and immunity. Immunity. 2011;34:637–650. doi: 10.1016/j.immuni.2011.05.006. [DOI] [PubMed] [Google Scholar]
- 71.Takahashi K, Asabe S, Wieland S, Garaigorta U, Gastaminza P, Isogawa M, Chisari FV. Plasmacytoid dendritic cells sense hepatitis C virus-infected cells, produce interferon, and inhibit infection. Proc Natl Acad Sci USA. 2010;107:7431–7436. doi: 10.1073/pnas.1002301107. [DOI] [PMC free article] [PubMed] [Google Scholar]
- 72.Kuttykrishnan S, Sabina J, Langton LL, Johnston M, Brent MR. A quantitative model of glucose signaling in yeast reveals an incoherent feed forward loop leading to a specific, transient pulse of transcription. Proc Natl Acad Sci USA. 2010;107:16743–16748. doi: 10.1073/pnas.0912483107. [DOI] [PMC free article] [PubMed] [Google Scholar]
- 73.Hindmarsh AC, Brown PN, Grant KE, Lee SL, Serban R, Shumaker DE, Woodward CS. SUNDIALS: Suite of nonlinear and differential/algebraic equation solvers. ACM T Math Software. 2005;31:363–396. [Google Scholar]
- 74.Younes HLS, Kwiatkowska M, Norman G, Parker D. Numerical vs. statistical probabilistic model checking. Int J Softw Tools Technol Transf. 2006;8:216–228. [Google Scholar]
- 75.Runarsson TP, Yao X. Stochastic ranking for constrained evolutionary optimization. IEEE Trans Evol Comput. 2000;4:284–294. [Google Scholar]
- 76.Liu B, Thiagarajan PS. Modeling and analysis of biopathways dynamics. J Bioinform Comput Biol. 2012;10:1231001. doi: 10.1142/S0219720012310014. [DOI] [PubMed] [Google Scholar]
- 77.Cho KH, Kolch W, Shin SY, Wolkenhauer O. Experimental design in systems biology, based on parameter sensitivity analysis using a Monte Carlo method: A case study for the TNFα-mediated NF-κB signal transduction pathway. Simulation. 2003;79:726–739. [Google Scholar]
- 78.Mangan S, Alon U. Structure and function of the feed-forward loop network motif. Proc Natl Acad Sci USA. 2003;100:11980–11985. doi: 10.1073/pnas.2133841100. [DOI] [PMC free article] [PubMed] [Google Scholar]
Associated Data
This section collects any data citations, data availability statements, or supplementary materials included in this article.