Abstract
Background and Purpose
To evaluate whether breath-holding (BH) BOLD fMRI can quantify differences in vascular reactivity (VR), as there is a need for improved contrast mechanisms in gliomas.
Methods
16 patients (gliomas, grade II=5, III=2, IV=9) were evaluated using the BH paradigm: 4second single deep breath followed by 16seconds of BH and 40seconds of regular breathing for 5 cycles. VR was defined as the difference in BOLD signal between the minimal signal seen at the end of the deep breath and maximal signal seen at the end of BH (peak-to-trough). VR was measured for every voxel and compared for gray vs. white matter and tumor vs. normal contralateral brain. VR maps were compared to the areas of enhancement and FLAIR/T2 abnormality.
Results
VR was significantly lower in normal white matter than gray matter (p<0.05) and in tumors compared to the normal, contralateral brain (p<0.002). The area of abnormal VR (1103±659mm2) was significantly greater (p=0.019) than the enhancement (543±530mm2), but significantly smaller (p=0.0011) than the FLAIR abnormality (2363±1232mm2). However, the variability in the areas of gadolinium contrast enhancement versus VR abnormality indicates that the contrast mechanism elicited by BH (caused by abnormal arteriolar smooth muscles) appears to be fundamentally different from the contrast mechanism of gadolinium enhancement (caused by the presence of “leaky” gap junctions).
Conclusions
BH maps based on peak-to-trough can be used to characterize VR in brain tumors. VR maps in brain tumor patients appear to be caused by a different mechanism than gadolinium enhancement.
Introduction
Gliomas are the most common brain neoplasms in adults1. Conventional magnetic resonance imaging (MRI) with gadolinium-based contrast has been shown to be useful in the characterization of gliomas2–3. The presence of contrast enhancement identifies areas of breakdown of the blood-brain-barrier (BBB)4; consequently, contrast enhancement is an incomplete biomarker for histological grade5–7. Similarly, recent advances in glioma therapy have highlighted further limitations in contrast enhanced MRI including the increase in enhancement notwithstanding a positive treatment effect of radiation and temozolomide (“pseudoprogression”) 8–10 as well as a decrease in enhancement in patients undergoing therapy with bevacizumab (“pseudoresponse”)11–13. Therefore, another parameter, independent of the breakdown of the BBB, would be of clinical interest in the characterization and evaluation of gliomas, as well as the effects of various treatment regimens.
In the normal cerebral vasculature, hypercapnia causes vasodilatation of cerebral arteries by endothelial smooth muscle cell relaxation14–16. Hypercapnia can be achieved by breath-holding (BH)17. It is well established that changes in the depth and rate of breathing result in variations in the arterial level of CO2, a potent vasodilator18. The neurovascular response to BH leads to an increase in cerebral blood flow (CBF) and cerebral blood volume (CBV); however, it does not affect cerebral metabolic rate of O2 (CMRO2) consumption17. This process translates to a decrease in deoxyhemoglobin levels and a consequential increase in the MR blood oxygenation level-dependent (BOLD) signal. One of the hallmarks of a malignant glioma is the presence of abnormal neovasculature with a diminished response to the partial pressures of CO2 and O2 in the blood. Hence, the diminished vascular response to BH in gliomas leads to a corresponding decrease in the BOLD signal change19.
It is important to note that the mechanism by which hypercapnia induces changes in the MR signal is fundamentally different than gadolinium-based contrast enhancement. The former is due to a decreased level of normal smooth muscle cells in the newly formed arterioles of gliomas (neovasculature)19–20, whereas the latter is due to abnormally permeable blood-brain barrier 4. Therefore, a map of vascular reactivity generated from changes of BOLD signal caused by BH could be of clinical significance in evaluation of brain tumors.
Breath-holding MRI was evaluated in 6 low-grade gliomas and one high-grade glioma by Hsu et al.20 and in six low-grade gliomas by Pillai et al 21. They found a decrease in BOLD signal enhancement in the tumors versus normal brain in all patients and concluded that BH can disclose differences in cerebrovascular response between normal and glioma tissue 20. However, they did not compare maps of vascular reactivity (VR) generated using BH to Gd-based contrast enhancement and FLAIR. Comparing Gd-based contrast enhancement and FLAIR to a VR map may be important because Gd-enhancement images underestimate tumor volume while FLAIR overestimates tumor volume (because it includes both tumor and edema)22–23. Therefore, it appears reasonable to suggest that efforts could be undertaken to establish if VR maps may be a more reliable indicator of tumor volume.
The purpose of this study was to generate VR maps during BH in patients with glial tumors of different grades. We compared gray matter versus white matter in normal appearing brain and tumor versus contralateral normal tissue using quantifiable VR parameters. In this study, we introduce a new parameter called “peak-to-trough” as an indicator of the vascular reactivity during the breath holding performance. In addition, we compared the VR maps of the tumors to Gd-enhancement and FLAIR. We hypothesized that 1) the VR in gliomas and the VR of the normal, contralateral brain would be significantly different and 2) the area of the VR maps would differ significantly from the areas of Gd-enhancement and FLAIR abnormality.
Materials and Methods
Subjects
16 consecutive patients (7 women, 9 men) between ages 35 and 62 (mean = 53) with gliomas were reviewed. The pathology of the tumors was determined through histological evaluation according to the revised World Health Organization criteria and included 5 Grade II gliomas (2 oligodendrogliomas and 3 astrocytomas), 2 grade III gliomas and 9 Grade IV gliomas. At the time of the scans, all patients were treatment naïve. The Institutional Review Board (IRB) approved this retrospective study, which was in full compliance with HIPAA regulations
Routine MRI
Scanning was performed on a GE 1.5T magnet (Milwaukee, Wisconsin) using a standard quadrature head coil. Anatomical images were obtained using the following imaging sequences: T1-weighted spin-echo images (TR/TE = 400ms/14ms, 256x256 matrix; 4.5 mm thickness); T2-weighted spin echo (TR/TE = 4000ms/102ms, 256x256 matrix; 4.5 mm thickness) and FLAIR (TR/TE = 10000/106, inversion time 220ms, 90° flip angle; 256x256 matrix; 4.5 mm thickness; T1-weighted 3D-spoiled GRASS sequence (TR/TE = 6.9ms/3ms; 15° flip angle; 256x256 matrix; 1.5 mm thickness); T1 post contrast for Gd contrast enhancement (TR/TE= 600ms/20ms, 90° flip angle; 256x160 matrix; 4.5 mm thickness). The field of view (FOV ) for all sequences was 240 mm.
BH MRI
BH functional data were acquired using a gradient-echo echo-planar imaging (EPI) with the following parameters: TR/TE= 4000ms/40ms, 128×128 matrix, 4.5mm thickness, 90° flip angle. The BH paradigm comprised of 5 periodic BH cycles during which patients were instructed to take a deep breath for 4s, followed by 16s of BH and 40s of regular breathing in response to an aural cue. The functional BH and anatomic T1 and T2-weighted images were acquired with the same number of sections and orientation for anatomic co-registration of observed activations. The paradigm was rehearsed with all patients and practiced prior to the scans. All patients were able to perform the BH paradigm outside the magnet and during the scan.
Data Analysis
Data was preprocessed using Analysis of Functional Neuroimaging (AFNI) [http://afni.nimh.nih.gov]. Slice timing correction and head motion correction was performed using 3D rigid-body registration. The linear trend was removed if necessary. Spatial smoothing (Gaussian filter with 4mm full width of half maximum) was applied to improve the signal to noise ratio. MATLAB (MathWorks, Inc, Natick, MA) was used for the time course analysis. All scans were checked for excessive head motion, low SNR, susceptibility artifacts by both the physicist and clinical neuroradiologist in our group.
Vascular reactivity maps
One slice of interest for each patient, which depicted the largest tumor area, was identified by a CAQ certified neuroradiologist with 20 years experience. The time-series of the 5 BH cycles were averaged for every patient. The parameter, termed “peak-to-trough”, was defined as the BOLD signal difference between minimal signal seen at the end of the deep breath and the maximal signal seen at the end of BH cycle. The “peak-to-trough” parameter is a linear value and was calculated for every voxel on the selected image.
VR maps were generated by displaying peak-to-trough from the BH time-course of every voxel for every patient. The parameter reflects the difference between an initial decrease in the BOLD signal, due to emptying of venous blood from the brain into the chest (due to the initial deep breath) and the subsequent increase in BOLD signal due to increase in CO2 in the blood vessels of the brain (resulting from holding one’s breath) (Figure 1). In addition, the 4 seconds of deep breath leads to a transient decrease of arterial CO2 (hypocapnia) while the opposite occurs during the 16 seconds of breath holding (an increase of arterial CO2 - hypercapnia). Both effects probably contribute to the time-course of BOLD signal intensity and to the resulting “peck-to-trough” value. Preliminary analysis demonstrated inordinately high values in the venous sinuses. Therefore, to mask the signal intensity of the venous sinuses, a threshold of twice the standard deviation from the mean peak-to-trough was used as a cu off. Values above that cut off value were set to the threshold value. Vascular reactivity maps were normalized to one, with one representing the maximum vascular reactivity and zero representing zero vascular reactivity. An initial 40 sec of baseline signal was obtained at the beginning of each paradigm with the patient at rest. For normalization, the mean of the 40 sec baseline T2* BOLD signal was subtracted by the time course. The time course was then scaled between −1 and 1; that is by dividing the signal by the maximum absolute value of the signal.
Fig 1.
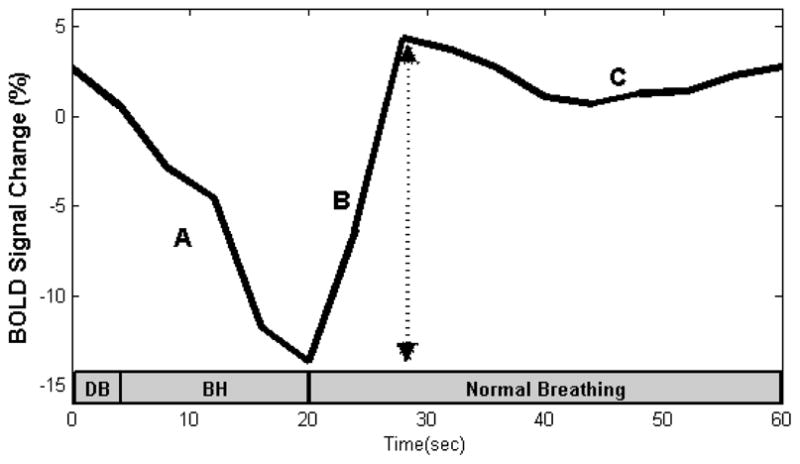
A representative time-course of the BOLD signal intensity during the breath holding (BH) paradigm. The signal drop during (A) is due to venous blood drainage from the brain into the chest due to deep inspiration. The signal increase during (B) is due to an increase of CO2 following breath-holding, and (C) recovery of normal blood flow after resumption of normal breathing. The arrow indicates the peak-to-trough difference. Gray bar represents duration of breathing and breath-hold. DB = deep breath, BH = breath-hold.
White Matter vs. Gray Matter
Segmentation of gray and white matter using T1 weighted 3D SPGR sequence was performed by FSL (using Brain Extraction Tool and Automated Segmentation Tool)(http://fsl.fmrib.ox.ac.uk). Example of gray and white matter segmentation is depicted in Figure 2. The “peak-to-trough” values of the grey and white matter were compared for each patient and for the entire cohort.
Fig 2.
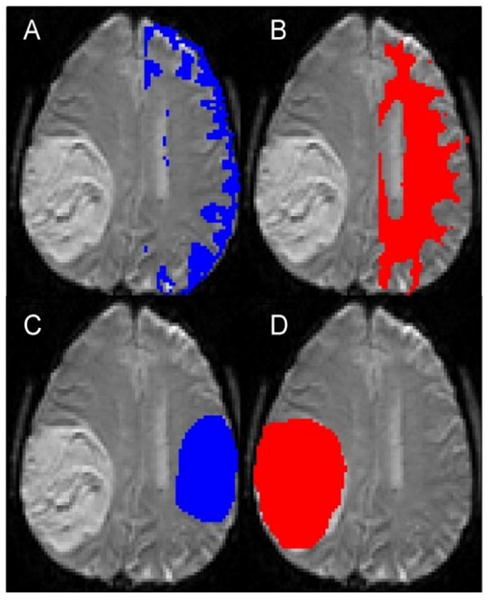
Examples show segmentation of gray matter (A) and white matter (B), contralateral normal-appearing brain (C) and tumor (D) ROIs. The normal appearing brain ROI does not exactly match the tumor ROI in terms of size, as increasing the size would have lead to inclusion of the lateral ventricle.
Tumor vs. normal contralateral hemisphere
The same neuroradiologist also generated ROI’s of the tumor area and the normal contralateral hemisphere. The “peak-to-trough” values of the tumor and normal-appearing brain ROIs were compared for each patient and for the entire cohort.
Vascular reactivity maps were also compared to the corresponding FLAIR and Gd–enhanced images. Measurements of areas of FLAIR abnormality, Gd-enhancement and abnormal vascular reactivity were obtained by manual segmentation by the same neuroradiologist by visual inspection
Statistical Analysis
A non-parametric two-sided Wilcoxon signed rank was performed for comparison of the data with statistical significance set at p <0.05.
RESULTS
General Findings
A representative time-series is shown in Figure 1. An initial decrease in BOLD signal, due to the emptying of venous blood from the brain into the chest is seen. The subsequent increase in BOLD signal is due to increase in CO2 in the brain parenchyma resulting from BH. The plateau is due to recovery of normal blood flow after resumption of normal breathing.
White Matter vs. Gray Matter
In normal brain, gray matter showed a significantly larger peak-to-trough BOLD signal difference than white matter (1.3+0.8% vs. 0.8±0.3%, p<0.05) reflecting a larger vascular reactivity. The average time-series is shown in Figure 3A.
Fig 3.
Averaged time-courses for the segmented brain demonstrate a larger peak-to-trough in gray matter compared to white matter (A). Averaged time-courses demonstrated a smaller peak-to-trough in brain tumors than normal tissue with the peak occurring slightly later in tumors. When the time-courses were separated by tumor grade, the normal side tissue shows the expected shape from the BH paradigm performed (C), however, the tumor side tissue lacks the expected shape, and exhibits a noisier time course (D).
Tumor vs. Normal Contralateral Hemisphere, curve analysis
The peak-to-trough difference was significantly decreased in the tumor ROI, when compared to the normal contralateral ROI (0.6±0.8 %, vs 1.2±0.5% vs. p<0.002), reflecting a decrease in vascular reactivity of the abnormal tumor neovasculature (Figure 3B). There was a decrease in both the peak and the trough of the time-course (Fig 3B). The trough was reached on average 4 seconds later in the tumor ROI, compared to the normal side. The peak was not as well defined in the tumor population but was also reached an average of 8 seconds later. For the purpose of this calculation, we used the first peak, for example in figure 3B, this would be the peak seen at 36 seconds, rather than at 48 seconds.
When analyzing each pathological category separately, the “peak to trough” curves of the different tumor grades revealed the same trend. Statistical significance was p=0.0019, p=0.0625, and p=0.0186 for all patients, grade II only, and combined grade III and IV respectively (Table 1). In time-course analysis, the normal contralateral tissue exhibited the expected shape from the BH paradigm (Figure 3C). However, in tumor tissue (Figure 3D), the expected shape was distorted: the tumor tissue exhibited a smaller average trough, a smaller average peak and a noisier time-course compared to normal tissue.
Table 1.
Comparison of peak-to-trough of the tumor ROI to the normal contralateral ROI using Wilcoxon Rank Sum test.
| Grade | # of Patients | Normal Tissue BOLD % change (Mean ± SD) | Tumor Tissue BOLD % change (Mean ± SD) | P-value |
|---|---|---|---|---|
| All Patients | 16 | 1.2±0.5 | 0.6±0.8 | 1.7× 10⁻⁴ |
| Grade II | 5 | 0.9±0.2 | 0.4±0.4 | 0. 0043 |
| Grade III | 2 | 1.5±0.6 | 0.6±0.07 | 0. 23 |
| Grade IV | 9 | 1.3±1.0 | 0.7±0.5 | 0. 016 |
Comparison of the VR maps to the areas of enhancement and FLAIR abnormality
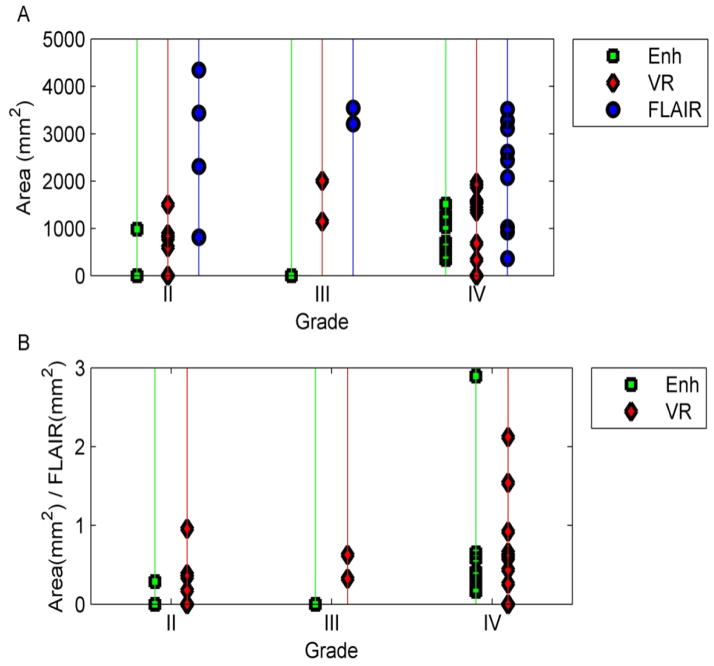
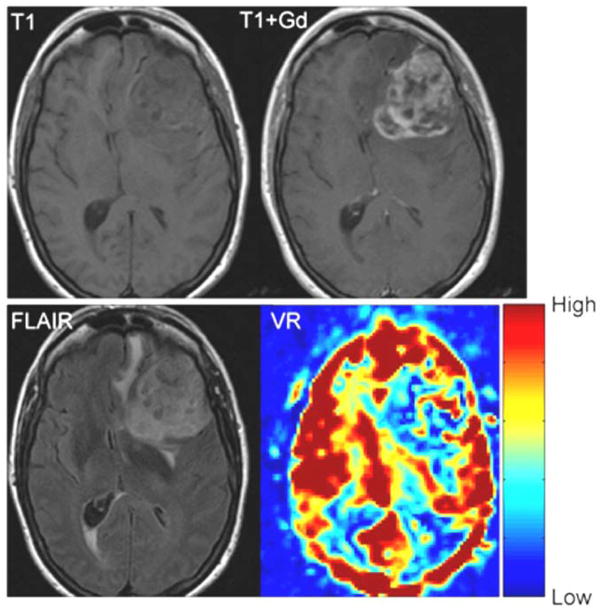
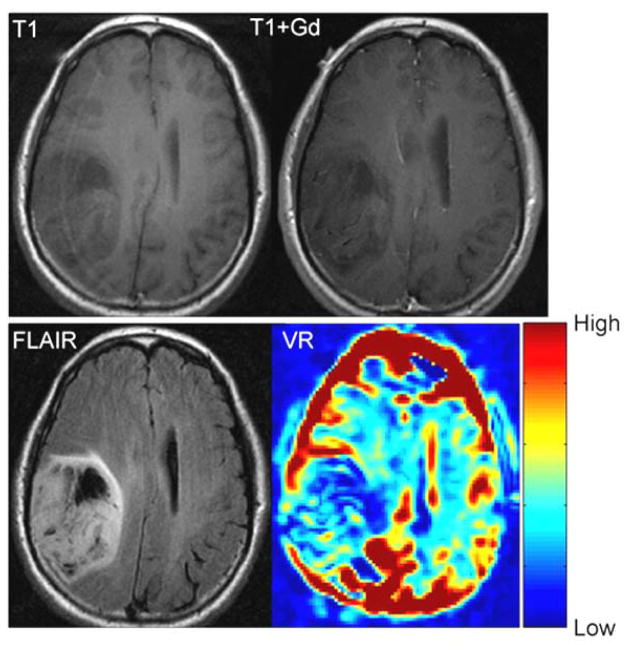
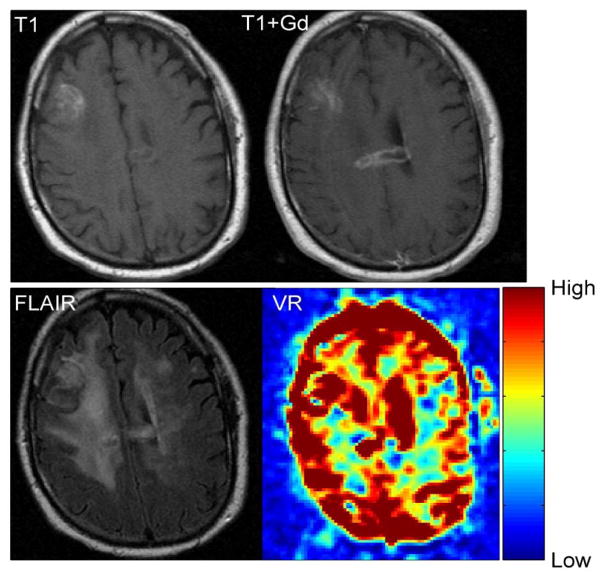
The average area of abnormal VR (1103±659 mm2) was significantly greater (p = 0.019) than the average area of enhancement (543±530 mm2), but it was significantly smaller (p = 0.0011) than the average area of the FLAIR abnormality (2363±1232 mm2) (Table 2 and Figure 4). However, variability was seen in individual cases. For example, in patient #11, the volume of enhancement, FLAIR abnormality and VR abnormality were similar (Figure 5). In patient #6, however, there was no enhancement of the tumor, but a prominent decrease in vascular reactivity (Figure 6). In patient #10, the tumor enhanced but no area of abnormal vascular reactivity was seen (Figure 7). In patient #1, the tumor was non-enhancing and no area of abnormal vascular reactivity was seen (Figure 8).
Table 2.
Measurements of area of Enhancement, FLAIR abnormality and abnormal VR
| Patient | Pathology | Grade | Enhancement (mm2) | FLAIR (mm2) | Abnormal VR (mm2) |
|---|---|---|---|---|---|
| 1 | Oligodendroglioma | II | 806 | 806 | 0 |
| 2 | Astrocytoma | II | 982 | 441 | 600 |
| 3 | Astrocytoma | II | 0 | 4347 | 1500 |
| 4 | Astrocytoma | II | 0 | 2312 | 876 |
| 5 | Oligoastrocytoma | II | 0 | 821 | 786 |
| 6 | Anaplastic Astrocytoma | III | 0 | 3212 | 2003 |
| 7 | Anaplastic Astrocytoma | III | 0 | 3545 | 1143 |
| 8 | Glioblastoma | IV | 1278 | 3514 | 1539 |
| 9 | Glioblastoma | IV | 709 | 2438 | 1421 |
| 10 | Glioblastoma | IV | 616 | 3277 | 0 |
| 11 | Glioblastoma | IV | 1202 | 3109 | 1888 |
| 12 | Glioblastoma | IV | 423 | 1020 | 1572 |
| 13 | Glioblastoma | IV | 605 | 926 | 1962 |
| 14 | Glioblastoma | IV | 1036 | 358 | 330 |
| 15 | Glioblastoma | IV | 337 | 2073 | 1356 |
| 16 | Glioblastoma | IV | 1513 | 2612 | 676 |
Fig 4.
(A) Comparison of areas of enhancement, VR and FLAIR for patients with different tumor grades. The average area of VR lies between the area of enhancement and FLAIR. In (B), the areas of enhancement and VR were normalized to the area of FLAIR. Here, the area of VR is larger than that of enhancement, but with a degree of variability.
Fig 5.
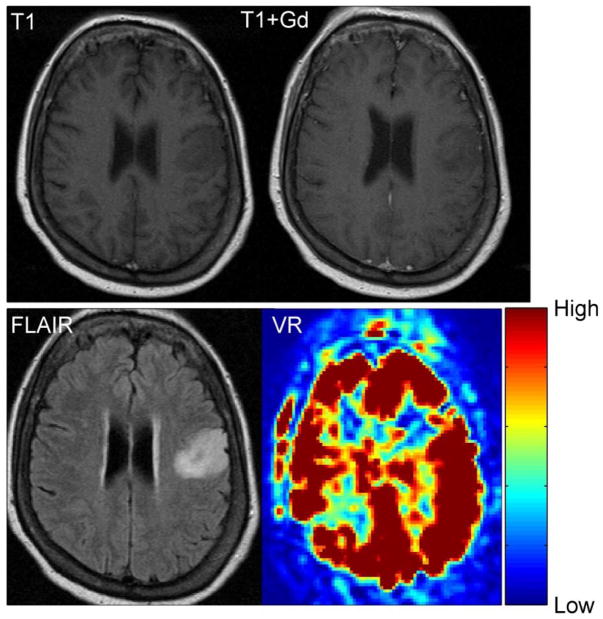
T1 weighted, T1-weighted post contrast, FLAIR and VR map in a patient with a glioblastoma multiforme (Patient 11). The red areas show high VR and the blue areas show low VR. In normal appearing brain the gray matter shows high VR with a lower VR in the white matter. The volume of enhancement, FLAIR abnormality and VR abnormality are similar in this case
Fig 6.
T1 weighted, T1-weighted post contrast, FLAIR and VR maps in an anaplastic astrocytoma (grade III) (Patient 6). There is no appreciable enhancement. The area of FLAIR and VR abnormality are similar in size.
Fig 7.
T1 weighted, T1-weighted post contrast, FLAIR and VR maps in a glioblastoma multiforme (Patient 10). No appreciable VR abnormality is seen in the area of enhancement.
Fig 8.
T1 weighted, T1-weighted post contrast, FLAIR and VR maps in low-grade astrocytoma (grade II) (Patient 1). There is no appreciable enhancement. No abnormal VR is observed in this non-enhancing tumor.
DISCUSSION
Gadolinium contrast enhancement is due to breakdown of the BBB4. Peritumoral edema, as seen in the FLAIR sequences, is thought to be due to extravasation of plasma fluid as a result of the breakdown of the BBB. Holodny et al. and Pronin et al showed a direct correlation between the volume of peritumoral edema and the degree of contrast enhancement in gliomas suggesting that the origin of edema is the breakdown of the BBB 23–24. Therefore, these commonly used markers in the evaluation of brain tumors appear to rely on the same mechanism of contrast. Our pursuit was to search for a new functional mechanism of contrast for characterization and possible future evaluation of treatment response in brain tumors.
We showed that VR is greater in the gray matter than the white matter of the normal appearing brain using BH as a hypercapnic stimulus in BOLD MR. This was expected and in line with previous studies25–27. Although Rostrup et al reported that the peak BOLD response of gray matter is delayed compared to that of white matter27 we did not appreciate this. One possible explanation is acquisition discordance as a single deep breath preceded our BH paradigm. Additionally, our measurements were limited temporally by a TR = 4,000 ms.
We also found that VR is diminished in the tumor areas of the brain compared to normal appearing brain on the contralateral side. The areas of VR abnormality were different from both the areas of FLAIR abnormality or Gd-enhancement. Specifically, measurements of areas of abnormal VR were significantly greater than areas of Gd-enhancement but significantly less than areas of the FLAIR abnormality, but with variability in individual cases. We illustrated cases where there is contrast enhancement but no abnormal VR (Figure 7, patient 10) as well as no contrast enhancement and an abnormal VR (Figure 6, patient 6). Therefore, the imaging data supports what is known about the causes of contrast enhancement and vascular reactivity: that the contrast mechanism elicited by BH (caused by abnormal arteriolar smooth muscles) appears to be fundamentally different from the contrast mechanism of gadolinium enhancement (caused by the presence of “leaky” gap junctions). From the imaging data, it appears that in certain cases of gliomas there exist areas, which exhibit “leaky” gap junctions (that lead to gadolinium contrast enhancement and edema) but exhibit normal arteriolar smooth muscle cells and vice versa.
Despite different methods from Hsu et al.20 and Pillai21, our results are in agreement: both groups found decreased BOLD signal enhancement in response to BH in gliomas. While we looked at the percent BOLD signal change within a ROI to determine if the region exhibited a BOLD signal change, Hsu et al. performed correlation analysis. Additionally, other differences include tumor time-series comparisons, with Hsu et al. comparing the tumor to the entire gray matter of the cortex while we compared the tumor to the normal contralateral cortex; and differing paradigms, with Hsu et al. using a 15s or 20s BH paradigm depending on patient performance. Also, 6 of 7 patients in Hsu et al and all of the patients in Pillai et al were low-grade gliomas, whereas the pathology was more evenly distributed in our study: 5 Grade II gliomas, 2 Grade II gliomas and 9 Grade IV gliomas. More recently, papers by Pillai et al and Zacà et al have used BH VR maps to identify areas of neurovascular uncoupling in patients with low grade gliomas also undergoing pre-operative functional MRI (fMRI) to detect potential areas of false negative fMRI activation 28–29. Zacà et al detected a prevalence of neurovascular uncoupling detected by VR in 75% of the patients 29. This result emphasizes the ability of BH MR to detect areas of VR abnormality and corresponds to the findings in the current paper.
VR maps have the potential to contribute to the evaluation of treatment response. Glioma treatment with Temozolomide and concurrent radiation therapy has been shown to be superior to radiation therapy alone30, 31. Frequently patients treated with Temozolomide and radiation therapy show changes that mimic tumor progression, called pseudoprogression9, 32, which improves without any treatment10. Routine MRI techniques do not provide a way to differentiate between tumor progression and pseudoprogression33,. Recent work has demonstrated the ability of dynamic susceptibility contrast (DSC) and dynamic contrast enhanced (DCE) perfusion MR to differentiate between pseudoprogression and recurrent high-grade gliomas 34–36. Zhou et al and Ma et al recently suggested that a novel MR imaging technique, amide proton transfer MR imaging, may also be able to distinguish between pseudoprogression and true progression in malignant gliomas 37, 38. Additionally, treatment with Bevacizumab has been observed to reduce the area of enhancement and edema in brain tumors. This makes it difficult to differentiate between true response and the effect of bevacizumab on the enhancement characteristics (pseudoresponse)39–42. A measure of tumor progression, independent of enhancement, could aid the radiological assessment for possible tumor progression. Future directions for this research would include studying the vascular reactivity maps in clinical settings such as pseudoprogression and pseudoresponse in brain tumor patients.
One limitation of our study is the patient population size. Future studies should look at a larger number of brain tumor patients, especially with varying tumor grades, to elucidate these comparisons further. Our data revealed a large variability in the appearance of VH maps even in gliomas of the same grade, which clearly indicates a need for a study with a larger number of patients to better characterize these VR maps and better account for the variability. Secondly, BH can be a difficult task to perform, especially in sick or neurologically compromised patients. Patients with brain tumors can present with cognitive impairment and difficulty hearing, which makes following the instructions of the BH paradigm more difficult. It is also difficult to monitor if the patient is performing the BH paradigm correctly. To minimize inter-patient performance variability, we explained and rehearsed the paradigm; however, the variable performance of breath holding by the patient in the scanner may have further added to the wide range of our results. Others studying cerebrovascular reactivity using the BOLD signal have used a technique that controls end-tidal partial pressure of CO2 using a breathing mask43–45. Such a device would eliminate performance variability in patients and yield more consistent results. Thirdly, since the BOLD signal is acquired using T2*, it is particularly sensitive to susceptibility difference artifacts. In patients with prior surgery or hemorrhage, this method might result in compromised results.
In conclusion, we found that the changes in the BOLD signal during a BH paradigm are diminished in gliomas of different grades compared to normal appearing contralateral brain. These differences were confirmed by quantitative analysis of the peak to trough differences in the hemodynamic response curve. BH maps are quantitatively different from both the Gd-enhancement and FLAIR images and appear to be an independent measure of contrast mechanism due to vascular reactivity rather than the breakdown of the BBB. Further investigations are needed to delineate the potential to be used for clinical evaluation of brain tumors and treatment response of patients.
Acknowledgments
NIH funding body: None
The grant is P30 CA008748 Authors:
Contributor Information
Andrei Holodny, Memorial Sloan-Kettering Cancer Center, Radiology.
Amir Iranmahboob, MSKCC, Radiology.
Kyung Peck, MSKCC, Radiology.
Nicole Brennan, MSKCC, Radiology.
Sasan Karimi, Memorial Sloan-Kettering Cancer Center, Radiology.
Ryan Fisicaro, MSKCC, Radiology.
Bob Hou, MSKCC, Radiology.
References
- 1.Kohler BA, Ward E, McCarthy BJ, et al. Annual report to the nation on the status of cancer, 1975–2007, featuring tumors of the brain and other nervous system. J Natl Cancer Inst. 2011;103:714–736. doi: 10.1093/jnci/djr077. [DOI] [PMC free article] [PubMed] [Google Scholar]
- 2.Bhujwalla ZM, Artemov D, Glockner J. Tumor angiogenesis, vascularization, and contrast-enhanced magnetic resonance imaging. Top Magn Reson Imaging. 1999;10:92–103. doi: 10.1097/00002142-199904000-00002. [DOI] [PubMed] [Google Scholar]
- 3.Gillies RJ, Bhujwalla ZM, Evelhoch J, et al. Applications of magnetic resonance in model systems: tumor biology and physiology. Neoplasia. 2000;2:139–151. doi: 10.1038/sj.neo.7900076. [DOI] [PMC free article] [PubMed] [Google Scholar]
- 4.Sage MR, Wilson AJ. The blood brain barrier: an important concept in neuroimaging. AJNR. 1994;15:601–622. [PMC free article] [PubMed] [Google Scholar]
- 5.Ginsberg LE, Fuller GN, Hashmi M, Leeds NE, Schomer DF. The significance of lack of MR contrast enhancement of supratentorial brain tumors in adults: Histopathological evaluation of a series. Surg Neurol. 1998;49:436–440. doi: 10.1016/s0090-3019(97)00360-1. [DOI] [PubMed] [Google Scholar]
- 6.Scott JN, Brasher PM, Sevick RJ, Rewcastle NB, Forsyth PA. How often are nonenhancing supratentorial gliomas malignant? A population study. Neurology. 2002;59:947–949. doi: 10.1212/wnl.59.6.947. [DOI] [PubMed] [Google Scholar]
- 7.Knopp EA, Cha S, Johnson G, et al. Glial neoplasms: dynamic contrast enhanced T2*-weighted imaging. Radiology. 1999;211:791–798. doi: 10.1148/radiology.211.3.r99jn46791. [DOI] [PubMed] [Google Scholar]
- 8.Taal W, Brandsma D, de Bruin HG, et al. Incidence of early pseudo-progression in a cohort of malignant glioma patients treated with chemoirradiation with temozolomide. Cancer. 2008;113:405–410. doi: 10.1002/cncr.23562. [DOI] [PubMed] [Google Scholar]
- 9.Brandsma D, Stalpers L, Taal W, Sminia P, van den Bent MJ. Clinical features, mechanisms, and management of pseudoprogression in malignant gliomas. Lancet Oncol. 2008;9:453–461. doi: 10.1016/S1470-2045(08)70125-6. [DOI] [PubMed] [Google Scholar]
- 10.de Wit MC, de Bruin HG, Eijkenboom W, Sillevis Smitt PA, van den Bent MJ. Immediate post-radiotherapy changes in malignant glioma can mimic tumor progression. Neurology. 2004;63:535–537. doi: 10.1212/01.wnl.0000133398.11870.9a. [DOI] [PubMed] [Google Scholar]
- 11.Friedman HS, Prados MD, Wen PY, et al. Bevacizumab alone and in combination with irinotecan in recurrent glioblastoma. J Clin Oncol. 2009;27:4733–4740. doi: 10.1200/JCO.2008.19.8721. [DOI] [PubMed] [Google Scholar]
- 12.Kreisl TN, Kim L, Moore K, et al. Phase II trial of single-agent bevacizumab followed by bevacizumab plus irinotecan at tumor progression in recurrent glioblastoma. J Clin Oncol. 2009;27:740–745. doi: 10.1200/JCO.2008.16.3055. [DOI] [PMC free article] [PubMed] [Google Scholar]
- 13.Wen PY, Macdonald DR, Reardon DA, et al. Updated response assessment for high-grade gliomas: response assessment in neuro-oncology working group. J Clin Oncol. 2010;28:1963–1972. doi: 10.1200/JCO.2009.26.3541. [DOI] [PubMed] [Google Scholar]
- 14.Brian JE. Carbon dioxide and the cerebral circulation. Anesthesiology. 1998;88:1365–1386. doi: 10.1097/00000542-199805000-00029. [DOI] [PubMed] [Google Scholar]
- 15.Vavilala MS, Lee LA, Lam AM. Cerebral blood flow and vascular physiology. Anesthesiol Clin North America. 2002;20:247– 264. doi: 10.1016/s0889-8537(01)00012-8. [DOI] [PubMed] [Google Scholar]
- 16.Madden JA. The effect of carbon dioxide on cerebral arteries. Pharmacol Ther. 1993;59:229–250. doi: 10.1016/0163-7258(93)90045-f. [DOI] [PubMed] [Google Scholar]
- 17.Kastrup A, Krüger G, Glover GH, Neumann-Haefelin T, Moseley ME. Regional variability of cerebral blood oxygenation response to hypercapnia. Neuroimage. 1999;10:675–681. doi: 10.1006/nimg.1999.0505. [DOI] [PubMed] [Google Scholar]
- 18.Birn RM, Smith MA, Jones TB, Bandettini PA. The respiration response function: the temporal dynamics of fMRI signal fluctuations related to changes in respiration. Neuroimage. 2008;40:644–54. doi: 10.1016/j.neuroimage.2007.11.059. [DOI] [PMC free article] [PubMed] [Google Scholar]
- 19.Vaupel P, Kallinowski F, Okunieff P. Blood flow, oxygen and nutrient supply, and metabolic microenvironment of human tumors: a review. Cancer Res. 1989;49:6449–6465. [PubMed] [Google Scholar]
- 20.Hsu YY, Chang CN, Jung SM, et al. Blood oxygenation level-dependent MRI of cerebral gliomas during breath holding. J Magn Reson Imaging. 2004;19:160–167. doi: 10.1002/jmri.10447. [DOI] [PubMed] [Google Scholar]
- 21.Pillai JJ, Zacá D. Clinical utility of cerebrovascular reactivity mapping in patients with low grade gliomas. World J Clin Oncol. 2011;2:397–403. doi: 10.5306/wjco.v2.i12.397. [DOI] [PMC free article] [PubMed] [Google Scholar]
- 22.Zimmerman RA, Haselgrove JC, Wang Z, et al. Advances in pediatric neuroimaging. Brain & Development. 1998;20:275–289. doi: 10.1016/s0387-7604(98)00023-0. [DOI] [PubMed] [Google Scholar]
- 23.Holodny AI, Nusbaum AO, Festa S, Pronin IN, Lee HJ, Kalnin AJ. Correlation between the degree of contrast enhancement and the volume of peritumoral edema in meningiomas and malignant gliomas. Neuroradiology. 1999;41:820–825. doi: 10.1007/s002340050848. [DOI] [PubMed] [Google Scholar]
- 24.Pronin IN, Holodny AI, Petraikin AV. MRI of high-grade glial tumors: correlation between the degree of contrast enhancement and the volume of surrounding edema. Neuroradiology. 1997;39:348–350. doi: 10.1007/s002340050421. [DOI] [PubMed] [Google Scholar]
- 25.Davis SM, Ackcrman RH, Correia JA, et al. Cerebral blood flow and cerebrovascular CO2 reactivity in stroke-age normal controls. Neurology. 1983;33:391–339. doi: 10.1212/wnl.33.4.391. [DOI] [PubMed] [Google Scholar]
- 26.Reich T, Rusinek H. Cerebral cortical and white matter reactivity to carbon dioxide. Stroke. 1989;20:453–457. doi: 10.1161/01.str.20.4.453. [DOI] [PubMed] [Google Scholar]
- 27.Rostrup E, Law I, Blinkenberg M, et al. Regional differences in the CBF and BOLD responses to hypercapnia: a combined PET and fMRI study. Neuroimage. 2000;11:87–97. doi: 10.1006/nimg.1999.0526. [DOI] [PubMed] [Google Scholar]
- 28.Pillai JJ, Zacà D. Comparison of BOLD cerebrovascular reactivity mapping and DSC MR perfusion imaging for prediction of neurovascular uncoupling potential in brain tumors. Technol Cancer Res Treat. 2012;11:361–74. doi: 10.7785/tcrt.2012.500284. [DOI] [PubMed] [Google Scholar]
- 29.Zacà D, Jovicich J, Nadar SR, Voyvodic JT, Pillai JJ. Cerebrovascular reactivity mapping in patients with low grade gliomas undergoing presurgical sensorimotor mapping with BOLD fMRI. J Magn Reson Imaging. 2014;40:383–90. doi: 10.1002/jmri.24406. [DOI] [PMC free article] [PubMed] [Google Scholar]
- 30.Mirimanoff RO, Gorlia T, Mason W, et al. Radiotherapy and temozolomide for newly diagnosed glioblastoma: recursive partitioning analysis of the EORTC 26981/22981-NCIC CE3 phase III randomized trial. J Clin Oncol. 2006;24:2563–2569. doi: 10.1200/JCO.2005.04.5963. [DOI] [PubMed] [Google Scholar]
- 31.Stupp R, Mason WP, van den Bent MJ, et al. Radiotherapy plus concomitant and adjuvant temozolomide for glioblastoma. N Engl J Med. 2005;352:987–996. doi: 10.1056/NEJMoa043330. [DOI] [PubMed] [Google Scholar]
- 32.Chaskis C, Neyns B, Michotte A, De Ridder M, Everaert H. Pseudoprogression after radiotherapy with concurrent temozolomide for high-grade glioma: clinical observations and working recommendations. Surg Neurol. 2009;74:423–428. doi: 10.1016/j.surneu.2008.09.023. [DOI] [PubMed] [Google Scholar]
- 33.Young RJ, Gupta A, Shah AD, et al. Potential utility of conventional MRI signs in diagnosing pseudoprogression in glioblastoma. Neurology. 2011;76:1918–1924. doi: 10.1212/WNL.0b013e31821d74e7. [DOI] [PMC free article] [PubMed] [Google Scholar]
- 34.Young RJ, Gupta A, Shah AD, et al. MRI perfusion in determining pseudoprogression in patients with glioblastoma. Clin Imaging. 2013;37(1):41–49. doi: 10.1016/j.clinimag.2012.02.016. [DOI] [PMC free article] [PubMed] [Google Scholar]
- 35.Prager AJ, Martinez N, Beal K, et al. Diffusion and Perfusion MRI to Differentiate Treatment-Related Changes Including Pseudoprogression from Recurrent Tumors in High-Grade Gliomas with Histopathologic Evidence. AJNR Am J Neuroradiol. 2015;36:877–885. doi: 10.3174/ajnr.A4218. [DOI] [PMC free article] [PubMed] [Google Scholar]
- 36.Kim HS, Goh MJ, Kim N, et al. Which combination of MR imaging modalities is best for predicting recurrent glioblastoma? Study of diagnostic accuracy and reproducibility. Radiology. 2014;273:831–43. doi: 10.1148/radiol.14132868. [DOI] [PubMed] [Google Scholar]
- 37.Zhou J, Zhu H, Lim M, Blair L, et al. Three-dimensional amide proton transfer MR imaging of gliomas: Initial experience and comparison with gadolinium enhancement. J Magn Reson Imaging. 2013;38:1119–28. doi: 10.1002/jmri.24067. [DOI] [PMC free article] [PubMed] [Google Scholar]
- 38.Ma B, et al. Distinguishing Pseudoprogression from True Progression or Recurrence of Malignant Glioma Using Amide Proton Transfer MR Imaging. Presented at the Radiological Society of North America 2014 Scientific Assembly and Annual Meeting; December 2014; Chicago, IL, USA. [Google Scholar]
- 39.Thompson EM, Dosa E, Kreamer DF, Neuwelt EA. Treatment with bevacizumab plus carboplatin for recurrent malignant glioma. Neurosurgery. 2010;67:87–93. doi: 10.1227/01.NEU.0000370918.51053.BC. [DOI] [PMC free article] [PubMed] [Google Scholar]
- 40.Vredenburgh JJ, Desjardins A, Herndon JE, et al. Phase II trial of bevacizumab and irinotecan in recurrent malignant glioma. Clin Cancer Res. 2007;13:1253–1259. doi: 10.1158/1078-0432.CCR-06-2309. [DOI] [PubMed] [Google Scholar]
- 41.Vredenburgh JJ, Desjardins A, Herndon JE, et al. Bevacizumab plus irinotecan in recurrent glioblastomamultiforme. J Clin Oncol. 2007;25:4722– 4729. doi: 10.1200/JCO.2007.12.2440. [DOI] [PubMed] [Google Scholar]
- 42.Thompson EM, Frenkel EP, Neuwelt EA. The paradoxical effect of bevacizumab in the therapy of malignant gliomas. Neurology. 2011;76(1):87–93. doi: 10.1212/WNL.0b013e318204a3af. [DOI] [PMC free article] [PubMed] [Google Scholar]
- 43.Vesely A, Sasano H, Volgyesi G, et al. MRI mapping of cerebrovascular reactivity using square wave changes in end-tidal PCO2. Magn Reson Med. 2001;45:1011–1013. doi: 10.1002/mrm.1134. [DOI] [PubMed] [Google Scholar]
- 44.Mikulis DJ, Krolczyk G, Desal H, et al. Preoperative and postoperative mapping of cerebrovascular reactivity in moyamoya disease by using blood oxygen level-dependent magnetic resonance imaging. J Neurosurg. 2005;103:347–355. doi: 10.3171/jns.2005.103.2.0347. [DOI] [PubMed] [Google Scholar]
- 45.Prisman E, Slessarev M, Han J, et al. Comparison of the effects of independently-controlled end-tidal PCO2 and PO2 on blood oxygen level–dependent (BOLD) MRI. J Magn Reson Imaging. 2008;27:185–191. doi: 10.1002/jmri.21102. [DOI] [PubMed] [Google Scholar]


