

ABSTRACT
In a series of 248 tumor samples obtained from image-guided biopsies from patients diagnosed with ductal carcinoma in situ of the breast, we attempted to identify biomarkers that predict microinfiltration at definitive surgery or relapse during follow-up. For this, we used immunohistochemical methods, followed by automated image analyses, to measure the mean diameter of nuclei (which correlates with ploidy), the phosphorylation of eukaryotic initiation factor 2α (eIF2α, which reflects endoplasmic reticulum stress) as well as the density and ratio of CD8+ cytotoxic T lymphocytes and FOXP3+ regulatory T cells. The median nuclear diameter of malignant cells correlated with eIF2α phosphorylation (in cancerous tissue), which in turn correlated with the density of the CD8+ infiltrate and the CD8+/FOXP3 ratio (both in cancerous and the adjacent non-cancerous parenchyma). Neither microinfiltration nor lymph node involvement was associated with the probability of relapse. Both correlated positively with the CD8+/FOXP3 ratio in the malignant area. In contrast, relapse was associated with a paucity of the CD8+ infiltrate as well as an unfavorable CD8+/FOXP3 ratio, both in malignant and non-malignant parenchyma. The combined analysis of the CD8+/FOXP3 ratio in cancerous and non-cancerous tissues revealed a significant impact of their interaction on the probability of relapse, but not on the presence of microinfiltration or lymph node metastasis. Altogether, these results support the idea of an immunosurveillance system that determines the risk of relapse in ductal carcinoma in situ of the breast.
KEYWORDS: Cytotoxic T cells, hyperploidy, immunogenic cell death, immunosuppressive regulatory T cells, intraductal carcinoma
Abbreviations
- (C)
cancerous
- CRT
calreticulin
- CTL
cytotoxic T lymphocytes
- DCIS
ductal carcinoma in situ
- eif2α
eukaryotic initiation factor 2α
- ER
estrogen receptor
- HE
hematoxylin-eosin
- (NC)
non-cancerous
- PR
progesterone receptor
- ROI
regions of interest
- TMA
tissue micro array
- Treg
regulatory T cells
Introduction
Breast cancer is under strong immunosurveillance, as indicated by numerous clinical studies revealing that the density, composition, and functional state of the immune infiltrate dictates patient prognosis, as well as therapeutic responses to adjuvant or neoadjuvant chemotherapy.1-7 This applies to the composition of the immune infiltrate at diagnosis,1-4,8,9 as well as for the dynamic changes induced by anthracycline-based chemotherapy, in which an amelioration of the ratio of CD8+ cytotoxic T lymphocytes (CTL) over FOXP3+ regulatory T cells (Treg) correlates with favorable outcome.10
The recognition of cancer cells by immune effectors requires two parameters, namely, antigenicity (the presence of tumor-associated antigens that usually either result from mutations yielding mutated proteins or the ectopic expression of genes/proteins that normally are only transcribed/translated in embryonic development or in the testis) and adjuvanticity (the presence of co-stimulatory signals that activate innate immune effectors).11-13 One of the mechanisms increasing tumor cell adjuvanticity is linked to the very mechanism of oncogenesis, which often (in at least 40% of malignancies) involves a tetraploidization event (i.e., genome duplication), followed by a gradual depolyploidization due to chromosome loss.14-16 Interestingly, tetraploid cells are characterized by an endoplasmic reticulum stress response (that leads to an increase in the phosphorylation of eukaryotic initiation factor 2α (eIF2α)17 and enhanced surface exposure of the endoplasmic reticulum protein calreticulin (CRT) on the cell surface, facilitating immune recognition of the cells through an adjuvant effect.18-22 As a result, downregulation of CRT exposure, eIF2α phosphorylation, and reduction in ploidy occur under the pressure of the immune system, generating near-to-diploid cells that can escape from immune control. This sequence of event has been observed in hormone-induced breast cancer models as well.10
Ductal carcinoma in situ (DCIS), also known as intraductal carcinoma, is a non-invasive cancerous lesion of the breast that is usually detected at routine mammography.23,24 Its treatment is mostly based on local therapies (surgery and radiation therapy), which frequently achieve definitive cure. Adjuvant endocrine therapy is controversial, its benefit being limited to the prevention of local and contralateral relapse. The dynamically evolving profiles of DCIS are highly variable; some cases of DCIS are truly indolent while others may rapidly evolve to locally invasive disease and even metastatic dissemination. Indeed, a current controversy questions the utility of detecting DCIS, and mammographic screening have been accused to lead to over-diagnosis and over-treatment. For this reason, novel biomarkers that accurately predict DCIS evolution are urgently needed. Previous works have shown that heavily CD8+ lymphocyte-infiltrated DCIS is associated with a spontaneous “healing” phenotype (with periductal fibrosis and extensive obliteration of cancerous tissue)25 and that triple negative-DCIS are infiltrated by PDL-1+ CD8+-lymphocytes26, yet have not established any relationship between prognosis and the immune infiltrate in DCIS.
Based on the consideration that biomarkers predicting the fate of patients with DCIS are elusive, we investigated the potential utility of measuring ploidy, eIF2α phosphorylation, and CD8+/FOXP3 ratios in a series of patients DCIS and invasive ductal carcinoma. Here, we report that an unfavorable CD8+/FOXP3 ratio predicts the relapse of DCIS.
Results and discussion
Study design and clinicobiological characteristics of the patient population
As a result of mammographic screening, a total of 248 consecutive patients (2005–2007) from a single institution, for which initial material was available, were diagnosed with ductal in situ breast cancer on initial image-guided biopsy and selected for the present study (Table 1). At definitive surgery, 199 were confirmed to be pure DCIS, while 44 exhibited a localized infiltration of the breast tissue by malignant cells (microinfiltration) alone, two lymph node infiltration alone, and three both microinfiltration and lymph node positivity. One-hundred-eleven patients were treated by surgery only while 137 received an adjuvant treatment (Table 1). At a median follow-up of 49 mo, 26 patients relapsed either in the ipsi- or contralateral breast. Among these relapsed patients, nine were treated, as first line treatment, by surgery alone, seven received adjuvant radiotherapy (RT), five patients received RT and hormonal treatment, and five received adjuvant chemotherapy (CT) concomitant to RT and/or hormonal treatment. Hence, a total of 20 patients among 199 true DCIS (i.e., without microinfiltration and without spreading to lymph nodes) relapsed, and the relapse rate did not correlate with microinfiltration and lymph node invasion (Fig. 1). Based on our previous results linking nuclear size, endoplasmic reticulum stress and immunosurveillance,10 we determined the nuclear size by hematoxylin-eosin (HE) staining and morphometric analysis (Figs. 2A–D), measured the intensity of eIF2α phosphorylation by immunohistochemistry and image analysis (Figs. 2E–H) and determined the density of infiltrating CD8+ CTL (Figs. 3A–D) and FOXP3+ Treg (Figs. 3E–H) both in the cancer (cancerous, C) and in the adjacent normal (non-cancerous, NC) tissue, in the whole cohort. We then correlated all histological parameters (median nuclear size, eIF2αP, CD8+ infiltrate, and CD8+/FOXP3 ratio) in (C) and (NC) with all clinical parameters (relapse, microinfiltration, lymph node positivity, menopause, histological grade, and hormone receptor status). As to be expected, estrogen receptor (ER) and progesterone receptor (PR) positivity correlated among each other, yet were negatively associated with HER2 status and high grade, while HER2 positivity correlated with high grade (Fig. 4). ER and PR expression were negatively associated with microinfiltration, while HER2 expression, grade, and lymph node metastasis positively correlated with microinfiltration (Fig. 1, Fig. 4).
Table 1.
Clinico-pathological features of the patient population and outcome.
| Parameter | Number (%) |
|---|---|
| Patients | 248 |
| Spots | 1,632 (at least three for each patient) |
| Age | < 40 y old: 18 patients (7%) |
| 40–50 y old: 80 patients (32%) | |
| 51–70 y old: 121 (49%) | |
| > 70 y old: 29 patients (12%) | |
| Menopause | 110 patients (44%) |
| Estrogen receptor status | pos ≥ 10: 165 patients (66%) |
| Progesterone receptor status | pos ≥ 10%: 108 patients (44%) |
| HER2 status | 0: 104 patients (55%) |
| 2+: 18 patients (9%) | |
| 3+: 68 patients (36%) | |
| Missing: 58 patients | |
| Nuclear grade | 1: 18 patients (7%) |
| 2: 108 patients (44%) | |
| 3: 122 patients (49%) | |
| pN status | pN0 : 243 patients (98%) |
| pN1mi : 2 patients (1%) | |
| pN1a : 3 patients (1%) | |
| Presence of a microinfiltration | 49 patients (20%) |
| Adjuvant treatment | No adjuvant therapy: 111 patients (45%) |
| RT alone: 36 patients | |
| Hormonal treatment alone: 22 patients | |
| RT + hormonal treatment: 65 patients | |
| CT ± RT±hormonal treatment: 14 patients | |
| Total relapses) | 26 patients (10%) |
| Ipsilateral DCIS relapse | 7 patients (27%) |
| Ipsilateral invasive BC relapse | 3 patients (12%) |
| Contralateral DCIS relapse | 11 patients (42%) |
| Contralateral invasive BC relapse | 5 patients (19%) |
Abbreviations: CT, chemotherapy; RT, radiotherapy; BC, breast cancer.
Figure 1.

Venn representation of clinical data. The three sets represent the three clinical classifications. The p-values represent the results of Fisher's exact tests, searching for a correlation between each pair of clinical classification.
Figure 2.

Intraductal carcinoma (DCIS) and breast control tissue micro-array (TMA) with analysis of the phosphorylation of eIF2α. (A) Representative core (hematoxylin/eosin stain). (B) Automated image segmentation by Definiens Software: automatic assessment of the epithelial component (orange) and the stromal tissue (yellow). (C, D) Two examples of high-magnification images to visualize, analyze, and quantify by automated Definiens Software each nucleus for each core. Nuclei are classified according to the surface: small (yellow); orange (medium); red (large); gray (not classified). Several parameters (area, roundness, compactness, distance to scene border, length, width, and circularity) were provided for each nucleus in a parallel analysis. (E–H) Representative pictures of phospho-eIF2α staining: (E, G) weak phospho-eIF2α cytoplasm staining in normal breast tissue and cancer tissue, (F, H) intense phospho-eIF2α cytoplasm staining in normal breast tissue and in malignant areas. The average of the immunohistochemical marker intensity of the cytoplasmic staining is expressed as absolute number by semi-automated Definiens Software quantification. Magnification 20×.
Figure 3.
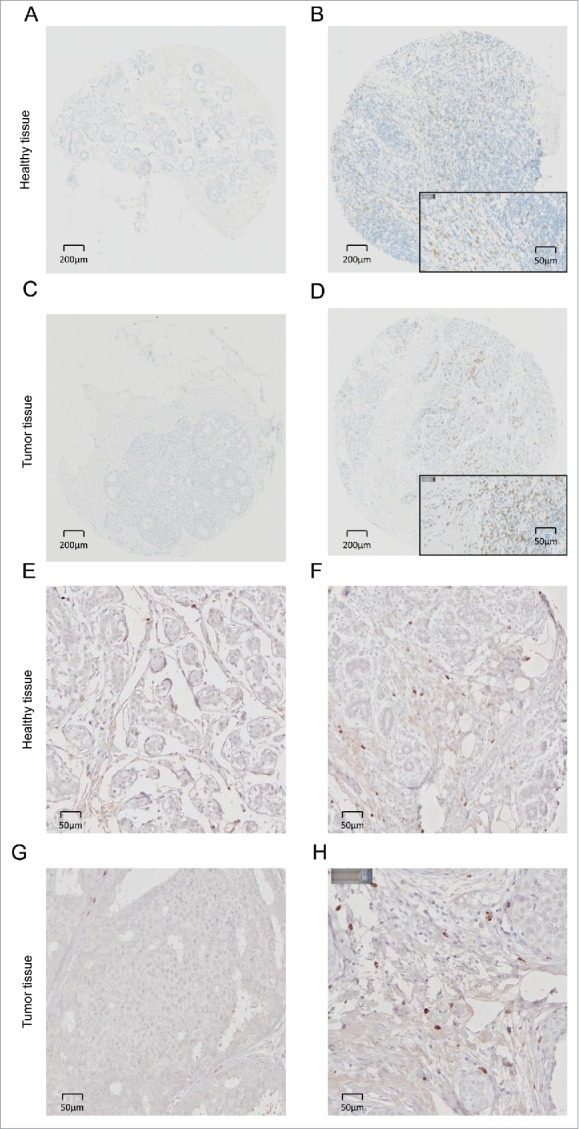
CD8+ and FOXP3+ infiltrating lymphocytes in intraductal breast cancer (DCIS) and in healthy tissue. Representative pictures of immunohistochemical staining of primary paraffin-embedded breast normal tissue samples and DCIS using CD8+ (negative CD8 staining in (A, C) and positive CD8 staining in (B, D)) or FOXP3-specific (negative FOXP3 staining in (E, G) and positive FOXP3 staining in (F, H)) antibodies (brown). The exact number of CD8+ lymphocytes was evaluated after manual spot recognition by ImageJ software and R software analysis (http://www.r-project.org/) in the epithelial tissue and in the surrounding stromal tissue.
Figure 4.

Heat map representation of statistical correlations among all measured parameters. Top right triangle is a two-entries table of signed p-values (p-value sign corresponds to relation sign). Bottom left triangle is a color representation of signed p-value, in log10 scale given by small color panel on top (dashed yellow lines represent significant threshold: ± log10(0.05). The relation tests between two numerical parameters (median nuclear size, eIF2α, CD8+ infiltrate, CD8+/FOXP3 ratio) is the Pearson's correlation test. The relation test between a numerical parameter and a two-level parameter (relapse, microinfiltration, menopause, lymph node positivity, ER+, PR+) is the t-test. The relation test between a two-level parameter and another two-level parameter is the Fisher's exact test. The relation test between a numerical parameter and a multi-level (>2) parameter (grade, HER2+) uses a linear model (explaining numerical parameter with the multi-level parameter). The relation test between a two-level parameter and a multi-level (>2) parameter is the t-test. (C) and (NC) represent cancerous and non-cancerous tissue, respectively.
Correlations among nuclear size, eIF2α phosphorylation, and immune infiltration
The median size of nuclei in (C) tissues correlated with that of the adjacent (NC) tissue. Similarly, the phosphorylation of eIF2α correlated between (C) and (NC) (Fig. 4). These correlations were observed in the entire cohort (that included a few cases of microinfiltration and lymph node infiltration, Table 1) and for the cohort that only included cases of confirmed DCIS (Fig. S1) However, only nuclear size in (C) (not in (NC)) correlated with eIF2α phosphorylation (Fig. 4, Fig. S1). This latter correlation was both obtained if nuclear size and eIF2α phosphorylation were plotted against each other as continuous variable (Fig. 5A) or when a threshold was applied to identify cells with particular large nuclei (>17 µm in diameter) and their percentage was plotted against the intensity of eIF2α phosphorylation (Fig. 5B). A positive correlation was detectable between median nuclear size in (C) and the density of the CD8+ infiltrate or the CD8+/FOXP3 ratio in (NC) (Figs. 5C and D). A positive correlation was also detectable between eIF2α phosphorylation and the density of the CD8+ infiltrate or the CD8+/FOXP3 ratio in (NC) (Figs. 5E and F). Hence, these findings are compatible with the concept that ploidy-associated endoplasmic reticulum stress favors local immune responses.
Figure 5.
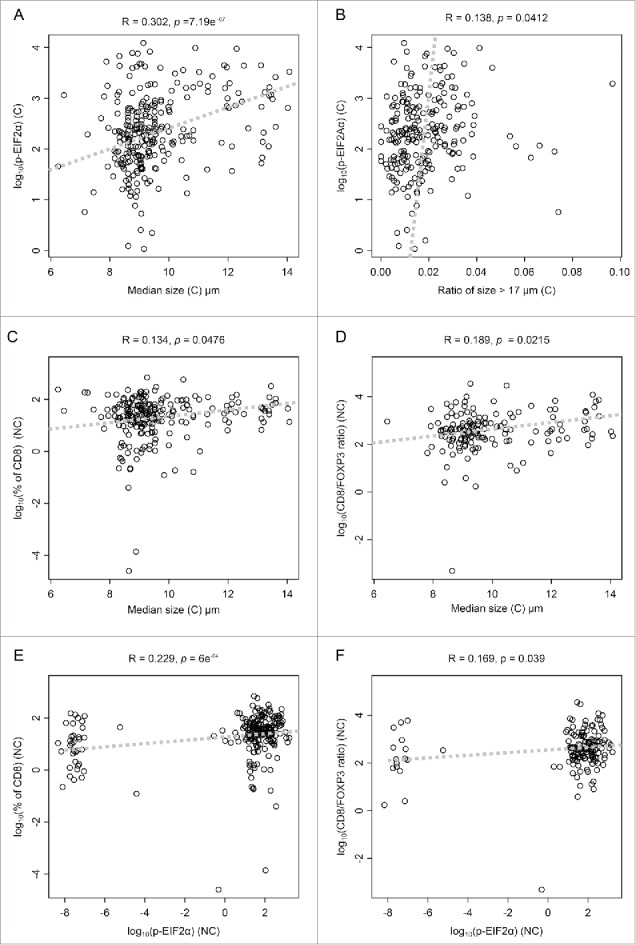
Scatter plots of significant correlations. Scatter representation of parameters pairs, whose Pearson's correlation coefficient is significantly different from zero. Correlation coefficient (r-value) and p-value of Pearson's correlation test is given on top of each panel. (C) and (NC) represent cancerous and non-cancerous tissue, respectively. Dashed lines represent the first principal component.
Correlations between immunohistochemical, clinico-biological parameters, and disease-free survival
The HER2 status and grade correlated with an increase in nuclear diameter and in the density of CD8+ T cells (Fig. 4, Figs. S1, 2A, B, D, E); ER negatively correlated with increased nuclear diameter (Fig. S2C). Relapse was associated with a paucity of the CD8+ infiltrate, as well as a poor CD8+/FOXP3 ratio, both in (C) and (NC), in line with the idea that the local immune response can protect against relapse (Figs. 6A–D). However, relapse failed to significantly correlate with nuclear size and with eIF2α phosphorylation (Fig. 4, Fig. S1). Lymph node metastasis correlated positively with nuclear diameter, the CD8+ infiltrate and the CD8+/FOXP3 ratio (Fig. 4, Figs. S2F–H). In contrast, microinfiltration was solely associated with an increase in eIF2α phosphorylation (only in (C)) as well as with an augmentation of the CD8+/FOXP3 ratio (only in (NC)) (Fig. 4, Fig. 6E and F). Next, we investigated the impact of the combined assessment of the CD8+/FOXP3 ratio (both in (C) and in (NC)) on the major clinical parameters investigated here and on outcome. This type of analysis confirmed that relapse was associated with a reduction in the CD8+/FOXP3 ratio both in (C) and (NC) (Figs. 7A and B). In contrast, microinfiltration and lymph node positivity were not correlated with significant alterations in the CD8+/FOXP3 ratio when (C) and (NC) were subjected to a combined statistical evaluation (Figs. 7C and D).
Figure 6.
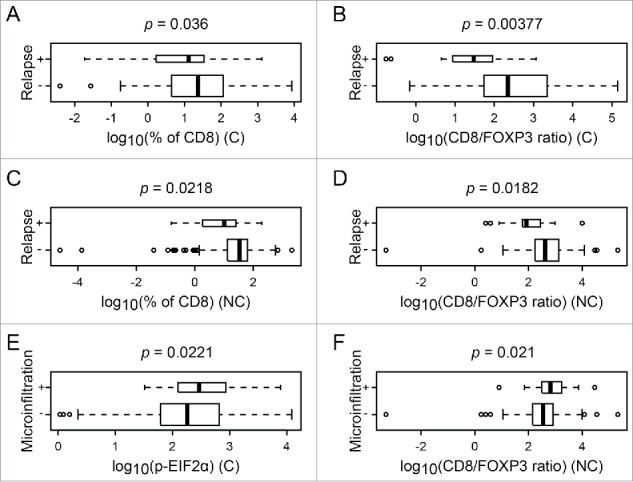
Box plot of significant difference of numerical parameters, according to clinical annotation. Box plot of different numerical parameters that are significantly different according to relapse or microinfiltration. The p-value of the associated t-test is given on top of each panel. (C) and (NC) represent cancerous and non-cancerous tissue, respectively.
Figure 7.

Scatter plots of CD8+/FOXP3 infiltration, with clinical color annotation. Scatter representation of CD8+/FOXP3 ratio, in cancerous (C) and in non-cancerous (NC) tissue. Panels (A), (C), and (D) include all patients listed in Table 1; Panel (B) includes only the sub-cohort with lymph node negative and no microinfiltration. The colors represent the clinical annotation: Panels (A) and (B): relapse; Panel (C): microinfiltration; Panel (D): lymph node+. The p-values are based on two-dimensional linear model, testing the significance of the linear coefficients.
Concluding remarks
The present results corroborate the conjecture that an increase in cellular ploidy (reflected by an augmentation of nuclear diameter) causes an increment in endoplasmic reticulum stress (reflected by eIF2α hyperphosphorylation), which in turn favors local immune responses mediated by CD8+ T lymphocytes (and counteracted by FOXP3+ regulatory T cells). Moreover, a paucity in the density of CD8+ T lymphocytes (resulting in an unfavorable CD8+/FOXP3 ratio) within the malignant area indicated a higher probability of relapse. Intriguingly, the correlation between nuclear diameter and eIF2α phosphorylation, as well as that between eIF2α hyperphosphorylation and CD8+ infiltration, were also observed in “normal” breast parenchyma. Furthermore, an unfavorable CD8+/FOXP3 ratio in the non-cancerous tissue was associated with relapse. These findings suggest that either the “non-cancerous” tissue is not entirely normal (as this is also suggested by the positive correlation between nuclear size in malignant and adjacent tissues). Indeed, the results suggest that FOXP3+ cells are abnormally underrepresented in (NC) tissues, setting the stage for microinvasion. This suggestion invigorates the crucial importance of keeping in check inflammation in peripheral tissues. Alternatively, it may indicate that immune cells do not only patrol malignant lesions but also the adjacent normal tissue, perhaps due the existence of cross-reactive self-antigens. We found that two clinical parameters, namely microinvasion of the tissue by breast carcinoma cells and lymph node metastases, were associated with more favorable (rather than unfavorable) CD8+/FOXP3 ratios in the cancer. Hence, immunosurveillance (reflected by CD8+/FOXP3 ratios) apparently does not protect against local or distant dissemination. In accord with this interpretation, in the cohort of breast cancer patients investigated here, dissemination of malignant cells into the adjacent tissue and lymph nodes was not associated with relapse.
Relapse was as likely to occur in the same mammary gland in which DCIS had been diagnosed and in the contralateral one. Since some cases of DCIS have an inherent potential for distant metastatic spread, a further in-depth analysis focusing on this topic would require genomic sequencing of the primary and the relapsed cancer to determine whether the recurrent lesion truly stems from the primary tumor that had been surgically removed or whether it is a different tumor that has been developing independently. Future studies should clarify this issue.
In synthesis, it appears that an unfavorable CD8+/FOXP3 ratio, both in malignant and adjacent tissues, correlates with subsequent local or contralateral relapse of DCIS. It will be important to validate this biomarker in future prospective studies.
Materials and methods
Patients
A tissue micro array (TMA) from 272 specimens of DCIS and from the corresponding normal ductal epithelium was utilized for the study (grant application “TMA DCIS Gustave Roussy Cancer Campus; Odyssea funding”).
The exploitable samples involved a cohort of 248 patients with DCIS diagnosed between 2005 and 2007 and treated in the Department of breast cancer at Gustave Roussy Cancer Campus, (Villejuif, France) (Table 1). Cases were selected when the initial image-guided biopsy sample was available, as well as surgical material. Complete clinical data were collected and have been updated in June 2015. The whole project has been approved by Gustave Roussy's Institutional Review Board. Sixty per cent of the patients (n = 150) were older than 50 y old at the time of diagnosis (among them 29 patients older than 70 y old), while 32% (n = 80) were aged between 40 and 50 y and only 7% (n = 18) were less than 40 y old. All patients received first line surgery while adjuvant chemotherapy, endocrine therapy, and local radiotherapy were delivered if recommended according to the risk of relapse. Overall 45% (n = 111) of the patients received only surgery as first line treatment, while 55% of the patients (n = 137) received also an adjuvant treatment (Table 1). The local ethical committee approved the study, and all patients gave written informed consent at the time of the diagnosis for the use of tumor samples for research purposes. One hundred sixty five specimens (66%) were ER+ (cut-off: 10%) while 108 (43%) were PR+ (cut-off: 10%). The HER2 amplification was evaluable only on 190 specimens: 104 samples were HER2− (55%), 18 (9%) were classified as mildly positive and 68 (36%) with a strong HER2+ staining. The histological grade of the tumors was grade 1 for 18 patients (7%), grade 2 for 108 (44%), and grade 3 for 122 patients (49%). Forty-nine samples (20%) presented histological microinfiltration (mi) while only five patients presented lymph node infiltration (pN1mi = 2; pN1a = 3). With a median follow-up of 4.1 y, 26 (10%) patients presented ipsilateral or contralateral cancer relapses.
TMA construction
Tumor tissues from resected tumors from paraffin blocks of samples taken as part of standard care were used to construct tissue microarrays. For each primary tumor three spots of 1.0 mm were created from two different blocks when feasible. For the normal tissue, a total of three spots per patient selected away from the tumor area were created from at least two different blocks (total spot analyzed: 1,632 spots).
Measurement of DNA ploidy
DNA ploidy was determined on the HE by the nuclei diameter measurement. Image analysis was performed using Definiens analytic software (Definiens Inc., Munich, Germany) with a customized algorithm and application for identifying the precise regions of interest (ROI). After identifying each spot, the software was able to distinguish between epithelial tissue and stroma (complete automated image segmentation procedure), then, focusing on epithelial tissue, was able to classify each identified nucleus according with its surface and characterized several geometric object-specific features for each nucleus (area, roundness, compactness, distance to scene border, length, width, and circularity). Nuclear ploidy was determined by the measurements of the nuclei lengths (largest diameter). All the ROI were manually reviewed.
Immunohistochemistry
Phospho-eIF2α
Paraffin-embedded TMA DCIS specimens were manually assessed for the Phospho-eIF2α staining (monoclonal antiPhospho-eIF2α (Ser51) antibody (ab32157, Abcam) in order to analyze the correlation between hyperploid DNA content and endoplasmic reticulum stress response.17,27-29 Antigen retrieval was performed by incubating slides in citrate buffer (pH 7.3) for 20 min at 98°C and cooling them for 30 min, at room temperature (RT). The sections were mounted on Shandon Sequenza coverplates (Thermo Fisher Scientific, 72-199-50) in distilled water. Sections were then saturated 2 h with TBS-1% BSA-10% of goat serum (VECTOR). Without washing, the primary antibody, a monoclonal rabbit anti Anti-Phospho-eIF2α (phospho S51) antibody (7µg/mL, # ab32157, abcam), was incubated overnight. Endogenous peroxidase activity was inhibited with 3% hydrogen peroxidase (DAKO) for 15 min followed by the secondary antibody (Envision-Rabbit, Dako) for 45 min. Peroxidase activity was revealed by means of daminobenzidine substrate (DAB, Dako), and the sections were counterstained with Mayer's hematoxylin. After staining, images were acquired with a Virtual Slides microscope VS120-SL (Olympus, Tokyo, Japan), 20X air objective (0.75 NA). TMA images stained for Phospho-eIF2α were analyzed using the Cell simulation and Cytoplasm Marker Instensity algorithm of Tissue Studio from Definiens. The stain values are based on the conversion of the red, green, and blue (RGB) space to the Hue—Saturation-Density (HSD) model. Definiens retrieved the stain value for each pixel (pixel intensities) in all cytoplasms for each cell analyzed. This allows for the automatically calculation of stain intensity. The results were automatically arranged exported and available for further statistical calculations.30
CD8+ and FOXP3
TMA slides were assessed for the infiltration by CD8+ (Novocastra, Newcastle, UK, NCL-L-CD8-295, clone 1A5, C=3.1 g/L, dilution 1/25) performed on a BenchMark XT automated immunostainer (Ventana, Tucson, AZ, USA). Antigen retrieval was performed by incubating slides in EDTA buffer (pH 8.0) for 30 min at 95°C. Then the antibody was incubated for 32 min and revealed by ultraView Universal DAB Detection Kit (Roche, #760-500). FOXP3+ Tregs' staining was manually assessed using the Novolink Kit (Menarini Diagnostics, RE7140-K). The sections were deparaffinized by Xylene and then rehydrated in alcohols and water. Antigen retrieval was carried out by heating slides for 30 min in Tris-EDTA buffer (pH 9.0) at 98°C. The steps of blocking of endogenous peroxidase activity, saturation of non-specific sites, revelation by secondary antibody, and counterstaining were performed according to the instructions of supplier of the kit. The TMA slides were incubated 1 h at RT with a primary antibody specific for FOXP3 (ab450, Abcam) at the final concentration of 4 µg/mL.31-33
Original Visual Saliency Induced (VSI)-coded images were converted into TIFF-coded files by using the VSI-reader plugin developed for the Fiji software (http://fiji.sc/Fiji) by the BioImaging and Optics Platform of EPA (http://biop.epfl.ch/TOOL_VSI_Reader.html). These converted images were then analyzed by means of the morphometric analysis tool developed in R (https://www.r-project.org/) by Sauvat et al.22
Data analysis
For each patient, we considered the following biological parameters:
“Median size:” the average, over replicates, of the median nucleus size in (C) and in (NC).
“Ratio of size > 17 μm:” the ratio of nucleus size larger than 17 μm, by pooling all nucleus sizes over replicates.
“EIF2α:” the average, over replicate, of the log10 of Phospho-eIF2α in (C) and in (NC).
“CD8+ infiltrate:” the average, over replicate, of the log10 of CD8+ percentage in (C) and in (NC).
“CD8+/FOXP3 ratio:” the average, over replicate, of the log10 of CD8+/FOXP3 ratio in (C) and in (NC).
The log10 was taken in order to obtain Gaussian behavior of the numerical variables. Considering the whole set of biological and clinical parameters, we could then apply Pearson's correlation tests, t-tests, and linear models, as described in the legend to each figure.
Supplementary Material
Disclosure of potential conflicts of interest
No potential conflicts of interest were disclosed.
Acknowledgments
The construction of the tissue micro-array and the collection of clinical data were funded by Odyssea. GK and LZ are supported by the Ligue contre le Cancer (équipes labelisées); Agence Nationale de la Recherche (ANR)—Projets blancs; ANR under the frame of E-Rare-2, the ERA-Net for Research on Rare Diseases; Association pour la recherche sur le cancer (ARC); Cancéropôle Ile-de-France; Institut National du Cancer (INCa); Fondation pour la Recherche Médicale (FRM); Fondation de France; the European Commission (ArtForce); the European Research Council (ERC); the LabEx Immuno-Oncology; the SIRIC Stratified Oncology Cell DNA Repair and Tumor Immune Elimination (SOCRATE); the SIRIC Cancer Research and Personalized Medicine (CARPEM); the Swiss Bridge Foundation, ISREC and the Paris Alliance of Cancer Research Institutes (PACRI). LS is supported by ARC (PJA20151203519). NB, JH, and AB received fellowships from the Ministere de l'Education Nationale de la Recherche et de la Technologie (MENRT), Philantropia Foundation and Ligue contre le Cancer, respectively. We thank S. Piterboth and Pr J–Y. Scoazec from the Department of Medical Biology and Pathology, Gustave Roussy Cancer Campus, Villejuif—France, for help in CD8+ automated staining.
References
- 1.Denkert C, Loibl S, Noske A, Roller M, Muller BM, Komor M, Budczies J, Darb-Esfahani S, Kronenwett R, Hanusch C et al.. Tumor-associated lymphocytes as an independent predictor of response to neoadjuvant chemotherapy in breast cancer. J Clin Oncol 2010; 28:105-13; PMID:19917869; http://dx.doi.org/ 10.1200/JCO.2009.23.7370 [DOI] [PubMed] [Google Scholar]
- 2.Denkert C, von Minckwitz G, Brase JC, Sinn BV, Gade S, Kronenwett R, Pfitzner BM, Salat C, Loi S, Schmitt WD et al.. Tumor-infiltrating lymphocytes and response to neoadjuvant chemotherapy with or without carboplatin in human epidermal growth factor receptor 2-positive and triple-negative primary breast cancers. J Clin Oncol 2015; 33:983-91; PMID:25534375; http://dx.doi.org/ 10.1200/JCO.2014.58.1967 [DOI] [PubMed] [Google Scholar]
- 3.Dieci MV, Mathieu MC, Guarneri V, Conte P, Delaloge S, Andre F, Goubar A. Prognostic and predictive value of tumor-infiltrating lymphocytes in two phase III randomized adjuvant breast cancer trials. Ann Oncol 2015; 26:1698-704; PMID:25995301; http://dx.doi.org/ 10.1093/annonc/mdv239 [DOI] [PMC free article] [PubMed] [Google Scholar]
- 4.Dieci MV, Criscitiello C, Goubar A, Viale G, Conte P, Guarneri V, Ficarra G, Mathieu MC, Delaloge S, Curigliano G et al.. Prognostic value of tumor-infiltrating lymphocytes on residual disease after primary chemotherapy for triple-negative breast cancer: a retrospective multicenter study. Ann Oncol 2015; 26:1518; PMID:26109735; http://dx.doi.org/ 10.1093/annonc/mdv239 [DOI] [PMC free article] [PubMed] [Google Scholar]
- 5.Kroemer G, Senovilla L, Galluzzi L, Andre F, Zitvogel L. Natural and therapy-induced immunosurveillance in breast cancer. Nat Med 2015; 21:1128-38; PMID:26444637; http://dx.doi.org/ 10.1038/nm.3944 [DOI] [PubMed] [Google Scholar]
- 6.Ingold Heppner B, Untch M, Denkert C, Pfitzner BM, Lederer B, Schmitt WD, Eidtmann H, Fasching PA, Tesch H, Solbach C et al.. Tumor-infiltrating lymphocytes: a predictive and prognostic biomarker in neoadjuvant treated HER2-positive breast cancer. Clin Cancer Res 2016; PMID:27189162; http://dx.doi.org/ 10.1158/1078-0432.CCR-15-2338 [DOI] [PubMed] [Google Scholar]
- 7.Ingold Heppner B, Loibl S, Denkert C. Tumor-Infiltrating Lymphocytes: A Promising Biomarker in Breast Cancer. Breast Care (Basel) 2016; 11:96-100; PMID:27239170; http://dx.doi.org/ 10.1159/000444357 [DOI] [PMC free article] [PubMed] [Google Scholar]
- 8.Stoll G, Enot D, Mlecnik B, Galon J, Zitvogel L, Kroemer G. Immune-related gene signatures predict the outcome of neoadjuvant chemotherapy. Oncoimmunol 2014; 3:e27884; PMID:24790795; http://dx.doi.org/ 10.4161/onci.27884 [DOI] [PMC free article] [PubMed] [Google Scholar]
- 9.Ladoire S, Enot D, Senovilla L, Ghiringhelli F, Poirier-Colame V, Chaba K, Semeraro M, Chaix M, Penault-Llorca F, Arnould L et al.. The presence of LC3B puncta and HMGB1 expression in malignant cells correlate with the immune infiltrate in breast cancer. Autophagy 2016; 12:864-75; PMID:26979828; http://dx.doi.org/ 10.1080/15548627.2016.1154244 [DOI] [PMC free article] [PubMed] [Google Scholar]
- 10.Senovilla L, Vitale I, Martins I, Tailler M, Pailleret C, Michaud M, Galluzzi L, Adjemian S, Kepp O, Niso-Santano M et al.. An immunosurveillance mechanism controls cancer cell ploidy. Science 2012; 337:1678-84; PMID:23019653; http://dx.doi.org/ 10.1126/science.1224922 [DOI] [PubMed] [Google Scholar]
- 11.Schreiber RD, Old LJ, Smyth MJ. Cancer immunoediting: integrating immunity's roles in cancer suppression and promotion. Science 2011; 331:1565-70; PMID:21436444; http://dx.doi.org/ 10.1126/science.1203486 [DOI] [PubMed] [Google Scholar]
- 12.Palucka AK, Coussens LM. The Basis of Oncoimmunology. Cell 2016; 164:1233-47; PMID:26967289; http://dx.doi.org/ 10.1016/j.cell.2016.01.049 [DOI] [PMC free article] [PubMed] [Google Scholar]
- 13.Zitvogel L, Ayyoub M, Routy B, Kroemer G. Microbiome and Anticancer Immunosurveillance. Cell 2016; 165:276-87; PMID:27058662; http://dx.doi.org/ 10.1016/j.cell.2016.03.001 [DOI] [PubMed] [Google Scholar]
- 14.Fujiwara T, Bandi M, Nitta M, Ivanova EV, Bronson RT, Pellman D. Cytokinesis failure generating tetraploids promotes tumorigenesis in p53-null cells. Nature 2005; 437:1043-7; PMID:16222300; http://dx.doi.org/ 10.1038/nature04217 [DOI] [PubMed] [Google Scholar]
- 15.Zack TI, Schumacher SE, Carter SL, Cherniack AD, Saksena G, Tabak B, Lawrence MS, Zhsng CZ, Wala J, Mermel CH et al.. Pan-cancer patterns of somatic copy number alteration. Nat Genet 2013; 45:1134-40; PMID:24071852; http://dx.doi.org/ 10.1038/ng.2760 [DOI] [PMC free article] [PubMed] [Google Scholar]
- 16.Vitale I, Galluzzi L, Senovilla L, Criollo A, Jemaa M, Castedo M, Kroemer G. Illicit survival of cancer cells during polyploidization and depolyploidization. Cell Death Differ 2011; 18:1403-13; PMID:21072053; http://dx.doi.org/ 10.1038/cdd.2010.145 [DOI] [PMC free article] [PubMed] [Google Scholar]
- 17.Kepp O, Semeraro M, Bravo-San Pedro JM, Bloy N, Buque A, Huang X, Zhou H, Senovilla L, Kroemer G, Galluzzi L et al.. eIF2alpha phosphorylation as a biomarker of immunogenic cell death. Semin Cancer Biol 2015; 33:86-92; PMID:25749194; http://dx.doi.org/ 10.1016/j.semcancer.2015.02.004 [DOI] [PubMed] [Google Scholar]
- 18.Panaretakis T, Kepp O, Brockmeier U, Tesniere A, Bjorklund AC, Chapman DC, Durchschlag M, Joza N, Pierron G, van Endert P et al.. Mechanisms of pre-apoptotic calreticulin exposure in immunogenic cell death. EMBO J 2009; 28:578-90; PMID:19165151; http://dx.doi.org/ 10.1038/emboj.2009.1 [DOI] [PMC free article] [PubMed] [Google Scholar]
- 19.Boileve A, Senovilla L, Vitale I, Lissa D, Martins I, Metivier D, van den Brink S, Clevers H, Galluzzi L, Castedo M et al.. Immunosurveillance against tetraploidization-induced colon tumorigenesis. Cell Cycle 2013; 12:473-9; PMID:23324343; http://dx.doi.org/ 10.4161/cc.23369 [DOI] [PMC free article] [PubMed] [Google Scholar]
- 20.Senovilla L, Vitale I, Martins I, Kepp O, Galluzzi L, Zitvogel L, Castedo M, Kroemer G. An anticancer therapy-elicited immunosurveillance system that eliminates tetraploid cells. Oncoimmunol 2013; 2:e22409; PMID:23482968; http://dx.doi.org/ 10.4161/onci.22409 [DOI] [PMC free article] [PubMed] [Google Scholar]
- 21.Kepp O, Menger L, Vacchelli E, Locher C, Adjemian S, Yamazaki T, Martins I, Sukkurwala AQ, Michaud M, Senovilla L et al.. Crosstalk between ER stress and immunogenic cell death. Cytokine Growth Factor Rev 2013; 24:311-8; PMID:23787159; http://dx.doi.org/ 10.1016/j.cytogfr.2013.05.001 [DOI] [PubMed] [Google Scholar]
- 22.Bloy N, Sauvat A, Chaba K, Buque A, Humeau J, Bravo-San Pedro JM, Bui J, Kepp O, Kroemer G, Senovilla L et al.. Morphometric analysis of immunoselection against hyperploid cancer cells. Oncotarget 2015; 6:41204-15; PMID:26517677; http://dx.doi.org/ 10.18632/oncotarget.5400 [DOI] [PMC free article] [PubMed] [Google Scholar]
- 23.Shah C, Wobb J, Manyam B, Kundu N, Arthur D, Wazer D, Fernandez E, Vicini F. Management of Ductal Carcinoma in Situ of the Breast: A Review. JAMA Oncol 2016; PMID:27253401; http://dx.doi.org/ 10.1001/jamaoncol.2016.0525 [DOI] [PubMed] [Google Scholar]
- 24.Decker MR, Trentham-Dietz A, Loconte NK, Neuman HB, Smith MA, Punglia RS, Greenberg CC, Wilke LG. The Role of Intraoperative Pathologic Assessment in the Surgical Management of Ductal Carcinoma In Situ. Ann Surg Oncol 2016; PMID:27026436; http://dx.doi.org/ 10.1245/s10434-016-5192-5 [DOI] [PMC free article] [PubMed] [Google Scholar]
- 25.Morita M, Yamaguchi R, Tanaka M, Tse GM, Yamaguchi M, Kanomata N, Naito Y, Akiba J, Hattori S, Minami S et al.. CD8 tumor-infiltrating lymphocytes contribute to spontaneous “healing” in HER2-positive ductal carcinoma in situ. Cancer Med 2016; 5:1607-18; PMID:27061242; http://dx.doi.org/ 10.1002/cam4.715 [DOI] [PMC free article] [PubMed] [Google Scholar]
- 26.Thompson E, Taube JM, Elwood H, Sharma R, Meeker A, Warzecha HN, Argani P, Cimino-Mathews A, Emens LA. The immune microenvironment of breast ductal carcinoma in situ. Mod Pathol 2016; 29:249-58; PMID:26769139; http://dx.doi.org/ 10.1038/modpathol.2015.158 [DOI] [PMC free article] [PubMed] [Google Scholar]
- 27.Fucikova J, Becht E, Iribarren K, Goc J, Remark R, Damotte D, Alifano M, Devi P, Biton J, Germain C et al.. Calreticulin Expression in Human Non-Small Cell Lung Cancers Correlates with Increased Accumulation of Antitumor Immune Cells and Favorable Prognosis. Cancer Res 2016; 76:1746-56; PMID:26842877; http://dx.doi.org/ 10.1158/0008-5472.CAN-15-1142 [DOI] [PubMed] [Google Scholar]
- 28.Shen S, Niso-Santano M, Adjemian S, Takehara T, Malik SA, Minoux H, Souquere S, Mariño G, Lachkar S, Senovilla L et al.. Cytoplasmic STAT3 represses autophagy by inhibiting PKR activity. Mol Cell 2012; 48:667-80; PMID:23084476; http://dx.doi.org/ 10.1016/j.molcel.2012.09.013 [DOI] [PubMed] [Google Scholar]
- 29.Wemeau M, Kepp O, Tesniere A, Panaretakis T, Flament C, De Botton S, Zitvogel L, Kroemer G, Chaput N. Calreticulin exposure on malignant blasts predicts a cellular anticancer immune response in patients with acute myeloid leukemia. Cell Death Dis 2010; 1:e104; PMID:21368877; http://dx.doi.org/ 10.1038/cddis.2010.82 [DOI] [PMC free article] [PubMed] [Google Scholar]
- 30.van Der Laak JA, Pahlplatz MM, Hanselaar AG, de Wilde PC. Hue-saturation-density (HSD) model for stain recognition in digital images from transmitted light microscopy. Cytometry 2000; 39:275-84; PMID:10738280; http://dx.doi.org/ 10.1002/(SICI)1097-0320(20000401)39:4%3c275::AID-CYTO5%3e3.0.CO;2-8 [DOI] [PubMed] [Google Scholar]
- 31.Rusakiewicz S, Semeraro M, Sarabi M, Desbois M, Locher C, Mendez R, Vimond N, Concha A, Garrido F, Isambert N et al.. Immune infiltrates are prognostic factors in localized gastrointestinal stromal tumors. Cancer Res 2013; 73:3499-510; PMID:23592754; http://dx.doi.org/ 10.1158/0008-5472.CAN-13-0371 [DOI] [PubMed] [Google Scholar]
- 32.Vacchelli E, Semeraro M, Enot DP, Chaba K, Poirier Colame V, Dartigues P, Perier A, Villa I, Rusakiewicz S, Gronnier C et al.. Negative prognostic impact of regulatory T cell infiltration in surgically resected esophageal cancer post-radiochemotherapy. Oncotarget 2015; 6:20840-50; PMID:26369701; http://dx.doi.org/ 10.18632/oncotarget.4428 [DOI] [PMC free article] [PubMed] [Google Scholar]
- 33.Vacchelli E, Semeraro M, Adam J, Dartigues P, Zitvogel L, Kroemer G. Immunosurveillance in esophageal carcinoma: The decisive impact of regulatory T cells. Oncoimmunol 2016; 5:e1064581; PMID:27057430; http://dx.doi.org/ 10.1080/2162402X.2015.1064581 [DOI] [PMC free article] [PubMed] [Google Scholar]
Associated Data
This section collects any data citations, data availability statements, or supplementary materials included in this article.