Abstract
Piperaquine (PQ) is part of a first-line treatment regimen for Plasmodium falciparum malaria recommended by the World Health Organization (WHO). We aimed to determine the major metabolic pathway(s) of PQ in vitro. A reliable, validated tandem mass spectrometry method was developed. Concentrations of PQ were measured after incubation with both human liver microsomes (HLMs) and expressed cytochrome P450 enzymes (P450s).
In pooled HLMs, incubations with an initial PQ concentration of 0.3 µM resulted in a 34.8 ± 4.9% loss of substrate over 60 min, corresponding to a turnover rate of 0.009 min−1 (r2 = 0.9223). Miconazole, at nonspecific P450 inhibitory concentrations, resulted in almost complete inhibition of PQ metabolism.
The greatest inhibition was demonstrated with selective CYP3A4 (100%) and CYP2C8 (66%) inhibitors. Using a mixture of recombinant P450 enzymes, turnover for PQ metabolism was estimated as 0.0099 min−1; recombinant CYP3A4 had a higher metabolic rate (0.017 min−1) than recombinant CYP2C8 (p < .0001).
Inhibition of CYP3A4-mediated PQ loss was greatest using the selective inhibitor ketoconazole (9.1 ± 3.5% loss with ketoconazole vs 60.7 ± 5.9% with no inhibitor, p < .0001).
In summary, the extent of inhibition of in vitro metabolism with ketoconazole (83%) denotes that PQ appears to be primarily catalyzed by CYP3A4. Further studies to support these findings through the identification and characterization of PQ metabolites are planned.
Keywords: Antimalarial, piperaquine, cytochrome p450, metabolism, CYP3A4, malaria, in vitro
Introduction
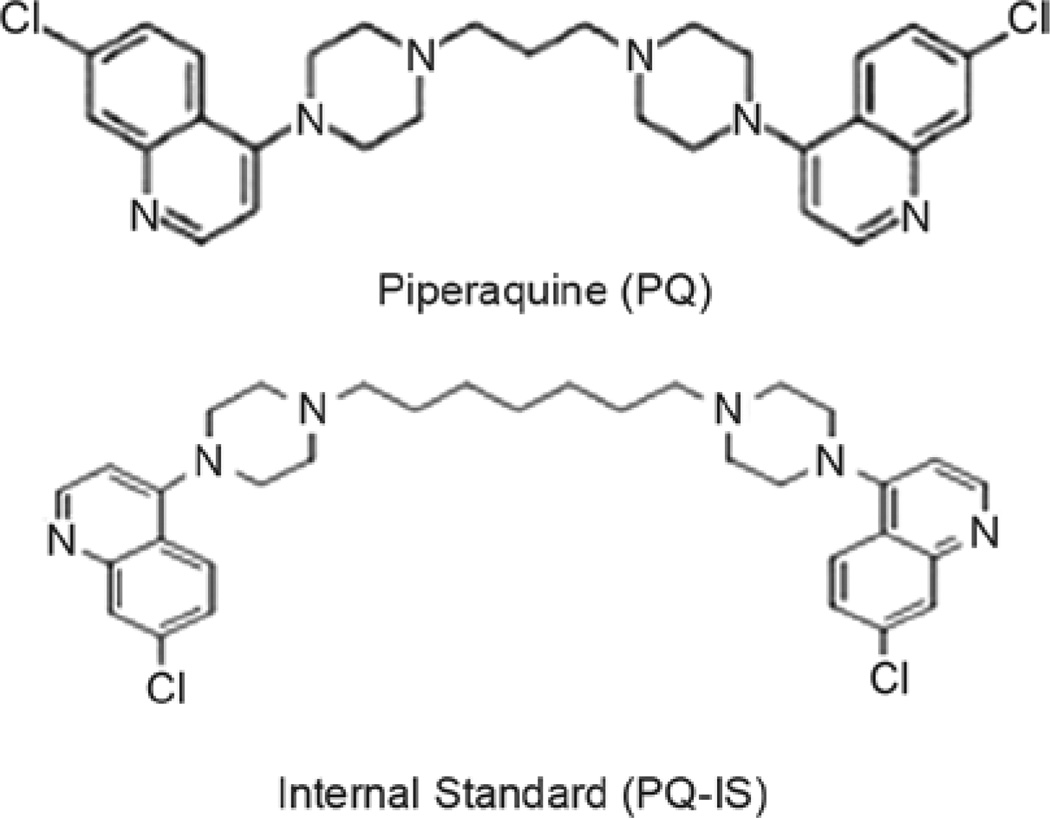
Malaria is a serious and sometimes fatal disease with an estimated 243 million new cases and 863,000 deaths annually worldwide (WHO, World Malaria Report 2009). Increasing drug resistance has lead to a demand for novel antimalarial treatments, most notably artemisinin combination therapies (ACTs). ACTs consist of a shortacting potent artemisinin derivative combined with a long-acting partner drug to minimize the risk of subtherapeutic antimalarial levels which select for resistant mutants (Myint et al. 2007). Piperaquine (PQ; Figure 1) is a bisquinoline drug with a similar proposed mechanism of action as other quinoline antimalarials (Davis et al. 2005). PQ is now available as a component of the ACT, dihydroartemisinin-piperaquine (DHA-PQ; Artekin™). DHA-PQ has been shown in clinical trials to be safe and highly effective in the treatment of uncomplicated malaria caused by Plasmodium falciparum or vivax (Hung et al. 2004; Karunajeewa et al. 2008). Recently, the World Health Organization (WHO) has added DHA-PQ to the list of 1st-line treatment options for uncomplicated P. falciparum malaria (World Health Organization 2010). Despite the emerging prominent role of DHA-PQ in the management of malaria, scant data exists on its metabolic pathways.
Figure 1.
Chemical structures of piperaquine and internal standard used in these studies.
Recent in vivo studies indicate that PQ exhibits multi-phasic pharmacokinetics with a long terminal half-life (20 to 30 days) potentially associated with extensive tissue binding (Hung et al. 2004; Röshammar et al. 2006; Karunajeewa et al. 2008). Based on the detection of a carboxylic acid metabolite (M1) and minor N-oxidation metabolite (M2) in the blood and urine, a pharmacokinetic study in two healthy adults postulated that PQ elimination involved a combination of hepatic metabolism and renal excretion (Tarning et al. 2006). The major route of elimination was proposed as P450-mediated hydroxylation to hydroxy-piperaquine, followed by hydrolysis to an aldehyde, then oxidation by aldehyde dehydrogenase to yield M1. Demonstrating the route of metabolism can be used to determine if in vivo drug interaction studies are warranted. The in vitro studies described below were designed to identify the major P450 enzyme(s) involved in PQ metabolism.
Materials and methods
Materials
Chemicals
PQ tetraphosphate tetrahydrate (>99% purified by HPLC) was purchased from Yick-Vic Chemicals and Pharmaceuticals Ltd (Hong Kong, China; Figure 1). A PQ analogue (7-chloro-4-(4-{7-[4-(7-chloro-4-quinolinyl)-1-piperazinyl] heptyl}-1-piperazinyl)quinoline) was selected as the internal standard (IS) (Singhal et al. 2007) and purchased from Ryan Scientific (Mt. Pleasant, SC; Figure 1). The P450 inhibitors miconazole, quinidine, ticlopidine and ketoconazole were purchased from Sigma Aldrich (St. Louis, MO). Sulfaphenazole and furafylline were purchased from BD Biosciences (San Jose, CA).
Human liver microsomes and recombinant enzymes
A mixture of purified P450 liver microsomes expressed from human-derived cDNA (Supermix©, protein content of 5.0 mg/mL) contained the following specific enzymes: CYP1A2, CYP2C9, CYP2C8, CYP2C19 and CYP3A4. Individual cDNA expressed CYP3A4 and CYP2C8 enzymes were derived from baculovirus-infected cells (Supersomes©, contained protein contents of 4.0 and 3.0 mg/mL, respectively). A mixture of 150 donor human liver tissue fraction pools with equal gender (BD UltraPool HLM 150©) containing a protein content of 20 mg/mL were also utilized. All above enzymes and liver fractions were purchased from BD™ Biosciences (San Jose, CA) and stored at −70°C prior to experimentation.
Tandem mass spectrometry analysis
Liquid chromatographic tandem mass spectrometry method
Prior liquid chromatographic tandem mass spectrometry (LC/MS/MS) methods for detecting PQ in plasma were modified for quantification in potassium phosphate buffer (Singhal et al. 2007; Lindegardh et al. 2008; Tarning & Lindegardh 2008). Analyte separation was conducted on twin PE series 200 micro LC pumps equipped with a PE series 200 autosampler (Perkin Elmer, Norwalk, Connecticut) using a ZORBAX® Eclipse XDB Narrow Bore C18 analytical column, 2.1 × 50 mm, 5 µm (Agilent Technologies, Santa Clara, CA). MS/MS detection was performed on a Triple stage quadrapole API 2000™ Mass Spectrometer (Applied Biosystems/MDS SCIEX, Foster city, CA) equipped with turbo spray ionization (TSI) delivering 2.5 mM ammonium bicarbonate pH 9.9/methanol 1:4 (v/v) in isocratic mode at a flow rate of 0.4 mL/min for 6.5 min at 25°C (Singhal et al. 2007). Injection volume was 10 µL. Before each injection, the needle was cleaned with two preinjection washes and after injection with two post-injection washes. Optimal MS parameters were chosen by direct infusion of each compound separately through the MS/MS detector at a concentration of 1 µg/mL in 1:1 MeOH: water with 0.25% formic acid. LC/MS/MS conditions were as follows: the ion pairs 535/288 for PQ and 591/205 for the IS. were selected for mass spectrometry acquisition in multiple reaction monitoring (MRM) mode, electrospray ionization in positive mode, collision-activated dissociation gas of 4 psi, curtain gas of 25 psi, spray voltage of 5 bKV, ion source gas 1 (nitrogen) of 40 psi, ion source gas 2 (nitrogen) of 70 psi and a declustering potential of 66 V, collision energy of 48 v for PQ and 75 v for the IS.
Analysis
Chromatographic data acquisition, peak integration and quantification were performed using the Analyst™ software package (version 1.3; Applied Biosystems/MDS SCIEX, Foster City, CA). Retention times for PQ and PQ-IS were 1.33 min and 4.5 min, respectively.
Calibration standards and validation
Each sample was spiked with 15 µL of IS working solution (10 µg/mL). Calibration standards consisting of 20, 50, 100, 200, 500, 750, and 1000 ng/mL were prepared from working solutions in 0.1% aqueous formic acid/acetonitrile 1:1 (V/V). The upper limit of quantification was set to 1000 ng/mL since higher concentrations produced carry-over effects higher than 20% of the response for an LLOQ sample. The specificity of the method was examined by analyzing (n = 6) blank phosphate buffer samples which did not yield significant interference at the retention time of the analyte. Seven-point calibration standard curves were calculated and fitted by 1/x weighted linear regression of the peak-area ratio of PQ to IS versus the concentration of PQ in each standard sample. Linear calibration curves were established over the range of 20–1000 ng/mL and a lower limit of detection (LLOD) was 10 ng/mL. This was the lowest concentration that could be reliably distinguished from background noise (≥3 times the S.D. of a blank plasma sample). The precision (CV %) and accuracy (dev %) of the back-calculated calibrator values over 3 days, ranged from 1.6 to 9.6% and −6.7 to 4.3%, respectively. For intra- and interassay precision and accuracy, 5 replicates of validation samples at each of 4 different drug concentrations (20, 30, 300, and 900 ng/mL) were analyzed on three separate days. A fresh calibration curve was used each day. The intraday precision (CV %) of this method for PQ ranged from 1.1 to 3.1%, and the intraday accuracy (dev %) ranged from −4.8 to 7.6%. The interassay precision (CV %) was 6.1, 5.6, 5.9, and 2.2%, respectively for LLOQ, low, medium, and high concentrations. The overall accuracy (% dev) from nominal value was 7.4, 3.3, 7.7, and −4.0% for LLOQ, low, medium, and high concentrations, respectively.
Stability studies
Due to the instability of PQ in glass, plastic Eppendorf© tubes were used for solution and sample preparation (Singhal et al. 2007). The stability of PQ and the PQ-IS stock solutions were evaluated in different temperature and timing conditions as follows. PQ (1 mg/mL) in 0.1% formic acid/acetonitrile 1:1 (V/V) demonstrated stability after storage at −70°C for 21 days. The percent difference (3.59%) between the mean PQ peak area (4.81 × 10⁶ cts, CV 3.68%) of the stored samples compared to the mean peak area (4.64 × 10⁶ cts, CV 0.69%) obtained from the fresh samples met FDA methods validation standards and the mean peak areas were not statistically different (p = .187).
To test for sample stability during processing, the peak area of PQ (750 µg/mL) stored at room temperature for 24 h was compared to the PQ peak area of fresh samples (4.73, CV 3.623%) in 0.1% formic acid/acetonitrile 1:1 (V/V) and determined to be equivalent (p = .3754). To examine the stability of the internal standard, PQ-IS samples (1.75 µg/mL) were stored in triplicate at 22°C in 0.1% formic acid/acetonitrile 1:1 (V/V) for 7 days. The percent difference of the mean peak areas of stored compared to fresh samples was acceptable (0.51%) and peak areas were statistically similar (p = .320).
Incubations
Oxidative metabolism of PQ in pooled microsomal fractions
Working solutions of PQ and PQ-IS were prepared in 0.1% aqueous formic acid/acetonitrile 1:1. P450-dependent metabolism of PQ was explored based on previously published methods and current industry guidance (Störmer et al. 2000b; Harper & Brassil 2008). Briefly, pooled human P450 microsomes, PQ, 0.4 U/L glucose-6-phosphate dehydrogenase (G6PDH) and cytochrome b5 were preincubated in 0.10 M potassium phosphate buffer (pH 7.4) at 37.5°C for 5 min. Reactions were initiated by addition of 1.3 mM NADP+ and 3.3 mM glucose-6-phosphate (G6P) to achieve a final PQ concentration of 0.3 µM or 2 µM, HLM concentration of 0.1 mg/mL, and volume of 125 µL. Reactions proceeded at 37.5°C and were terminated at designated time points (0, 1, 15, 30, 45, or 60 min) by addition of 62.5 µL ice-cold acetonitrile and placement on ice for 5 min. Reactions were run in the absence of enzyme as negative controls. All reactions were run in triplicate.
Heat inactivation of flavin monooxygenases in microsomal fractions
In order to rule out flavin monooxygenase (FMO)-mediated N-oxidation, a heat inactivation study was conducted. Incubations detecting oxidative metabolism of PQ in HLMs were modified by including a preincubation at 50°C for an additional 2 min (Rodrigues 2007). Reactions in triplicate were terminated at designated time points (0, 1, 30, and 60 min).
Cytochrome P450 inhibition in microsomal fractions
In order to determine the role of cytochrome P450 enzymes in PQ metabolism, miconazole was utilized at concentrations at which it acts as a nonspecific P450 inhibitor (5 µM) (Zhang et al. 2002). In order to characterize the specific P450 isoforms responsible for the metabolism of PQ, isoform selective inhibition was conducted based on industry standard inhibitors (Kajosaari et al. 2005; Harper & Brassil 2008). For nonmechanism based inhibition, the protocol for oxidative metabolism in HLMs was modified to achieve a final PQ concentration of 0.6 µM with standard inhibitors (5 µM quinidine, 25 µM quercetin, 20 µM sulfaphenazole or 1 µM ketoconazole) (Jancová et al. 2007; Harper & Brassil 2008). Reactions were incubated in triplicate at 37.5°C then terminated at 0, 1, 30 and 60 min.
Mechanism based inhibitors required an activation step involving preincubation of working mixtures (Kunze & Trager 1993; Donahue et al. 1997; Ko et al. 2000; Harper & Brassil 2008). Inhibitor working mixtures containing PQ, 0.1 mg/mL BD UltraPool HLM 150©, 1.3 mM NADP+, 0.4 U/mL G6PDH, 3.3 mM G6P, a standard inhibitor (100 µM furafylline or 25 µM ticlopidine) in 0.10 M potassium phosphate buffer (pH 7.4) were incubated for 30 min at 37.5°C. Working mixture aliquots (25 µL) were removed then preincubated for 5 min with 0.1 mg/mL human recombinant P450 microsomes (BD UltraPool HLM 150©), 1.3 mM NADP+, 0.4 U/mL G6PDH, 3.3 mM G6P and a standard inhibitor (furafylline or ticlopidine) in 0.10 M potassium phosphate buffer (pH 7.4) at 37.5°C. The mixture was aliquoted into separate tubes then initiated with PQ to achieve a final substrate concentration of 0.6 µM, inhibitor concentration of 20 µM furafylline or 5 µM ticlopidine and volume of 125 µL. Reactions in triplicate were incubated at 37.5°C then terminated at 0, 1, 30, and 60 min.
Oxidative metabolism of PQ in cDNA expressed enzymes
A second in vitro metabolic system utilized cDNA expressed enzymes according to published guidelines (Harper & Brassil 2008; Störmer et al. 2000a; Food and Drug Administration, 2001). Preincubation mixtures contained 1.25 pmol (0.025 mg/mL) human recombinant P450 microsomes, PQ, and 0.4 U/mL G6PDH in 0.10 M potassium phosphate buffer (pH 7.4). NADP+ (1.3 µM) and 3.3 mM G6P were added to initiate the reaction. PQ metabolism was studied at 2 µM and 0.2 µM concentrations. Reactions were incubated at 37.5° then terminated at 0, 1, 15, 30, and 60 min by addition of 62.5 µL ice-cold acetonitrile. Reactions were run in triplicate. Assays were also conducted containing individually expressed recombinant P450 enzymes (Supersomes©). The procedure for oxidative metabolism of PQ in recombinant P450s was modified to achieve a final PQ concentration of 0.2 µM and a microsomal content of 0.625 pmol (0.02 mg/mL) CYP3A4 or 0.625 pmol (0.015 mg/mL) of CYP2C8.
Selective P450 inhibition studies with cDNA expressed enzymes
To confirm the metabolic findings with recombinant P450s, a CYP3A4 selective inhibition assay was conducted (Harper & Brassil 2008). Incubation assays containing human recombinant CYP3A4 microsomes (Supersomes©) were modified with the addition of the selective inhibitor ketoconazole. The final reagent concentrations in the incubation were 0.2 µM PQ and 1 µM ketoconazole. Reactions were run in triplicate.
Sample processing
For incubation of samples with high initial PQ concentrations (2 µM), a 1:4 dilution was conducted using 0.1% aqueous formic acid/acetonitrile 1:1 (v/v). No dilution was conducted for samples with a lower initial concentration. An aliquot of the sample (70 µL) was mixed with 15 µL of IS working solution (10 µg/mL) in 200 µL HPLC microvials and 10 µL was injected for LC/MS/MS analysis. Each level of the calibration curve was measured with two sets of calibrators, one at the start and one at the end of the run.
Data analysis
For oxidative metabolism studies, loss of substrate of the parent drug >20% over a 60 min incubation was fitted using nonlinear regression; loss <20% was fitted using linear regression (Harper & Brassil 2008). For inhibition studies, the extent of inhibition was calculated (shown in the equation below). The Student’s t-test was used to evaluate the percent loss of substrate with FMO inactivation compared with negative controls, net loss of PQ with individual recombinant enzymes, and percent loss of PQ in recombinant CYP3A4 inhibition studies. ANOVA was used to evaluate the net loss of PQ in the presence of nonselective and selective inhibitors.
Results
Metabolism studies in human liver microsomes
Substrate depletion studies in human liver microsomal fractions
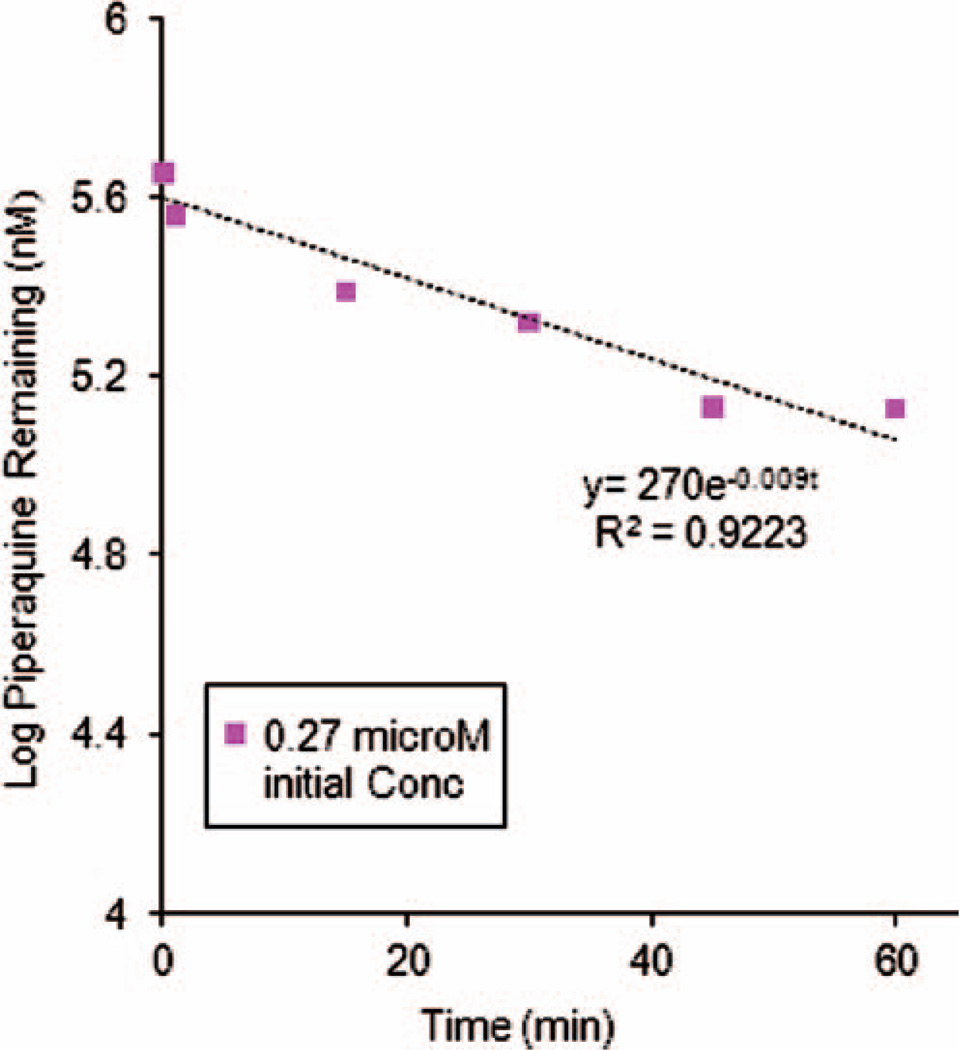
In order to determine whether or not enzymes present in human liver microsomal (HLM) fractions were involved in PQ metabolism, substrate depletion studies were performed with a donor pool of HLMs. Loss of PQ (0.3 µM starting concentration) was 34.8 ± 4.9% over 60 min. A nonlinear regression fit of the substrate concentration over time yielded a rate of degradation of k = 0.009 min−1 (r2 = 0.922) (Figure 2).
Figure 2.
Log transformed piperaquine depletion curves from human liver microsome studies. The initial piperaquine concentration was 0.27 µM and data shown are means ± SD of triplicate determinations. Nonlinear regression fitting yielded an estimated rate constant of 0.009 min−1.
Role of cytochrome P450s and flavin monooxygenases in the metabolism of PQ
Given the evidence of substrate depletion in whole HLM fractions, we attempted to ascertain the specific enzyme groups involved in drug biotransformation. Miconazole (5 µM) was utilized in HLM incubations at concentrations where nonspecific P450 inhibition has been noted (Zhang et al. 2002). The percent inhibition of PQ metabolism was 100% with miconazole at nonselective concentrations (data not shown).
Heating of HLM fractions allowed us to ascertain the role of flavin monooxygenases (FMOs) in PQ metabolism. Thermal inactivation of FMOs did not significantly alter PQ depletion (47.9% versus 34.6% depletion at 60 min, respectively; p = .59).
Selective inhibition of P450 isoforms in human liver microsomal fractions
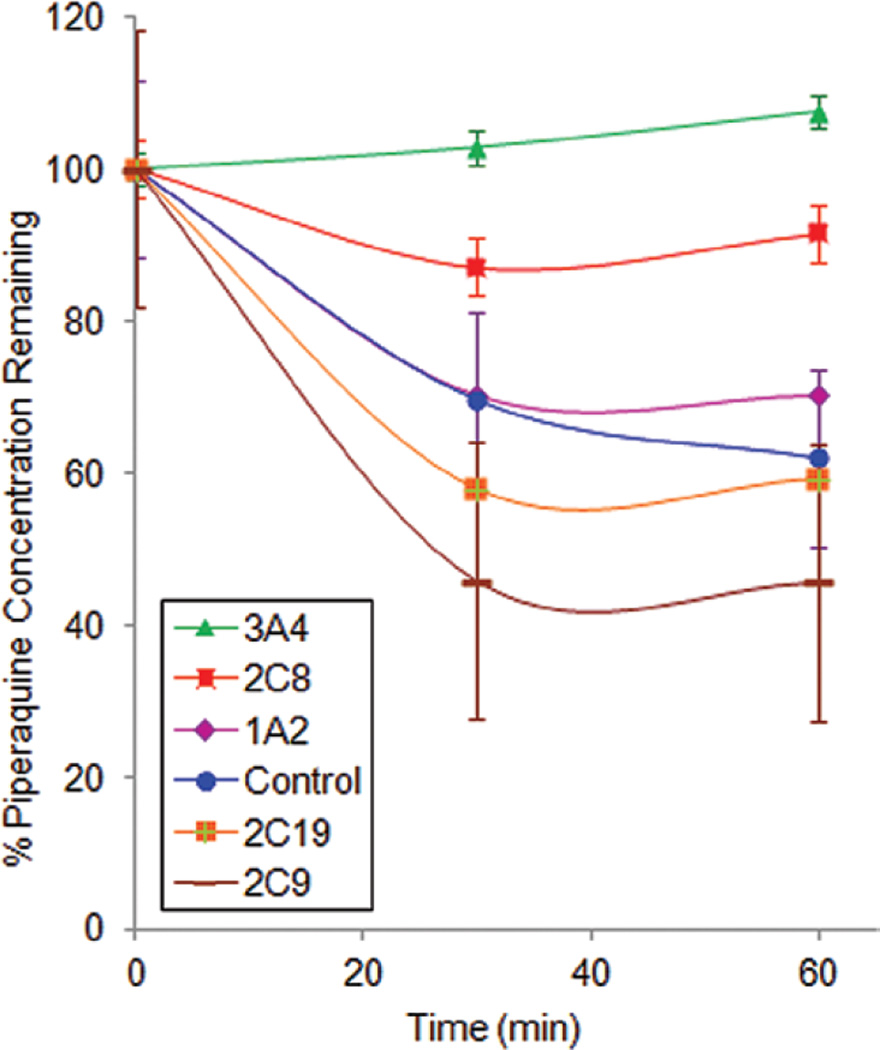
The above studies suggested a role for P450 enzymes, but not FMOs, in the metabolism of PQ. As a next step, P450 isoform selective inhibition studies were undertaken. Industry standard inhibitors were utilized in HLM incubations at recommended concentrations and substrate depletion was assessed (Figure 3). The 95% confidence intervals of % PQ remaining for the incubations with ticlopidine (CYP2C19 inhibitor), sulfaphenazole (CYP2C9 inhibitor) and furafylline (CYP1A2 inhibitor) overlapped with the control (no inhibitor) at 30 and 60 min. However, ketoconazole (more selective for CYP3A4 at a concentration of 1 µM) and quercetin (CYP2C8 inhibitor) exhibited 100% and 66% inhibition of PQ (0.6 µM) metabolism, respectively. Incubations with quinidine (CYP2D6 inhibitor) showed an average 15% inhibition at high PQ initial concentrations, however results were not statistically significant.
Figure 3.
The effect of isoform selective P450 inhibitors on piperaquine metabolism. The data is expressed as percent piperaquine remaining (mean ± SD of triplicate determinations) as a function of time following human liver microsome incubations in the presence of isoform selective P450 inhibitors. The starting concentration of piperaquine was 0.6 µM. The following concentrations of inhibitors were used: 1 µM ketoconazole (CYP3A4), 5 µM ticlopidine (CYP2C19), 20 µM furafylline (CYP1A2), 20 µM sulfaphenazole (2C9), and 25 µM quercetin (CYP2C8).
Studies of PQ metabolism by cDNA expressed enzymes
Role of recombinant P450s (Supermix) in the metabolism of PQ
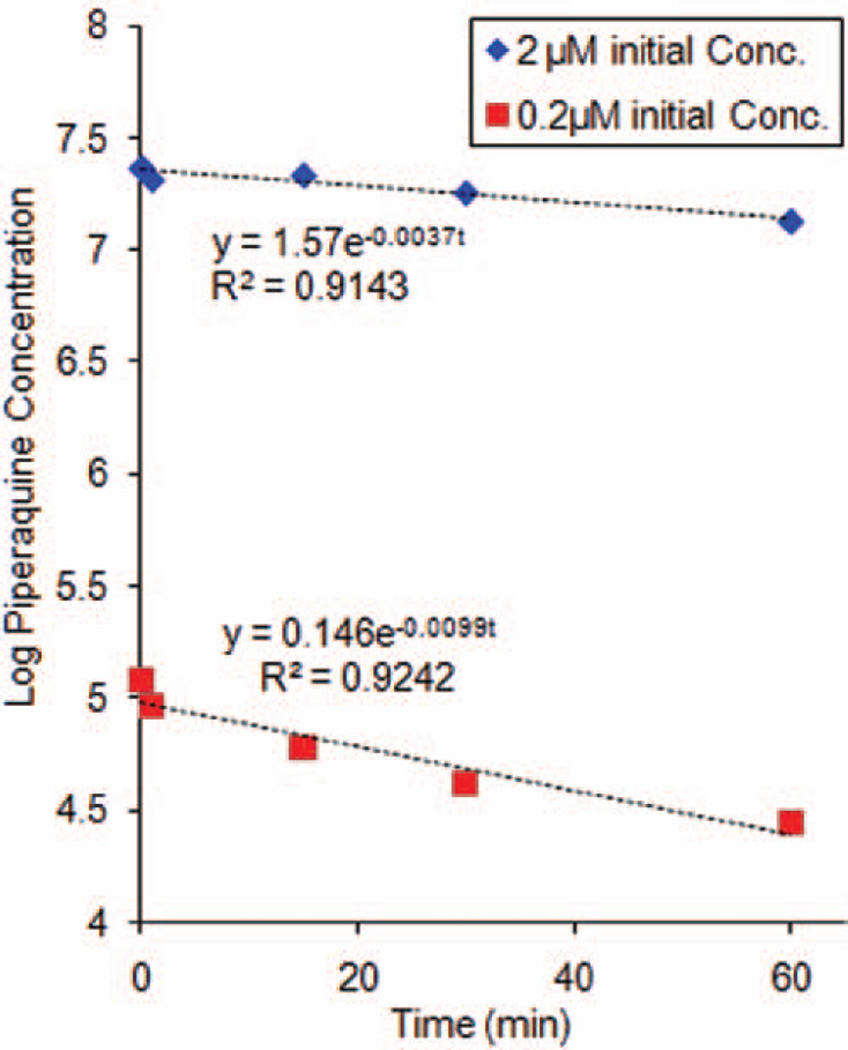
To provide supporting evidence for the role of cytochrome P450s in the metabolism of PQ, P450 reaction phenotyping was conducted with recombinant cDNA expressed P450 enzymes. PQ incubation in the presence of a mixture of P450 enzymes (CYP1A2, CYP2C9, CYP2C8, CYP2C19 and CYP3A4) revealed a 20% loss of parent drug at 2 µM and 46% loss at 0.2 µM. The rate constants describing PQ metabolism were 0.0037 and 0.0099 min−1 at high (2 µM) and low (0.2 µM) initial concentrations, respectively (Figure 4).
Figure 4.
Log transformed piperaquine depletion curves from incubation with a mixture of recombinant P450 isoforms. Data shown are means ± SD of triplicate determinations. Nonlinear regression fitting yielded estimated rate constants of 0.0037 min−1 and 0.0099 min−1 for 2 and 0.2 µM piperaquine initial concentrations, respectively.
Role of recombinant CYP3A4 and CY2C8 in the metabolism of PQ
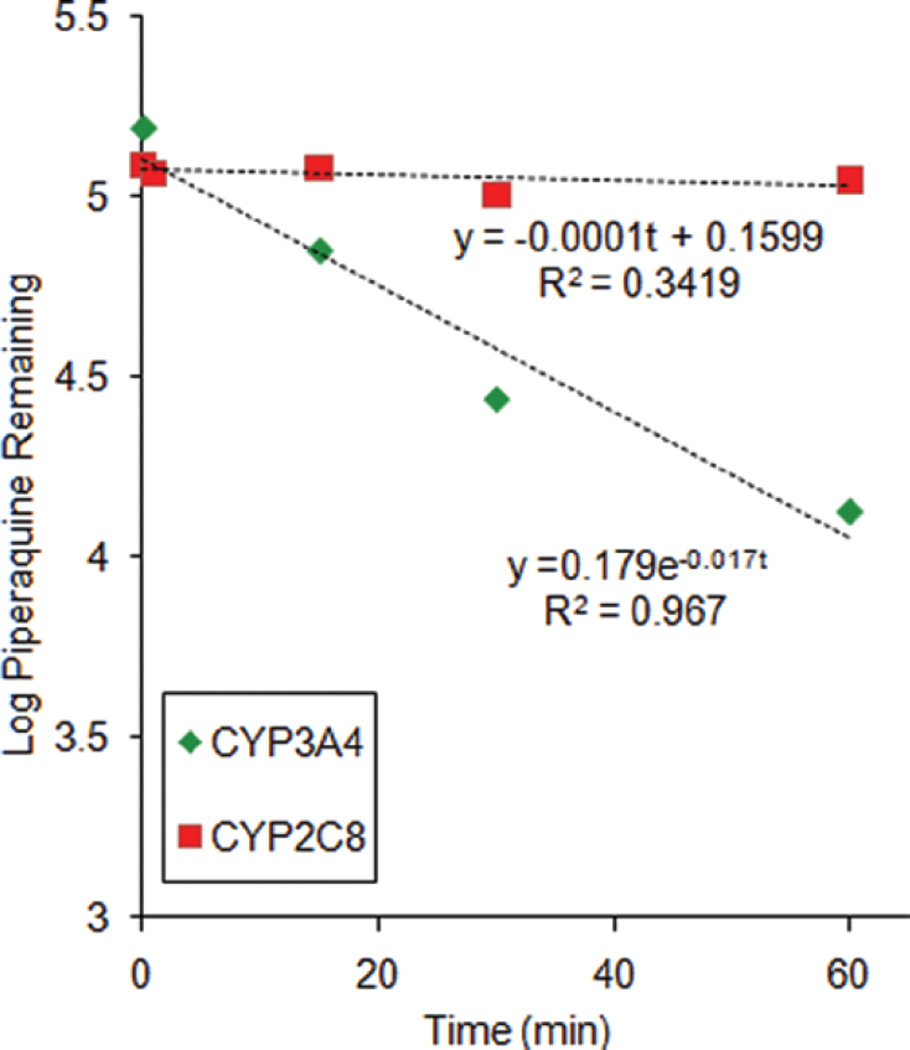
Based on data obtained from HLM and a mixture of recombinant P450s, further testing was conducted using individual recombinant P450 isoforms. Less than 20% PQ depletion was observed for incubations with CYP2C8, yielding an estimated turnover rate of 0.0001 min−1 (Figure 5). The corresponding rate constant for CYP3A4 was 0.017 min−1. The difference between the net decrease in PQ concentration in CYP3A4 (118.0 ± 4.5 nM) and CYP2C8 (10.0 ± 14.3 nM) incubations was statistically significant (p < .0001).
Figure 5.
Log transformed piperaquine depletion curves from incubation with recombinant CYP3A4 or CYP2C8. Data shown are means ± SD of triplicate determinations. Nonlinear regression fitting yielded estimated rate constants for CYP2C8 and CYP3A4 metabolism of 0.001 and 0.017 min−1 respectively.
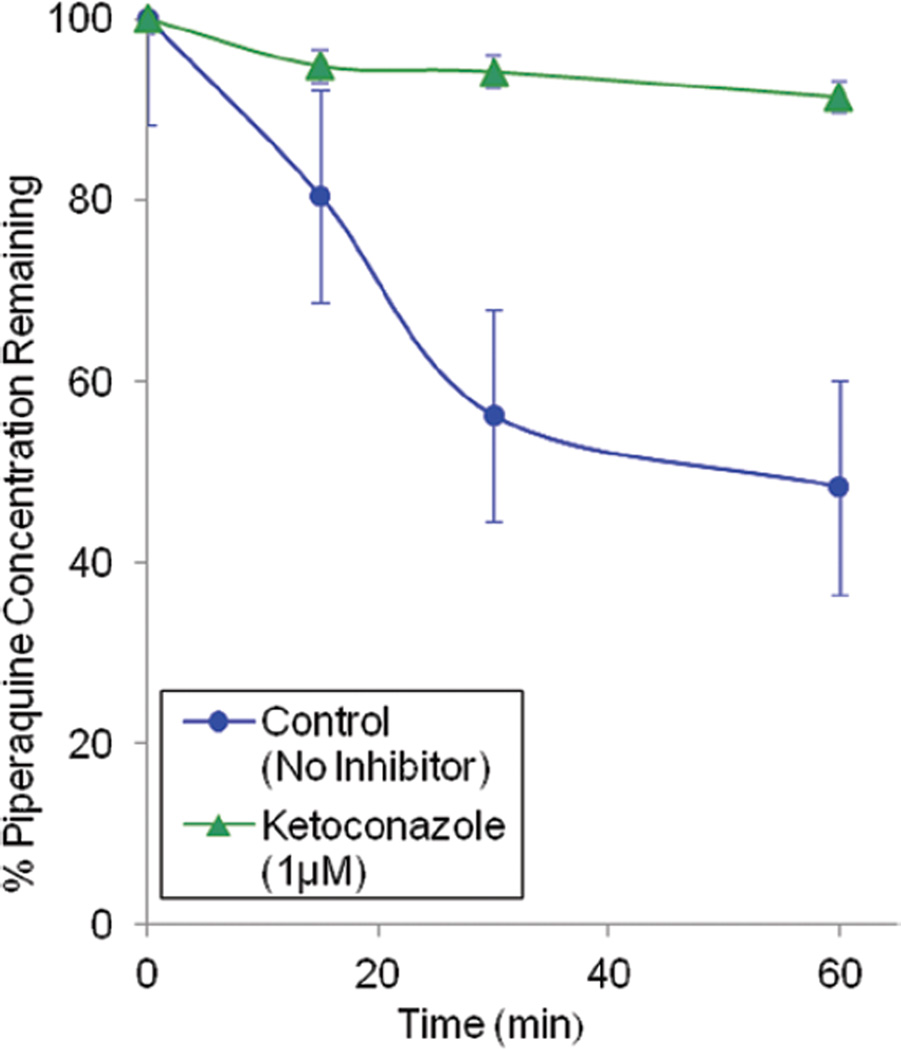
The higher rate of PQ metabolism by CYP3A4 compared to CYP2C8 prompted further exploration using CYP3A4 selective inhibitors. PQ depletion over 60 min was only 9.1 ± 3.5% in the presence of 1 µM ketoconazole compared to 60.7 ± 5.9% without inhibitor (Figure 6, p < .0001). The extent of inhibition by ketoconazole was calculated as 83%.
Figure 6.
The effect of ketoconazole on piperaquine metabolism. The data is expressed as percent piperaquine remaining (mean ± SD of triplicate determinations) as a function of time following incubations with recombinant CYP3A4 in the presence or absence of ketoconazole (1 µM).
Discussion
We developed and validated a LC/MS/MS method for the quantification of PQ for in vitro studies. Using this method, we determined that in vitro PQ metabolism was mediated by cytochrome P450 pathways, primarily by CYP3A4. Our initial studies in pooled HLMs showed a 35 ± 5% loss of PQ over 60 min, corresponding to a turnover rate of 0.009 min−1 (r = 0.922). After demonstrating that the loss of PQ in HLMs was likely due to the action of P450 enzymes, and not FMO-mediated N-oxidation, we went on to characterize the effect of CYP isoform selective inhibitors. The greatest degree of inhibition was demonstrated with CYP3A4 (100%) and CYP2C8 (66%) selective inhibitors. Using a mixture of recombinant P450s, at least 30% PQ loss was demonstrated over 60 min with an estimated turnover number of 0.0099 min−1. Individual recombinant enzyme studies supported CYP3A4 as the major enzyme catalyzing PQ metabolism.
Our in vitro studies utilized measurement of substrate depletion to identify the major enzymes involved in PQ metabolism. Although potential metabolites have been described in the literature, these entities have not been extensively characterized and are not readily available (Tarning et al. 2006). FDA guidelines and current industry standards for drug development recommend at least two in vitro methods be performed to confirm metabolism (Bjornsson et al. 2003; Harper & Brassil 2008). Pooled human liver microsomes and cDNA expressed enzymes were utilized in these studies. In both systems, greater than 30% loss of PQ is consistent with P450 metabolism. While beyond the scope of this paper, we plan to extend these studies by definitively characterizing in vitro and in vivo metabolites of PQ.
A few points regarding the data warrant further discussion. Quercetin, a CYP2C8 inhibitor, exhibited the second highest extent of inhibition in our HLM studies at high and low parent drug concentrations, 66% and 59% respectively, and may represent a secondary metabolic pathway. However, CYP3A4 recombinant enzymes yielded the fastest turnover of PQ and this was significantly greater than turnover by CYP2C8. The inhibition studies with ketoconazole further support this conclusion. Collectively, these findings suggest that CYP3A4 is the major CYP enzyme involved in PQ metabolism. However, it remains possible that PQ could also be significantly metabolized by CYP2C8 in vivo, especially in the setting of CYP3A4 inhibition. Our findings are consistent with a lower Km of PQ for CYP3A4 than for CYP2C8. It is also possible that 0.2 µM PQ far exceeds the Km for both enzymes and a higher Vmax for CYP3A4 accounts for the significant metabolism through this pathway; this is less likely since typical incubations range between 1–10 µM. Further studies may be needed to elucidate the importance of the CYP2C8 pathway. The relative importance of gut and liver CYP3A4, particularly for first pass metabolism, will also require further studies.
CYP2D6 may also represent a minor metabolic pathway for PQ. Although our results were highly variable, quinidine (CYP2D6-specific inhibitor) showed 15% inhibition of PQ depletion at high initial concentrations. While the preparation of HLMs from 150 donors should have minimized the effect of 2D6 polymorphisms on metabolic activity, it is known that the variability of CYP2D6 makes it a difficult enzyme to characterize in vitro. CYP2D6 was not investigated further, as it was felt to be a minor pathway in comparison to 3A4 or 2C8 (Harper & Brassil 2008).
While our study utilized two approaches, it is clear that in vitro studies can not sufficiently address the complexities of human physiology involved in drug metabolism. It is difficult to simulate the actual in vivo ratio of enzyme to substrate concentrations, competition for the active site between alternate xenobiotics or biosynthetic intermediates, and evaluate for population variation of P450 enzymatic activity. Based on the structure of PQ and the recent identification of potential metabolites detected in urine, we and others postulated that P450 or FMO biotransformation may be likely modes of biotransformation (Tarning et al. 2006). Conversely, uridine 5′-diphosphoglucuronosyltransferases (UGTs) do not appear to likely play a major role in PQ metabolism, as no PQ glucuronide conjugates were isolated from previous urinary analysis (Tarning et al. 2006). However, it remains possible that other unidentified metabolites may be present.
Conclusions
With the addition of DHA-PQ to the list of 1st-line antimalarials, and the exceptional efficacy seen in recent studies, it is estimated that millions of doses of DHA-PQ will be dispensed annually. Surprisingly, despite this potential widespread use, knowledge of the biotransformation of this drug and its potential for drug–drug interactions has not been characterized. Our studies reveal that CYP3A4 metabolism, either in the liver or gut mucosa, is a potential pathway for PQ elimination. CYP3A4 is responsible for numerous clinically relevant drug–drug interactions. Thus, although our in vitro findings support only a moderate role for CYP3A4 in PQ metabolism, we feel that further investigation into whether these findings translate into meaningful in vivo interactions is warranted. We and others have recently demonstrated that several antiretrovirals, notably CYP3A4 inhibiting protease inhibitors, and CYP3A4-inducing non-nucleoside reverse transcriptase inhibitors can have potent effects on CYP3A4-mediated antimalarial metabolism (Slutsker & Marston 2007; German et al. 2009; Katrak et al. 2009). It will be prudent to investigate whether or not PQ will be subject to similar effects to these and other coadministered medications. Similarly, given the long half-life of PQ, it will be prudent to examine the potential inductive or inhibitory effects of PQ on major CYP isoforms. Further studies to characterize the in vivo metabolites of PQ, along with studies of the potential modulatory effects of PQ on CYP enzymes are planned.
Acknowledgments
The authors wish to acknowledge the University of California, San Francisco, School of Pharmacy Pharmaceutical Sciences Pathway faculty advisors, Drs. Richard Shafer and Stephen Kahl, for providing guidance and Academic Coordinator Carol Weinstein for providing assistance during this project.
Declaration of interest
Financial support for this work was provided by the Doris Duke Foundation [Grant #2007055].
References
- Bjornsson TD, Callaghan JT, Einolf HJ, Fischer V, Gan L, Grimm S, Kao J, King SP, Miwa G, Ni L, Kumar G, McLeod J, Obach RS, Roberts S, Roe A, Shah A, Snikeris F, Sullivan JT, Tweedie D, Vega JM, Walsh J, Wrighton SA Pharmaceutical Research and Manufacturers of America (PhRMA) Drug Metabolism/Clinical Pharmacology Technical Working Group; FDA Center for Drug Evaluation and Research (CDER) The conduct of in vitro and in vivo drug-drug interaction studies: A Pharmaceutical Research and Manufacturers of America (PhRMA) perspective. Drug Metab Dispos. 2003;31:815–832. doi: 10.1124/dmd.31.7.815. [DOI] [PubMed] [Google Scholar]
- Davis TM, Hung TY, Sim IK, Karunajeewa HA, Ilett KF. Piperaquine: A resurgent antimalarial drug. Drugs. 2005;65:75–87. doi: 10.2165/00003495-200565010-00004. [DOI] [PubMed] [Google Scholar]
- Donahue SR, Flockhart DA, Abernethy DR, Ko JW. Ticlopidine inhibition of phenytoin metabolism mediated by potent inhibition of CYP2C19. Clin Pharmacol Ther. 1997;62:572–577. doi: 10.1016/S0009-9236(97)90054-0. [DOI] [PubMed] [Google Scholar]
- Food and Drug Administration. Guidance for industry: Bioanalytical method validation. [Accessed on: 28 July, 2009];2001 Available at: http://www.fda.gov/downloads/Drugs/GuidanceComplianceRegulatoryInformation/Guidances/ucm070107.pdf.
- German P, Parikh S, Lawrence J, Dorsey G, Rosenthal PJ, Havlir D, Charlebois E, Hanpithakpong W, Lindegardh N, Aweeka FT. Lopinavir/ritonavir affects pharmacokinetic exposure of artemether/lumefantrine in HIV-uninfected healthy volunteers. J Acquir Immune Defic Syndr. 2009;51:424–429. doi: 10.1097/QAI.0b013e3181acb4ff. [DOI] [PubMed] [Google Scholar]
- Harper TW, Brassil PJ. Reaction phenotyping: Current industry efforts to identify enzymes responsible for metabolizing drug candidates. AAPS J. 2008;10:200–207. doi: 10.1208/s12248-008-9019-6. [DOI] [PMC free article] [PubMed] [Google Scholar]
- Hung TY, Davis TM, Ilett KF, Karunajeewa H, Hewitt S, Denis MB, Lim C, Socheat D. Population pharmacokinetics of piperaquine in adults and children with uncomplicated falciparum or vivax malaria. Br J Clin Pharmacol. 2004;57:253–262. doi: 10.1046/j.1365-2125.2003.02004.x. [DOI] [PMC free article] [PubMed] [Google Scholar]
- Jancová P, Anzenbacherová E, Papousková B, Lemr K, Luzná P, Veinlichová A, Anzenbacher P, Simánek V. Silybin is metabolized by cytochrome P450 2C8 in vitro. Drug Metab Dispos. 2007;35:2035–2039. doi: 10.1124/dmd.107.016410. [DOI] [PubMed] [Google Scholar]
- Kajosaari LI, Laitila J, Neuvonen PJ, Backman JT. Metabolism of repaglinide by CYP2C8 and CYP3A4 in vitro: Effect of fibrates and rifampicin. Basic Clin Pharmacol Toxicol. 2005;97:249–256. doi: 10.1111/j.1742-7843.2005.pto_157.x. [DOI] [PubMed] [Google Scholar]
- Karunajeewa HA, Ilett KF, Mueller I, Siba P, Law I, Page-Sharp M, Lin E, Lammey J, Batty KT, Davis TM. Pharmacokinetics and efficacy of piperaquine and chloroquine in Melanesian children with uncomplicated malaria. Antimicrob Agents Chemother. 2008;52:237–243. doi: 10.1128/AAC.00555-07. [DOI] [PMC free article] [PubMed] [Google Scholar]
- Katrak S, Gasasira A, Arinaitwe E, Kakuru A, Wanzira H, Bigira V, Sandison TG, Homsy J, Tappero JW, Kamya MR, Dorsey G. Safety and tolerability of artemether-lumefantrine versus dihydroartemisinin-piperaquine for malaria in young HIV-infected and uninfected children. Malar J. 2009;8:272. doi: 10.1186/1475-2875-8-272. [DOI] [PMC free article] [PubMed] [Google Scholar]
- Ko JW, Desta Z, Soukhova NV, Tracy T, Flockhart DA. In vitro inhibition of the cytochrome P450 (CYP450) system by the antiplatelet drug ticlopidine: Potent effect on CYP2C19 and CYP2D6. Br J Clin Pharmacol. 2000;49:343–351. doi: 10.1046/j.1365-2125.2000.00175.x. [DOI] [PMC free article] [PubMed] [Google Scholar]
- Kunze KL, Trager WF. Isoform-selective mechanism-based inhibition of human cytochrome P450 1A2 by furafylline. Chem Res Toxicol. 1993;6:649–656. doi: 10.1021/tx00035a009. [DOI] [PubMed] [Google Scholar]
- Lindegardh N, Annerberg A, White NJ, Day NP. Development and validation of a liquid chromatographic-tandem mass spectrometric method for determination of piperaquine in plasma stable isotope labeled internal standard does not always compensate for matrix effects. J Chromatogr B Analyt Technol Biomed Life Sci. 2008;862:227–236. doi: 10.1016/j.jchromb.2007.12.011. [DOI] [PubMed] [Google Scholar]
- Myint HY, Ashley EA, Day NP, Nosten F, White NJ. Efficacy and safety of dihydroartemisinin-piperaquine. Trans R Soc Trop Med Hyg. 2007;101:858–866. doi: 10.1016/j.trstmh.2007.05.018. [DOI] [PubMed] [Google Scholar]
- Rodrigues AD. Prioritization of clinical drug interaction studies using in vitro cytochrome P450 data: Proposed refinement and expansion of the “rank order” approach. Drug Metab Lett. 2007;1:31–35. doi: 10.2174/187231207779814247. [DOI] [PubMed] [Google Scholar]
- Röshammar D, Hai TN, Friberg Hietala S, Van Huong N, Ashton M. Pharmacokinetics of piperaquine after repeated oral administration of the antimalarial combination CV8 in 12 healthy male subjects. Eur J Clin Pharmacol. 2006;62:335–341. doi: 10.1007/s00228-005-0084-9. [DOI] [PubMed] [Google Scholar]
- Singhal P, Gaur A, Gautam A, Varshney B, Paliwal J, Batra V. Sensitive and rapid liquid chromatography/tandem mass spectrometric assay for the quantification of piperaquine in human plasma. J Chromatogr B Analyt Technol Biomed Life Sci. 2007;859:24–29. doi: 10.1016/j.jchromb.2007.09.021. [DOI] [PubMed] [Google Scholar]
- Slutsker L, Marston BJ. HIV and malaria: Interactions and implications. Curr Opin Infect Dis. 2007;20:3–10. doi: 10.1097/QCO.0b013e328012c5cd. [DOI] [PubMed] [Google Scholar]
- Störmer E, Brockmöller J, Roots I, Schmider J. Cytochrome P-450 enzymes and FMO3 contribute to the disposition of the antipsychotic drug perazine in vitro. Psychopharmacology (Berl) 2000a;151:312–320. doi: 10.1007/s002130000489. [DOI] [PubMed] [Google Scholar]
- Störmer E, Roots I, Brockmöller J. Benzydamine N-oxidation as an index reaction reflecting FMO activity in human liver microsomes and impact of FMO3 polymorphisms on enzyme activity. Br J Clin Pharmacol. 2000b;50:553–561. doi: 10.1046/j.1365-2125.2000.00296.x. [DOI] [PMC free article] [PubMed] [Google Scholar]
- Tarning J, Bergqvist Y, Day NP, Bergquist J, Arvidsson B, White NJ, Ashton M, Lindegårdh N. Characterization of human urinary metabolites of the antimalarial piperaquine. Drug Metab Dispos. 2006;34:2011–2019. doi: 10.1124/dmd.106.011494. [DOI] [PubMed] [Google Scholar]
- Tarning J, Lindegardh N. Quantification of the antimalarial piperaquine in plasma. Trans R Soc Trop Med Hyg. 2008;102:409–411. doi: 10.1016/j.trstmh.2008.02.011. [DOI] [PubMed] [Google Scholar]
- World Health Organization. Guidelines for the treatment of malaria/World Health Organization. 2010 Available at: http://whqlibdoc.who.int/publications/2010/9789241547925_eng.pdf.
- Zhang W, Ramamoorthy Y, Kilicarslan T, Nolte H, Tyndale RF, Sellers EM. Inhibition of cytochromes P450 by antifungal imidazole derivatives. Drug Metab Dispos. 2002;30:314–318. doi: 10.1124/dmd.30.3.314. [DOI] [PubMed] [Google Scholar]


