

Abstract
Background
The objective of this study was to estimate the prevalence of possible oral corticosteroid (OCS)-related side effects and health care resource use and costs in patients with asthma.
Methods
This was a cross-sectional, matched-cohort, retrospective study using a commercial claims database. Adults with asthma diagnosis codes and evidence of asthma medication use were studied. Patients with high OCS use (≥30 days of OCS annually) were divided into those who did versus those who did not experience OCS-related possible side effects. Their health care resource use and costs were compared using linear regression or negative binomial regression models, adjusting for age, sex, geographic region, Charlson Comorbidity Index score, and chronic obstructive pulmonary disease status.
Results
After adjustment, high OCS users with possible side effects were more likely to have office visits (23.0 vs 19.6; P<0.001) and hospitalizations (0.44 vs 0.22; P<0.001) than those without possible side effects. Emergency department visits were similar between the groups. High OCS users with possible side effects had higher adjusted total annual mean health care costs ($25,168) than those without such side effects ($21,882; P=0.009).
Conclusion
Among high OCS users, patients with possible OCS-related side effects are more likely to use health care services than those without such side effects. Although OCS may help control asthma and manage exacerbations, OCS side effects may result in additional health care resource use and costs, highlighting the need for OCS-sparing asthma therapies.
Keywords: adverse effect, asthma, cost, health care resource use, oral corticosteroid, side effect
Introduction
Asthma, a high-burden inflammatory disease of the lungs, affects an estimated 16.5 million adults and 6.1 million children in the USA.1 About one in two asthma sufferers – 11 million people – reported having at least one asthma attack, and 3,630 people died because of asthma in 2013.1 In 2010, asthma in the USA resulted in 439,435 hospitalizations, 1.8 million emergency department (ED) visits, and 14.2 million outpatient visits.2 Asthma is associated with an estimated $50 billion (2009 dollars) in total direct incremental costs annually. Productivity loss related to illness accounts for an additional $3.8 billion and productivity loss from mortality accounts for another $2.1 billion.3
Moderate and severe asthma exacerbations are often treated with oral corticosteroids (OCSs). OCS therapy for an acute asthma exacerbation renders a 44% relative risk reduction in asthma relapse.4 The National Heart, Lung, and Blood Institute’s asthma management guidelines recommend long-term OCS therapy in patients with severe persistent asthma (step 6) and intermittent short-term OCS therapy to manage exacerbations and prevent recurrence of exacerbations at any asthma severity.5 Although economical from a drug cost and acquisition perspective, OCS has been associated with dose- and duration-dependent debilitating adverse events, including bone fractures, diabetes mellitus, infections, hypertension, and cataracts.6
Evidence related to the economic costs attributable to OCS-related side effects has the possibility to inform health care policy and practice about the trade-offs of OCS use for asthma control. Our aim was to estimate the prevalence and health care burden of possible OCS-related side effects in patients with asthma.
Methods
Data source
We used a US commercial claims database (January 1, 2008–December 31, 2009) to examine the costs and resource utilization among patients with asthma. Data from years 2008 and 2009 (Figure 1) were used to identify patients with asthma and their OCS exposure, events that can be classified as possible OCS-related side effects and study outcomes (described in detail in the “Outcome variables” section). Claims described details of each physician visit, medical procedure, hospitalization, drug dispensed, and test performed. Claims also contained information on member health plan enrollment and benefits, patient demographics, and provider and hospital characteristics. Data came from all major US regions.
Figure 1.
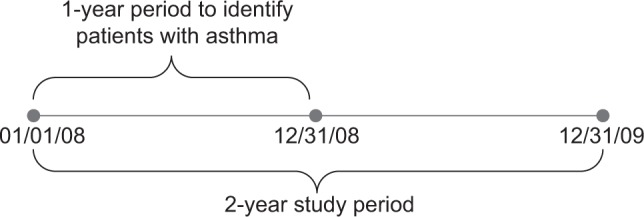
Study timeline.
The claims database is Health Insurance Portability and Accountability Act compliant and does not contain protected health information. This was a retrospective analysis of a large database with de-identified records, therefore, this study was exempt from institutional review board consideration: studies of secondary data that include no protected health information are not considered studies of human subjects in the US. This is because the definition of human subject in 45 CFR 46.102(f) includes living individuals about whom an investigator obtains identifiable private information for research purposes.
Study design and study population
Patients ≥18 years of age were included if, from January 1, 2008 through December 31, 2008, a) at least two of their medical claims were listed as an asthma diagnosis (International Classification of Diseases, Ninth Revision, Clinical Modification [ICD-9-CM] code 493.x), and b) if they had filled at least two asthma medications (Table S1). We excluded patients without continuous enrollment during the 2-year study period (2008–2009) or those who had received a parenteral corticosteroid.
A preanalysis study of OCS dosing indicated that very few (<1.5%) patients with less than a 30-day supply used >1 g of OCS in a year. Moreover, a 30-day supply represents at least five bursts of the most common short-term supply of OCS (6 days). Additionally, previous research showed that the risk of possible side effects in asthma substantially increases after 30 days of cumulative annual OCS exposure.7 Therefore, in this study, patients who had at least a 30-day supply of OCS in each of the years (2008 and 2009) were categorized as the high OCS use group.
We evaluated similarities between patients with and without possible side effects and used statistical adjustment (described in the “Outcome variables” section) to control for subgroup misbalances.
Variables
Patient descriptive characteristics
We obtained the following data: patient demographics (age, sex, US census region), baseline measures of disease burden, Charlson Comorbidity Index (CCI)8,9 score, number of chronic conditions experienced by each patient (calculated using the Healthcare Cost and Utilization Project Chronic Condition Indicator),10,11 and respiratory-related comorbidities (Table S2).
Possible side effects
In this cross-sectional analysis, events were identified as present or absent during the 2-year study period (2008–2009). Possible OCS side effects included the following conditions: fractures (nonvertebral or vertebral), osteoporosis, aseptic necrosis of the bone, hip replacement, opportunistic infections, obesity, pneumonia, cataracts, ulcer disease, hypertension, diabetes or abnormal glucose, lipid disorders, and glaucoma.6 We coded each side effect individually and created one variable that represented the occurrence of any of them. The ICD-9-CM and Current Procedural Terminology codes corresponding to each condition were used to identify each event. Medical claims for the 2-year target period (2008–2009) were searched for the applicable ICD-9-CM and Current Procedural Terminology codes (Table S2).
Outcome variables
All medical claims in the 2-year period (2008–2009) were included to evaluate the following outcomes: estimated overall and asthma-related cumulative health care costs and resources for each patient with asthma. Health care resource use included office visits, ED visits, and inpatient admissions. Health care resource use and costs were annualized.
We defined asthma-related claims as claims for asthma medications or those with asthma listed as a primary ICD-9-CM code. Asthma-related costs included the cost of asthma medications and costs associated with asthma-related claims. We disaggregated costs into pharmacy and medical costs.
Statistical analyses
To describe the study cohort, we summarized the following patient characteristics: patient demographics, baseline measures of disease burden, CCI score, number of chronic conditions experienced by each patient, and respiratory-related comorbidities. Descriptive statistics, including mean values, standard deviations, standard errors of the mean, medians, and percentages were reported for all measures. We conducted simple univariate comparisons of costs and number of office visits using two-sample Student’s t-test. To compare the number of inpatient hospitalizations and number of ED visits, we used the Wilcoxon rank-sum test. Chi square tests were used for categorical variables.
Consistent with our primary objective to estimate health care resource use and costs associated with possible OCS side effects, we compared crude (unadjusted) and adjusted costs and rates of health care use events in high OCS users with versus without possible side effects (combined). To adjust for baseline characteristics (age, sex, region, chronic obstructive pulmonary disease status), we ran multivariable regression models. Linear regression models were used for continuous variables (eg, costs and number of office visits) and negative binomial regression models for count variables such as number of hospitalizations or ED visits.
For the four most prevalent possible side effects (hypertension, diabetes, lipid disorders, and pneumonia, each individually), we repeated the models to understand how costs were affected by each possible side effect individually.
All data transformations and statistical analyses were performed using SAS® software (version 9.4; SAS Institute, Cary, NC, USA). All statistical tests were two-sided with a significance level of 0.05.
Results
Demographics and comorbidities of the identified high OCS use asthma patients (n=3,604; Figure 2) are reported in Table 1. Patients with possible side effects were older (age in years [95% confidence interval (CI)], 56.0 [55.6–56.5] vs 45.8 [44.8–46.8]; P<0.001) and sicker (mean CCI score [95% CI], 3.4 [3.3–3.5] vs 1.8 [1.6–1.9]; P<0.001) than their counterparts without possible side effects.
Figure 2.

Study cohort selection.
Abbreviations: IV, intravenous; OCS, oral corticosteroid.
Table 1.
High OCS use: patient demographics and comorbidity
| Characteristic | Without possible side effects, n=593 | With possible side effects, n=3,011 | P-value |
|---|---|---|---|
| Mean (SD) age (years) | 45.8 (12.2) | 56.0 (12.1) | <0.001a,b |
| 95% CI | 44.8–46.8 | 55.6–56.5 | |
| Age (years), n (%) | <0.001a,c | ||
| 18–34 | 105 (17.7) | 134 (4.5) | |
| 35–44 | 162 (27.3) | 343 (11.4) | |
| 45–54 | 189 (31.9) | 828 (27.5) | |
| 55–64 | 106 (17.9) | 1,091 (36.2) | |
| ≥65 | 31 (5.2) | 615 (20.4) | |
| Female, n (%) | 392 (66.1) | 2,061 (68.4) | 0.263a,c |
| Region, n (%) | 0.320a,c | ||
| Midwest | 160 (27.0) | 772 (25.6) | |
| Northeast | 72 (12.1) | 366 (12.2) | |
| South | 259 (43.7) | 1,425 (47.3) | |
| West | 102 (17.2) | 448 (14.9) | |
| Mean (SD) Charlson | 1.8 (1.4) | 3.4 (2.7) | <0.001a,b |
| Comorbidity Index score | |||
| 95% CI | 1.6–1.9 | 3.3–3.5 | |
| COPD, n (%) | 115 (19.4) | 1,503 (49.9) | <0.001a,c |
Notes:
Comparison between groups without versus with possible side effects among high OCS users.
two-sample Student’s t-test.
chi-square-test.
Abbreviations: CI, confidence interval; COPD, chronic obstructive pulmonary disease; OCS, oral corticosteroid; SD, standard deviation.
In unadjusted comparisons, mean (95% CI) annualized all-cause health care claims totaled $26,355 ($25,264–$27,447) for patients with possible side effects versus $15,851 ($14,394–$17,307) for patients without possible side effects (P<0.001). This difference was driven in part by a higher mean (95% CI) number of office visits and hospitalizations (office visits, 23.4 [22.9–24.0] vs 17.6 [16.4–18.8]; P<0.001; hospitalizations, 0.60 [0.56–0.63] vs 0.19 [0.15–0.23]; P<0.001) in patients with possible side effects than in those without possible side effects (Table 2). ED visit rates were not statistically significant between the subgroups. Asthma-related health office visits and ED visits were comparable between subgroups. However, asthma-related hospitalizations were more common in patients with possible side effects (0.11 [0.10–0.12] vs 0.04 [0.03–0.06]; P<0.001).
Table 2.
Unadjusted annualized all-cause and asthma-related health care resource use for high OCS use patients, stratified by possible side effect group
| Mean (SD) health care resource | Without possible side effects, n=593 | With possible side effects, n=3,011 | P-valuea |
|---|---|---|---|
| All-cause | |||
| Number of office visits | 17.6 (14.7) | 23.4 (15.5) | <0.001b |
| 95% CI | 16.4–8.8 | 22.9–24.0 | |
| Number of inpatient hospitalizations/year | 0.19 (0.49) | 0.60 (0.94) | <0.001c |
| 95% CI | 0.15–0.23 | 0.56–0.63 | |
| Number of emergency department visits/year | 0.84 (3.24) | 0.78 (2.90) | 0.698c |
| 95% CI | 0.58–1.10 | 0.67–0.88 | |
| Asthma-relatedd | |||
| Number of office visits | 3.3 (4.6) | 3.1 (5.0) | 0.384b |
| 95% CI | 2.9–3.7 | 2.9–3.3 | |
| Number of inpatient hospitalizations/year | 0.04 (0.17) | 0.11 (0.36) | <0.001c |
| 95% CI | 0.03–0.06 | 0.10–0.12 | |
| Number of emergency department visits/year | 0.06 (0.64) | 0.03 (0.36) | 0.051c |
| 95% CI | 0.01–0.11 | 0.02–0.05 |
Notes:
Comparison between groups without versus with possible side effect among high OCS users.
two-sample Student’s t-test.
Wilcoxon rank-sum test.
Claims with primary diagnosis of asthma.
Abbreviations: CI, confidence interval; OCS, oral corticosteroid; SD, standard deviation.
In multivariable analyses, a similar pattern emerged for annual health care costs and resource use. High OCS use patients with possible side effects had significantly higher mean (95% CI) adjusted total costs ($25,168 [$24,223–$26,113] vs $21,882 [$19,644–$24,121]; P=0.009; data not shown) than their counterparts without possible side effects. This discrepancy was driven by a higher mean (95% CI) adjusted number of office visits (23.0 [22.5–23.6] vs 19.6 [18.3–20.9]; P<0.001) and a higher adjusted number of hospitalizations per year (0.44 [0.41–0.46] vs 0.22 [0.18–0.27]; P<0.001) in patients with possible side effects than in those without possible side effects (Table 3).
Table 3.
High OCS use patients with and without possible side effects: adjusteda annualized health care resource use
| Adjusted meana (SE) health care resource | Without possible side effects, n=593 | With possible side effects, n=3,011 | P-valueb |
|---|---|---|---|
| All-cause | |||
| Number of office visits | 19.6 (0.6) | 23.0 (0.3) | <0.001 |
| 95% CI | 18.3–20.9 | 22.5–23.6 | |
| Number of inpatient hospitalizations/year | 0.22 (0.02) | 0.44 (0.01) | <0.001 |
| 95% CI | 0.18–0.27 | 0.41–0.46 | |
| Number of emergency department visits/year | 0.66 (0.10) | 0.73 (0.04) | 0.549 |
| 95% CI | 0.50–0.88 | 0.64–0.82 | |
| Asthma-related | |||
| Number of asthma-related office visits | 2.9 (0.2) | 3.2 (0.1) | 0.205 |
| 95% CI | 2.5–3.3 | 3.0–3.4 | |
| Number of asthma-related inpatient hospitalizations/year | 0.03 (0.007) | 0.07 (0.006) | <0.001 |
| 95% CI | 0.02–0.05 | 0.06–0.09 | |
| Number of asthma-related emergency department visits/year | 0.01 (0.005) | 0.02 (0.003) | 0.451 |
| 95% CI | 0.01–0.03 | 0.01–0.02 |
Notes:
Adjusted by age group in years, sex, region, Charlson Comorbidity Index score, and chronic obstructive pulmonary disease status.
Comparison between groups without versus with possible side effects.
Abbreviations: CI, confidence interval; OCS, oral corticosteroid; SE, standard error.
Adjusted mean (95% CI) annualized asthma-related health care costs did not differ between the groups with ($4,213 [$3,990–$4,435]) and without ($3,952 [$3,424–$4,480]; P=0.382) possible side effects. However, patients with possible side effects had more asthma-related hospitalizations than patients without possible side effects (0.07 [0.06–0.09] vs 0.03 [0.02–0.05]; P<0.001). Asthma-related office visits and ED visits were comparable between the subgroups. Tables S3–S10 show the effect of all confounders (including CCI score and chronic obstructive pulmonary disease comorbidity) on outcomes.
Similar discrepancy in costs persisted when the four most common side effects (hypertension, diabetes, lipid disorders, and pneumonia) were studied in isolation. The unadjusted total all-cause costs in patients who experienced each of these possible side effects were higher than such costs in patients who did not experience these possible side effects (Table 4).
Table 4.
High OCS use patients (n=3,604) with or without possible side effects: mean total unadjusted annualized health care costsa estimated for individual possible side effect
| Potential side effect of interest | Total costs | Total prescription costs | Total nonprescription costs | ||||||
|---|---|---|---|---|---|---|---|---|---|
|
| |||||||||
| Without possible side effect of interest | With possible side effect of interest | P-valuea | Without possible side effect of interest | With possible side effect of interest | P-valuea | Without possible side effect of interest | With possible side effect of interest | P-valuea | |
| Hypertension | |||||||||
| n | 1,336 | 2,268 | 1,336 | 2,268 | 1,336 | 2,268 | |||
| Mean (SD) | $18,095 ($20,326) | $28,475 ($32,621) | <0.001 | $7,215 ($8,968) | $10,255 ($10,935) | <0.001 | $10,880 ($15,820) | $18,220 ($27,708) | <0.001 |
| 95% CI | $17,004–$19,186 | $27,131–$29,818 | $6,733–$7,696 | $9,805–$10,705 | $10,031–$11,730 | $17,079–$19,361 | |||
| Diabetes | |||||||||
| n | 2,377 | 1,277 | 2,377 | 1,277 | 2,377 | 1,277 | |||
| Mean (SD) | $21,727 ($27,189) | $30,244 ($31,795) | <0.001 | $8,323 ($9,970) | $10,687 ($10,895) | <0.001 | $13,404 ($22,649) | $19,558 ($26,645) | <0.001 |
| 95% CI | $20,634–$22,821 | $28,463–$32,025 | $7,922–$8,724 | $10,076–$11,297 | $12,493–$14,315 | $18,065–$21,050 | |||
| Lipid disorder | |||||||||
| n | 1,616 | 1,988 | 1,616 | 1,988 | 1,616 | 1,988 | |||
| Mean (SD) | $22,456 ($30,917) | $26,392 ($27,448) | <0.001 | $8,015 ($9,975) | $10,033 ($10,568) | <0.001 | $14,441 ($25,912) | $16,359 ($22,791) | 0.020 |
| 95% CI | $20,947–$23,964 | $25,185–$27,599 | $7,528–$8,502 | $9,568–$10,497 | $13,177–$15,705 | $15,357–$17,362 | |||
| Pneumonia | |||||||||
| n | 2,582 | 1,022 | 2,582 | 1,022 | 2,582 | 1,022 | |||
| Mean (SD) | $21,431 ($25,496) | $32,702 ($35,459) | <0.001 | $8,354 ($9,402) | $11,083 ($12,226) | <0.001 | $13,077 ($21,494) | $21,619 ($29,258) | <0.001 |
| 95% CI | $20,447–$22,415 | $30,526–$34,879 | $7,991–$8,717 | $10,333–$11,834 | $12,247–$13,906 | $19,823–$23,415 | |||
Note:
Comparison between groups without potential side effects versus with potential side effects; two-sample Student’s t-test. Values shown in US dollars.
Abbreviations: CI, confidence interval; OCS, oral corticosteroid; SD, standard deviation.
Discussion
Our findings suggest that the health care system may bear significant overall costs (primarily nonasthma related) owing to events that could be possible side effects of OCS use. Although OCS drug acquisition costs may be low, the trade-off of their use for asthma control includes side effects, which result in additional costs to the health care system.
High OCS use asthma patients with evidence of possible side effects had higher total health care costs and health care resource use (driven primarily by office visits and hospitalizations) than patients without side effects. These findings support the argument that the OCS-related side effects contribute to the difference in health care resource use and costs between high OCS users and non-OCS users. These results concur with a publication by Lefebvre et al, reporting that Medicaid data in selected states demonstrated high-dose use of OCS was associated with increased health care resource use and costs due to OCS-related complications.12
Patients with severe asthma and patients with poor asthma management use health care resources often, and their care is costly.13 While OCS regimens vary widely,14 high OCS use (≥30 days per year) is likely to occur when patients (typically with severe asthma, poorly controlled asthma, or both) use OCS long term or resort to frequent OCS bursts to manage their asthma exacerbations. The data show a striking (almost two-fold) difference in costs between high OCS users versus matched non-OCS users.
Steps toward achieving clinical control and preventing disease exacerbation are paramount to asthma management.15 Multiple alternative interventions that may help control severe asthma in lieu of chronic or frequent OCS use include behavioral measures to improve adherence to inhaled asthma therapies, allergen avoidance, allergen immunotherapy, treatment by an asthma specialist, or alternative asthma therapies.5,15 Patients and clinicians should expect optimal control of symptoms. Besides drug acquisition costs, decisions regarding therapeutic choices should take into account potential costs associated with adverse treatment effects.
Limitations
The results of this study should be interpreted in light of its limitations. Owing to the limitations of the claims, it is impossible to determine with complete certainty whether the side effects actually resulted from OCS exposure. In addition, not all patients respond in the same manner to OCS, and some patients may better tolerate OCS and have fewer side effects than others.
Although our multivariable analyses of high OCS users with versus without possible side effects controlled for the observable confounders (demographics, chronic obstructive pulmonary disease status, and comorbidities), there is still the possibility for unmeasured confounders. In particular, an observant reader may argue that we did not control for asthma severity or asthma control factors, both of which might drive increased costs. Indeed, clinical factors, such as spirometry results or patient-reported measurements of asthma severity or control, were not available in the data. However, the excess OCS-related possible side effects such as hypertension, diabetes, and fractures observed within the OCS cohort would not be expected to result from differences in asthma severity.
Differences in asthma severity have not likely biased the main outcomes between patients with asthma with versus without possible side effects. Adjusted asthma costs in these two groups were not statistically significantly different (even with a large sample size); therefore, it would be safe to assume that the differences in adjusted health care resource use and costs between patients with versus without possible side effects were driven by the side effects themselves, as opposed to the differences in their asthma severity.
The current study focused on patients with asthma with high OCS use (≥30 days per year) only. Understanding the dose-dependent nature of the effect of OCS on possible side effects would further enhance our understanding of risks associated with OCS use. Future research is needed to investigate the relationship between OCS use and possible side effects in a dose-dependent manner. In addition, because the study was a matched case-control study, the rate of OCS-related side effects represented prevalence, not incidence.
Additionally, this study used administrative claims data, which did now allow capturing the effects of OCS use on quality of life. According to Hyland et al, current health-related quality of life scales fail to adequately capture the burden of OCS on quality of life. Therefore, clinical studies tend to underestimate the benefit of OCS-sparing treatments in patients with severe asthma and frequent OCS exposure.16
Despite its limitations, this analysis offers insights into potential contributors to the high cost of asthma care in real-world settings in the USA. Nonetheless, gaps in knowledge remain, and future research may help address them. An OCS treatment registry may help study the corticosteroid use patterns (ie, daily use in severe asthma vs bursts for exacerbation management) and incidence of specific side effects. A retrospective longitudinal cohort study in electronic medical records linked to health care claims matched for clinical markers of asthma severity would enable a well-controlled analysis of cost consequences of OCS exposure, including possible associated side effects.
Conclusion
Presence of possible high OCS use side effects was associated with an additional increase in all-cause health care resource use and costs. The potential consequences of OCS stress the importance of limiting OCS use and of considering alternative therapies for severe or difficult-to-control asthma.
Acknowledgments
The authors would like to thank Dorothy Romanus, PhD, a former employee of Partnership for Health Analytic Research, LLC, for her contribution to the study design and analysis. Medical writing support for this manuscript was provided by Charlotte Kenreigh of Excel Scientific Solutions and funded by Genentech, Inc. and Novartis Pharmaceuticals Corporation. Portions of this study were presented at the Academy of Managed Care Pharmacy NEXUS 2015, October 26–29, 2015, Orlando, FL; Health Care Resource Use and Costs Associated with Side Effects of High Oral Corticosteroid Use in Asthma: A Claims-Based Analysis.
Footnotes
Disclosures
This study was funded by Genentech, Inc. Dr Luskin has received consulting and lecture fees, research and travel support, and payment for developing educational presentations from Genentech, Inc.; he has also received lecture fees from Merck. Dr Antonova and Dr Omachi are employees of Genentech, Inc. Dr Broder and Dr Chang are employees of Partnership for Health Analytic Research, LLC, which received funding from Genentech, Inc. to conduct this research. Dr Ledford has received research grant and consulting fees or honoraria from Genentech, Inc.; has consultant arrangements with AstraZeneca, Saieva & Stine, and Shook, Hardy & Bacon; has received research grants from Forest, Merck, Teva, and ViroPharma; and has received payment for lectures from Meda and the South Carolina Allergy, Asthma and Immunology Society.
References
- 1.Centers for Disease Control and Prevention [webpage on the Internet] Most Recent Asthma Data. [Accessed November 18, 2015]. [updated April 14, 2016]. Available from: http://www.cdc.gov/asthma/most_recent_data.htm.
- 2.Centers for Disease Control and Prevention [webpage on the Internet] Asthma Facts: CDC’s National Asthma Control Program Grantees. [Accessed November 18, 2015]. [updated July 2013]. Available from: http://www.cdc.gov/asthma/pdfs/asthma_facts_program_grantees.pdf.
- 3.Barnett SB, Nurmagambetov TA. Costs of asthma in the United States: 2002–2007. J Allergy Clin Immunol. 2011;127(1):145–152. doi: 10.1016/j.jaci.2010.10.020. [DOI] [PubMed] [Google Scholar]
- 4.Rowe BH, Spooner CH, Ducharme FM, Bretzlaff JA, Bota GW. Corticosteroids for preventing relapse following acute exacerbations of asthma. Cochrane Database Syst Rev. 2007;3:CD000195. doi: 10.1002/14651858.CD000195.pub2. [DOI] [PMC free article] [PubMed] [Google Scholar]
- 5.Holden MT, Hsu LY, Kurt K, et al. A genomic portrait of the emergence, evolution, and global spread of a methicillin-resistant Staphylococcus aureus pandemic. Genome Res. 2013;23(4):653–664. doi: 10.1101/gr.147710.112. [DOI] [PMC free article] [PubMed] [Google Scholar]
- 6.Liu D, Ahmet A, Ward L, et al. A practical guide to the monitoring and management of the complications of systemic corticosteroid therapy. Allergy Asthma Clin Immunol. 2013;9(1):30. doi: 10.1186/1710-1492-9-30. [DOI] [PMC free article] [PubMed] [Google Scholar]
- 7.Zazzali JL, Broder MS, Omachi TA, Chang E, Sun GH, Raimundo K. Risk of corticosteroid-related adverse events in asthma patients with high oral corticosteroid use. Allergy Asthma Proc. 2015;36(4):268–274. doi: 10.2500/aap.2015.36.3863. [DOI] [PubMed] [Google Scholar]
- 8.Charlson ME, Pompei P, Ales KL, MacKenzie CR. A new method of classifying prognostic comorbidity in longitudinal studies: development and validation. J Chronic Dis. 1987;40(5):373–383. doi: 10.1016/0021-9681(87)90171-8. [DOI] [PubMed] [Google Scholar]
- 9.Deyo RA, Cherkin DC, Ciol MA. Adapting a clinical comorbidity index for use with ICD-9-CM administrative databases. J Clin Epidemiol. 1992;45(6):613–619. doi: 10.1016/0895-4356(92)90133-8. [DOI] [PubMed] [Google Scholar]
- 10.Healthcare Cost and Utilization Project (HCUP) [webpage on the Internet] Chronic Condition Indicator (CCI) for ICD-9-CM. [Accessed November 18, 2015]. [updated May 2016]. Available from: http://www.hcup-us.ahrq.gov/toolssoftware/chronic/chronic.jsp.
- 11.Hwang W, Weller W, Ireys H, Anderson G. Out-of-pocket medical spending for care of chronic conditions. Health Aff (Millwood) 2001;20(6):267–278. doi: 10.1377/hlthaff.20.6.267. [DOI] [PubMed] [Google Scholar]
- 12.Lefebvre P, Duh MS, Lafeuille MH, et al. Acute and chronic systemic corticosteroid-related complications in patients with severe asthma. J Allergy Clin Immunol. 2015;136(6):1488–1495. doi: 10.1016/j.jaci.2015.07.046. [DOI] [PubMed] [Google Scholar]
- 13.Bahadori K, Doyle-Waters MM, Marra C, Lynd L, Alasaly K, Swiston J, FitzGerald JM. Economic burden of asthma: a systematic review. BMC Pulm Med. 2009;9:24. doi: 10.1186/1471-2466-9-24. [DOI] [PMC free article] [PubMed] [Google Scholar]
- 14.Fuhlbrigge AL, Lemanske RF, Jr, Rasouliyan L, Sorkness CA, Fish JE. Practice patterns for oral corticosteroid burst therapy in the outpatient management of acute asthma exacerbations. Allergy Asthma Proc. 2012;33(1):82–89. doi: 10.2500/aap.2012.33.3499. [DOI] [PubMed] [Google Scholar]
- 15.Jansen KU, Girgenti DQ, Scully IL, Anderson AS. Vaccine review: Staphyloccocus aureus vaccines: problems and prospects. Vaccine. 2013;31(25):2723–2730. doi: 10.1016/j.vaccine.2013.04.002. [DOI] [PubMed] [Google Scholar]
- 16.Hyland ME, Whalley B, Jones RC, Masoli M. A qualitative study of the impact of severe asthma and its treatment showing that treatment burden is neglected in existing asthma assessment scales. Qual Life Res. 2015;24(3):631–639. doi: 10.1007/s11136-014-0801-x. [DOI] [PubMed] [Google Scholar]